Both Elliott wave counts expected downwards movement for Monday, which is what happened.
Summary: The bull and bear wave counts again diverge. The bear wave count expects downwards movement to continue. The bull wave count expects upwards movement from here. The differentiating line is the upper blue trend line on the daily charts. For confidence in a bull wave count, that trend line must be breached by a full daily candlestick above it and not touching it. Only then may some confidence be had in a trend change from bear to bull.
Changes to last analysis are bold.
To see the bigger picture on weekly charts click here.
BEAR ELLIOTT WAVE COUNT
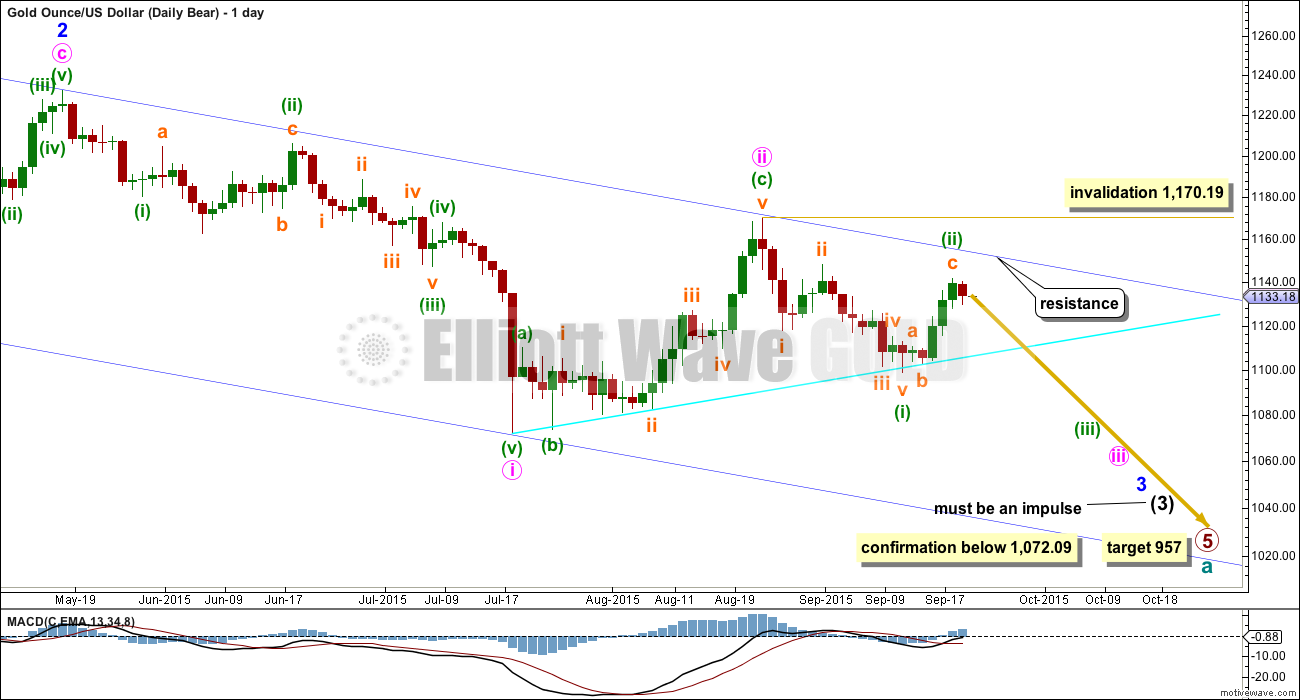
Gold has been in a bear market since September 2011. There has not yet been confirmation of a change from bear to bull, and so at this stage any bull wave count would be trying to pick a low which is not advised. Price remains below the 200 day moving average and below the blue trend line (copied over from the weekly chart). The bear market should be expected to be intact until we have technical confirmation of a big trend change.
This wave count now sees a series of four overlapping first and second waves: intermediate waves (1) and (2), minor waves 1 and 2, minute waves i and ii, and now minuette waves (i) and (ii). Minute wave iii should show a strong increase in downwards momentum beyond that seen for minute wave i. If price moves higher, then it should find very strong resistance at the blue trend line. If that line is breached, then a bear wave count should be discarded.
The blue channel is drawn in the same way on both wave counts. The upper edge will be critical. Here the blue channel is a base channel drawn about minor waves 1 and 2. A lower degree second wave correction should not breach a base channel drawn about a first and second wave one or more degrees higher. If this blue line is breached by one full daily candlestick above it and not touching it, then this wave count will substantially reduce in probability.
Minuette wave (ii) may not move beyond the start of minuette wave (i) above 1,170.19. A breach of that price point should see this wave count discarded as it would also now necessitate a clear breach of the blue channel and the maroon channel from the weekly chart.
Downwards movement from 1,170.19 will subdivide as a complete five wave impulse on the hourly chart, but on the daily chart it does not have a clear five wave look. Subminuette wave iii has disproportionate second and fourth waves within it giving this movement a three wave look on the daily chart.
Full and final confirmation of this wave count would come with a new low below 1,072.09.
If primary wave 5 reaches equality with primary wave 1, then it would end at 957. With three big overlapping first and second waves, now this target may not be low enough.
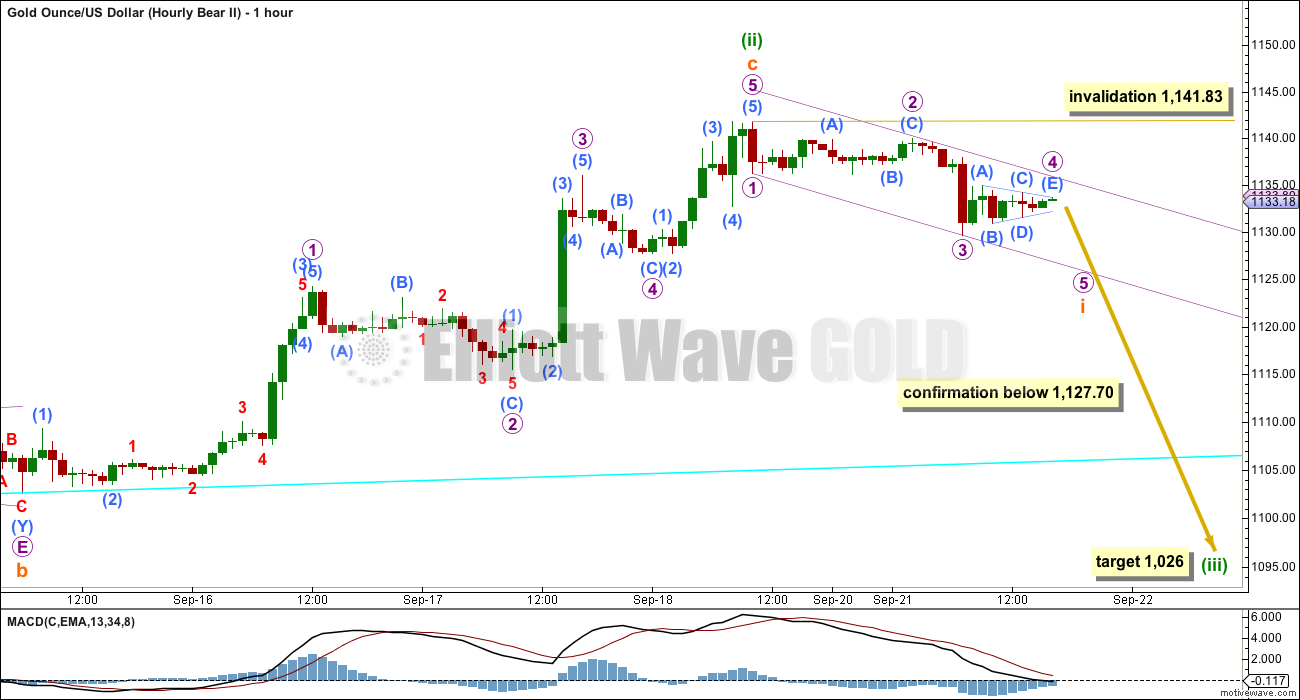
The channel which was drawn about upwards movement on the hourly bear wave count for last analysis was clearly breached. This provided first indication that upwards movement may be over. For this bear wave count, minuette wave (ii) should now be over and minuette wave (iii) downwards should have begun.
A five down on the hourly chart is so far incomplete. If micro wave 4 remains below micro wave 1 price territory and we see some more downwards movement, then this bear wave count will increase in probability. Micro wave 4 may not move into micro wave 1 price territory above 1,136.18.
Draw a small channel about this downwards movement using Elliott’s technique: draw the first trend line from the ends of micro waves 1 to 3 then place a parallel copy on the end of micro wave 2. Micro wave 4 should remain contained within this channel. Micro wave 5 may end about the lower edge of the channel.
Micro wave 4 looks like it may be unfolding as a small triangle, which fits on the five minute chart.
If a five down completes, then it may be a first wave for subminuette wave i which should be followed by a three up. Subminuette wave ii may not move beyond the start of subminuette wave i above 1,141.83.
BULL ELLIOTT WAVE COUNT
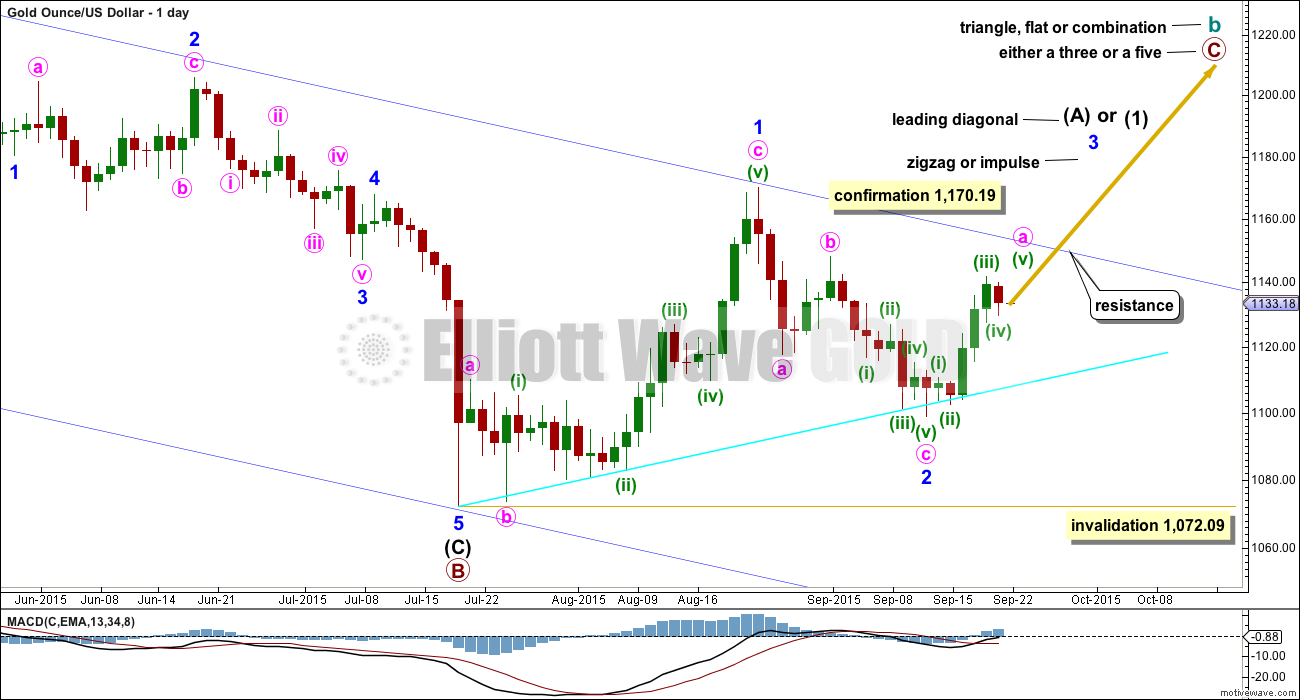
The bull wave count sees cycle wave a complete and cycle wave b underway as either an expanded flat, running triangle or combination. This daily chart works for all three ideas at the weekly chart level.
For all three ideas, a five up should unfold at the daily chart level for a movement at primary degree. This is so far incomplete. With the first wave up being a complete zigzag the only structure left now for intermediate wave (1) or (A) would be a leading diagonal. While leading diagonals are not rare they are not very common either. This reduces the probability of this bull wave count.
A leading diagonal requires the second and fourth waves to subdivide as zigzags. The first, third and fifth waves are most commonly zigzags, the but sometimes may appear to be impulses. So far minor wave 1 fits well as a zigzag.
Minor wave 2 may not move beyond the start of minor wave 1 below 1,072.09. If this invalidation point is breached, then it would be very difficult to see how primary wave B could continue yet lower. It would still be technically possible that primary wave B could be continuing as a double zigzag, but it is already 1.88 times the length of primary wave A (longer than the maximum common length of 1.38 times), so if it were to continue to be even deeper, then that idea has a very low probability. If 1,072.09 is breached, then I may cease to publish any bullish wave count because it would be fairly clear that Gold would be in a bear market for cycle wave a to complete.
To the upside, a new high above 1,170.19 would invalidate the bear wave count and provide strong confirmation for this bull wave count.
Upwards movement is finding resistance at the upper edge of the blue channel and may continue to do so. Use that trend line for resistance, and if it is breached, then expect a throwback to find support there.
I added a bright aqua blue trend line to this chart. Price has found support there and is bouncing up.
Minor wave 2 can now be seen as a complete zigzag. It is 0.73 the depth of minor wave 1, nicely within the normal range of between 0.66 to 0.81 for a second wave within a diagonal.
Third waves within leading diagonals are most commonly zigzags, but sometimes they may be impulses. Minor wave 3 should show some increase in upwards momentum beyond that seen for minor wave 1. Minor wave 3 must move above the end of minor wave 1 above 1,170.19. That would provide price confirmation of the bull wave count and invalidation of the bear.
Minor wave 3 is most likely to subdivide as a zigzag. Within a zigzag, minute wave a must subdivide as a five wave structure.
Minute wave a would be an incomplete five wave impulse at this stage.
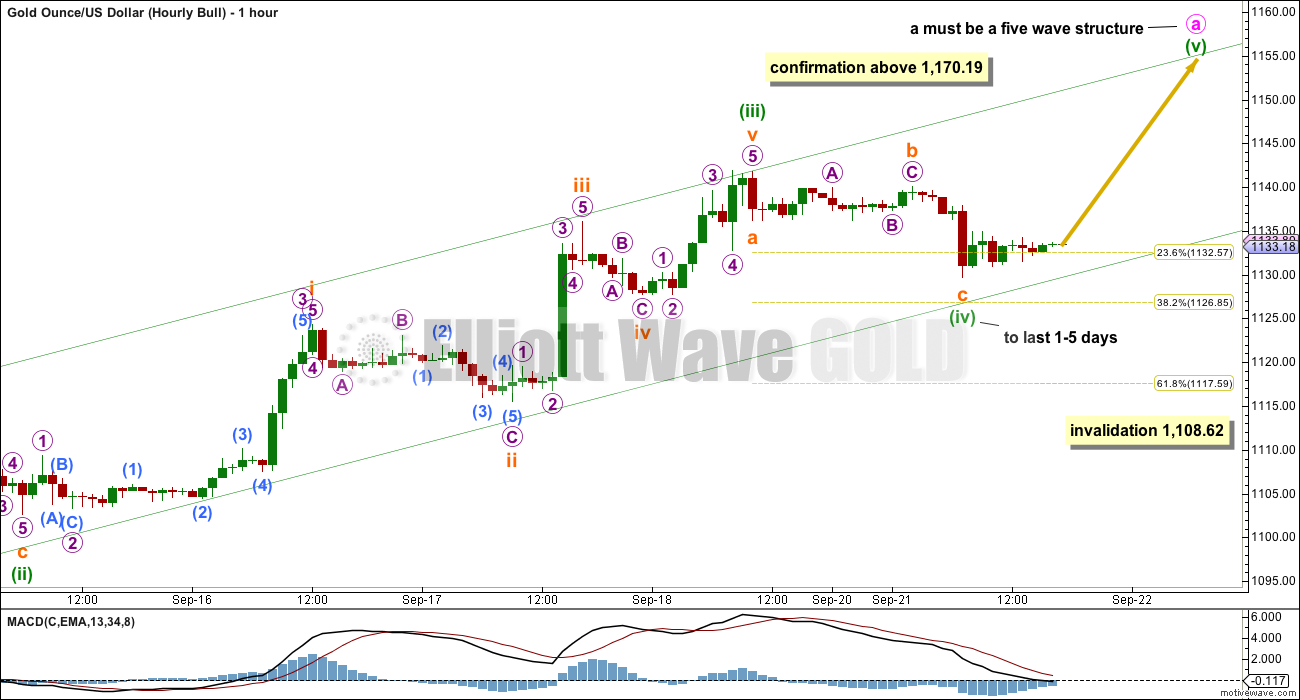
Minuette wave (ii) shows up on the daily chart and lasted two days. Minuette wave (iv) is most likely to also show up on the daily chart, for the five wave impulse of minute wave a to have the right look on the daily chart, and it may last 1-5 days.
Minuette wave (ii) is seen as an expanded flat for this bull wave count.
The channel drawn here is a best fit. If minuette wave (iv) continues, then it may end if price touches the lower edge of the channel.
Minuette wave (ii) was a deep time consuming flat correction. Minuette wave (iv) may be a quicker zigzag, so it may last only one day. At this stage, minuette wave (iv) may be over in one day as a zigzag.
Alternatively, minuette wave (iv) may also be a combination or triangle; both would provide structural alternation with the flat correction of minuette wave (ii). Combinations and triangles tend to be very time consuming structures, so minuette wave (iv) may last up to five days. Minuette wave (iv) may be expected to be shallow, with the 0.382 Fibonacci ratio the most likely target.
The degree of labelling within minuette wave (iv) may be moved down one degree; the zigzag down may be subminuette wave a of a triangle or subminuette wave w of a combination.
If minuette wave (iv) is a running triangle or combination, then it may include a new price extreme beyond its start above 1,141.83.
Minuette wave (iv) may not move into minuettte wave (i) price territory below 1,108.62.
TECHNICAL ANALYSIS
Click chart to enlarge. Chart courtesy of StockCharts.com.
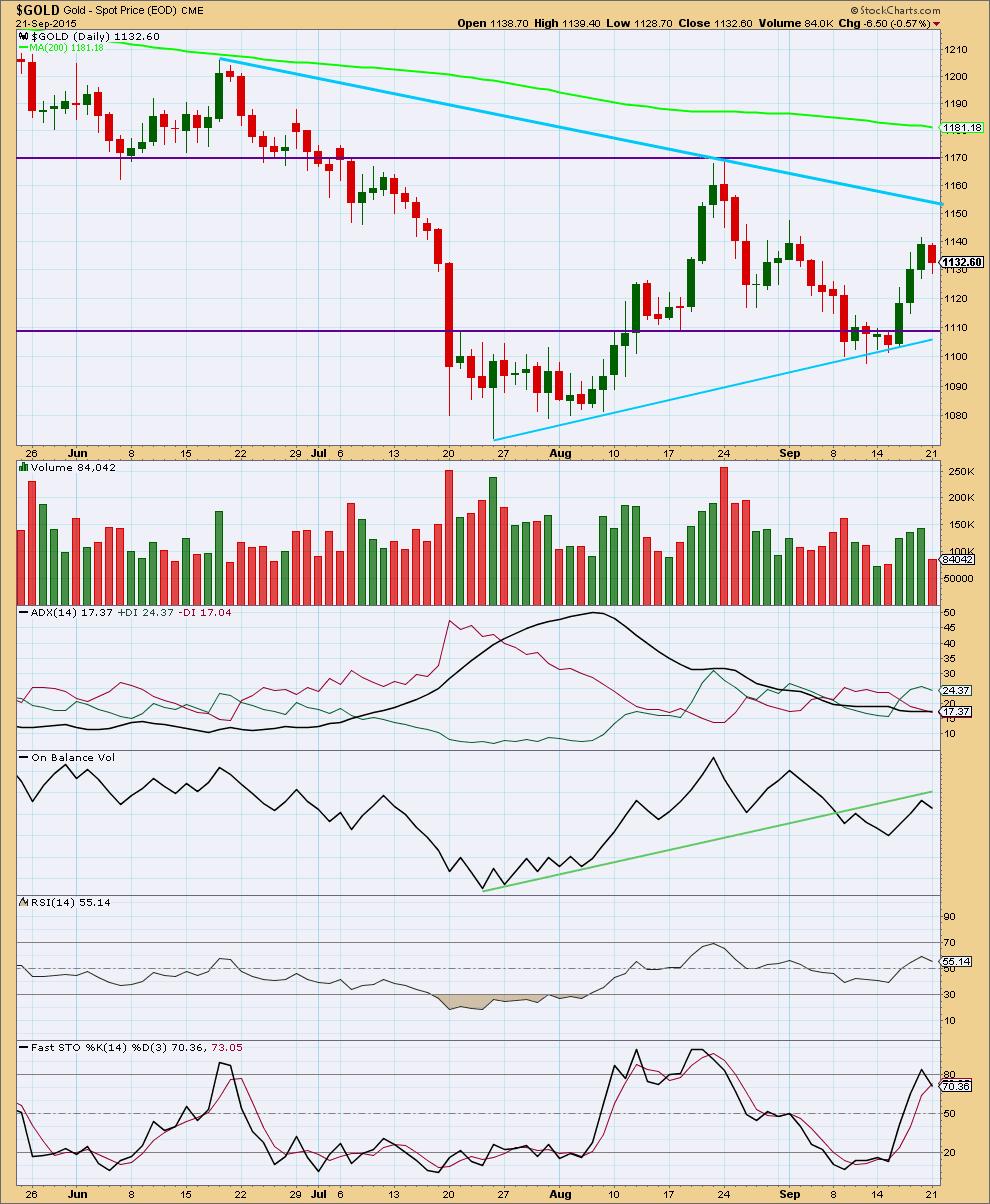
Daily: A small downwards movement for Monday on lighter volume looks corrective and indicates more upwards movement is likely for the short term. However, this is not definitive, sometimes the start of a new downwards trend for gold begins slowly on light volume as it did on 19th June.
In the last 20 days, it is four downwards days which have strongest volume and this may indicate a downwards trend is still intact. The volume profile is giving mixed signals.
What does remain clear today is the advancing three white soldiers candlestick pattern. As this is now followed by a small red candlestick on light volume, it does indicate more upwards movement in the short term is most likely. That would favour the bull wave count.
Overall, from the last swing high at 1,170 on 24th August, as price falls it comes on declining volume. There is some small support for the fall in price: each wave down has increasing volume, but the whole movement from its start has overall declining volume. The picture remains unclear.
ADX is flat indicating there is no clear trend and the market is range bound. If a range bound system is used here, then it would expect an upwards swing to continue because price has reached to the lower horizontal line of support and Stochastics has reached oversold. However, trading a range bound market is more risky than trading a clearly trending market. The final swing never comes; that is when price breaks out of the range and begins a trend. An upwards swing may still possibly be continuing at this stage and would be expected to only end when price reaches resistance and Stochastics is overbought at the same time. While the Elliott wave bear count remains valid the risk that a bear market may still be intact must be acknowledged. Good money management on any bullish trades is essential.
On Balance Volume has found resistance at the green trend line and moved lower from there. The strength of that line is reinforced. OBV may yet move up again to touch the line; this would allow for more upwards movement which the bull wave count expects. Equally as likely OBV may continue lower from here as the bear wave count expects.
RSI at the daily chart level is neither overbought or oversold. There is room for the market to rise or fall.
Overall the regular technical analysis picture remains unclear.
This analysis is published about 07:57 p.m. EST.

Here’s something interesting, miners falling faster than US blue chips
As Matt says there may be a diagonal forming to the downside.
I’d prefer though to see a series of first and second waves complete. It’s a more common scenario, expanding leading diagonals aren’t very common.
However, both scenarios may fit. I need to spend some time this morning on the 5 min chart to see if those downwards waves are threes or fives.
A new low below 1,127.70 confirms micro 5 is over, and subminuette (ii) must be over for the bear.
For the bull this downwards movement would be minuette (iv). It can’t move into minuette (i) territory below 1,108.62.
A new low below 1,108.62 would be quite bearish at this stage.
Lara: Did you mean submin wave i above?
“subminuette (ii) must be over for the bear.”
Next to micro wave 5 is submin wave i is labeled on bear hour chart.
Now a corrective wave up to expect to target 1135?????
Good question.
Lara September 22, 2015 at 5:00 am commented below
…“hourly bear II” …It’s been invalidated by upwards movement into micro wave 1 price territory. (Above 1,136.18)
IMHO Gold price probably hammered in an interim top today at the 1135-36 high and currently bouncing off 20dma not likely seen to get past 1131-35 for an eventual break below 1103…. (subject to break below 20dma/50dma which I guess is on the way lol)….
See my comments below about the diagonal. I believe that once it completes with a tad more downward movement, and then bounces up for a 2nd wave correction, it should not get past the 1131-35 zone which you mention.
Actually, I should probably reevaluate the extent of any coming bounce. I completely neglected the fact that diagonals are typically followed by very deep 2nd wave corrections (often beyond 0.618). So, depending on how far down gold drops today, there is a chance that it could get above 1135 when it corrects. If that happens though, it won’t be by much.
Hi Matt: I really wouldn’t know how the wave counts work but, Gold price just about fell through 50% of H 1169 / L 1073 with the downside appears to be holding just above 10dma/50dma (1119-1117)…. On the upside, with hourly RSI tagging below 30 would likely prop Gold price up but there is strong resistance at 1130-33 a retracement zone. I doubt if Gold price will get much above there…. Going to have to wait and see how this pans out. Subsequent analysis by Lara will probably give us the needed guidance… Thanks. Have a profitable trade!
The 1130-33 resistance area is a fine target for upward movement to end. I would consider 1133 to be deep enough to qualify here.
By the way, good call on the gold top.
I’m going to take that a step further and say that a short term bottom is now in. The bounce up, for a 2nd wave correction, is underway.
Matt: Well, if Gold price can break above 1141-42 with 1155-56 on the outside before it does break below 1105-03 then probably a short term bottom is in at 1098-97… Gold price is short term bullish but is it bullish enough to take out 1141-42 and the upper band? Lets see. 🙂
on the bounce up, are we expecting 1 day? or more like 5 days? to me it may only last 1 day, anyone have any thoughts.
Joseph: I couldn’t respond directly to you, but my best guess is about 1 day.
Gold may have completed an A wave up already. Next would be a B wave, perhaps to the 1122-24 area, and then a final C wave up (which typically are the longest of the three corrective waves). At the earliest, the correction may end during the Asian trading session in about 12 hours from now. Although I am inclined to think that it could occur during the end of European/ start of U.S. hours (for example, when ECB president Draghi speaks at 9am EST).
Again, this is just an educated guess.
By short term, I meant that the low of the day is in. I doubt that gold will see 1141, but I have been wrong before. 🙂
It seems that both hourly counts need to be reworked.
At this point in time, I am inclined to go with an expanding diagonal forming for the hourly bear. However, it is not valid yet unless the 5th wave continues lower. As it stands, the 5th wave is shorter than the 3rd.
Anyone see any other options?
Gold would need to move at least slightly below 1126 now for the diagonal to work.
BINGO! Now expect a 2nd wave correction soon to take gold back into the 1130s for a last chance to go short.
Lara.
“Micro wave 4 may not move into micro wave 1 price territory above 1,136.18.”
Price moved up to 1136.69 about an hour ago.
Does it mean that some modification to the bear wave count is in order? Or is the movement strongly favouring the bull count?
It could be that micro 3 was not over yet.
For the bear wave count I would now see a less favoured 1-2, 1-2 to the downside.
This upwards movement does make the prior downwards move look very much like a completed three. That does favour the bull wave count. But it’s only short term, there are still options open for the bear which haven’t been invalidated.
Thanks. It makes sense.
Lara: The current bear wave count invalidation is at 1141.83. So it is not invalidated yet??????
No. I think the market is answering. Price keeps going down today.
Friday before close I got a Buy for DUST at the 195 minute time frame, which I bought at 3:59 pm Friday at $22.70 and sold it today Monday at 9:31 am at $23.90 so made 5% in 2 market minutes. I missed some DUST intraday trading. Looking to catch more Tuesday.
Just curious what indicator/s R U using that gives buy signal/s ???
I am using TSI (7.4.7) , ADX and MACD (5,35,5) in all time frames.
Thanks in advance for sharing.
LBR_ThreeTenOscillator
Can check various time frames for different crossover signals.
Lara,
Are the hourly charts applicable to both bull and bear counts? I noticed that the hourly bear chart is labeled “hourly bear ii.” Did you intend to add another hourly bear chart? Am ultimately just wondering if gold may make a new high to complete a 5th wave under the daily bear. Thanks.
Hi Matt, are you thinking that the recent high at 1141 on the 18th is only wave 3 up from the low 1098 on the 11th?
Yes, it is a possibility.
Wave (5) at 1155 is 61.8 of (3) if (4) is over. Do you have a bearish label for that?
Not sure what you mean, but it would be the final 5th wave to complete C.
Ok I see where you are now
It’s labelled “hourly bear II” only because it’s not the first idea I came up with, but it’s the only bear wave count I have at this time at the hourly chart level.
It’s been invalidated by upwards movement into micro wave 1 price territory.
When this analysis was published I had no intention to add another hourly count for the bear. If it makes a new high then I’ll consider a double zigzag or subminuette wave c extending higher.