
Elliott wave and traditional technical analysis of NZDUSD.
ELLIOTT WAVE COUNT
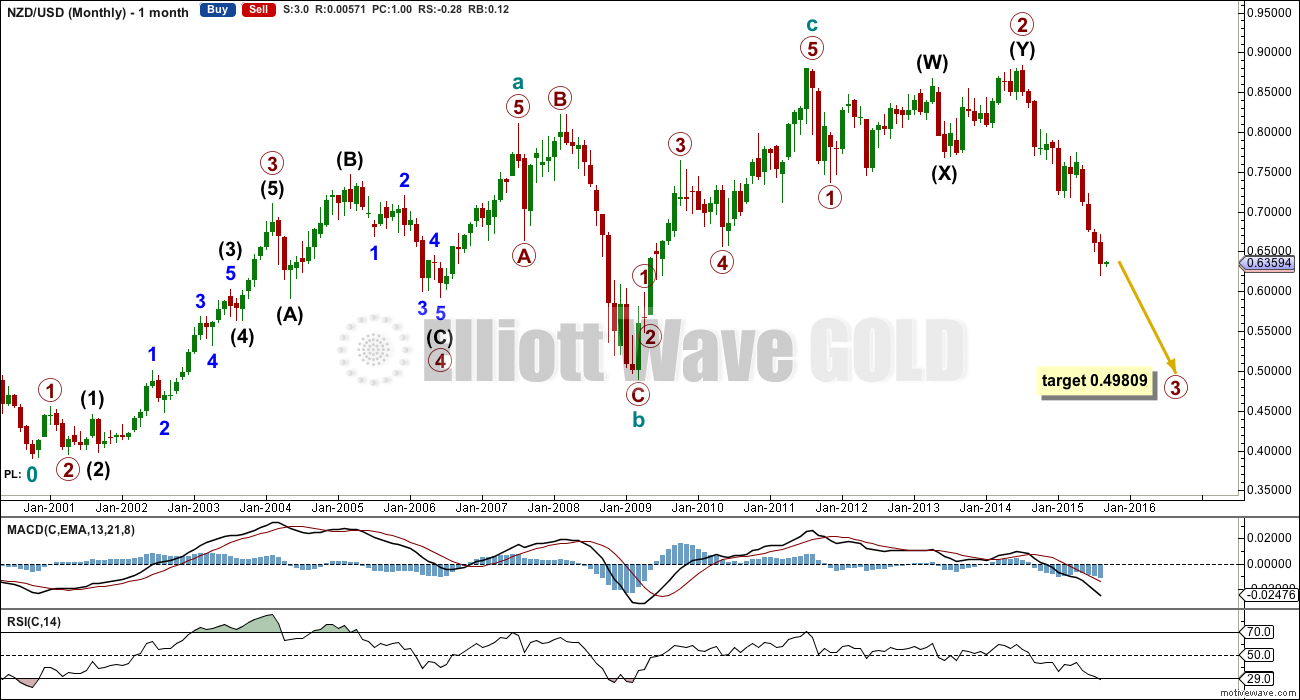
Primary 3 should end when RSI indicates oversold and most likely not before. My concern for any sell on NZDUSD at this time is RSI is indicating slightly oversold. This needs to be resolved before I’m prepared to enter another short.
Primary 3 would reach 2.618 the length of primary 1 at 0.49809. The structure of primary 3 is incomplete.
I think the middle of primary 3 has passed. I expect to see a slowing of momentum. However, sometimes NZDUSD exhibits strong fifth waves (maybe due to the high reliance on Dairy as a commodity for the economy?). Because of this tendency and because there is more downwards movement ahead I’d like to find another entry point for another trade.
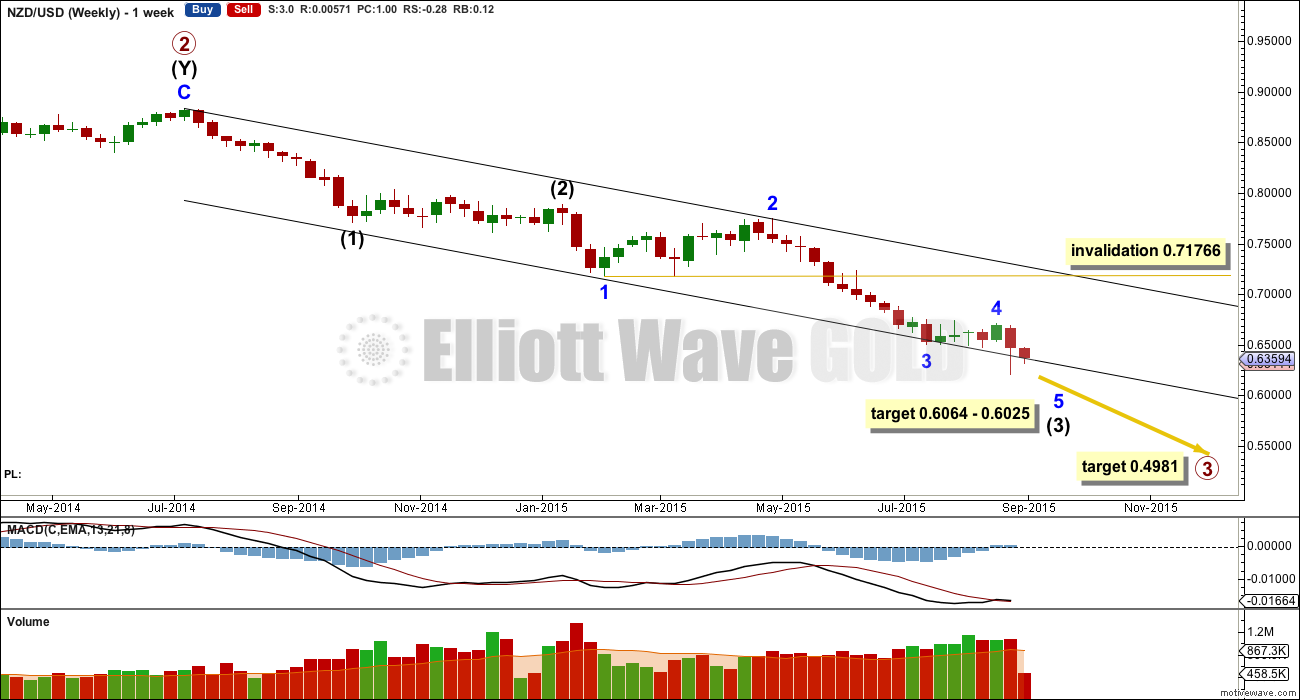
At 0.6064 intermediate (3) would reach 1.618 the length of intermediate (1). At 0.6025 minor 5 would reach equality in length with minor 1.
What seems clear at the monthly and weekly chart levels is primary 3 is incomplete.
Price is falling on increased volume. Minor 5 may have begun.
Minor 3 is 92 pips longer than 1.618 the length of minor 1. This is a big difference, but at 7.7% the length of minor 3 it is an acceptable variation.
Minor 2 was a deep 0.8 double zigzag and minor 4 was a very shallow 0.17 flat. There is perfect alternation and reasonable proportion, particularly for NZDUSD which doesn’t always have nice proportions.
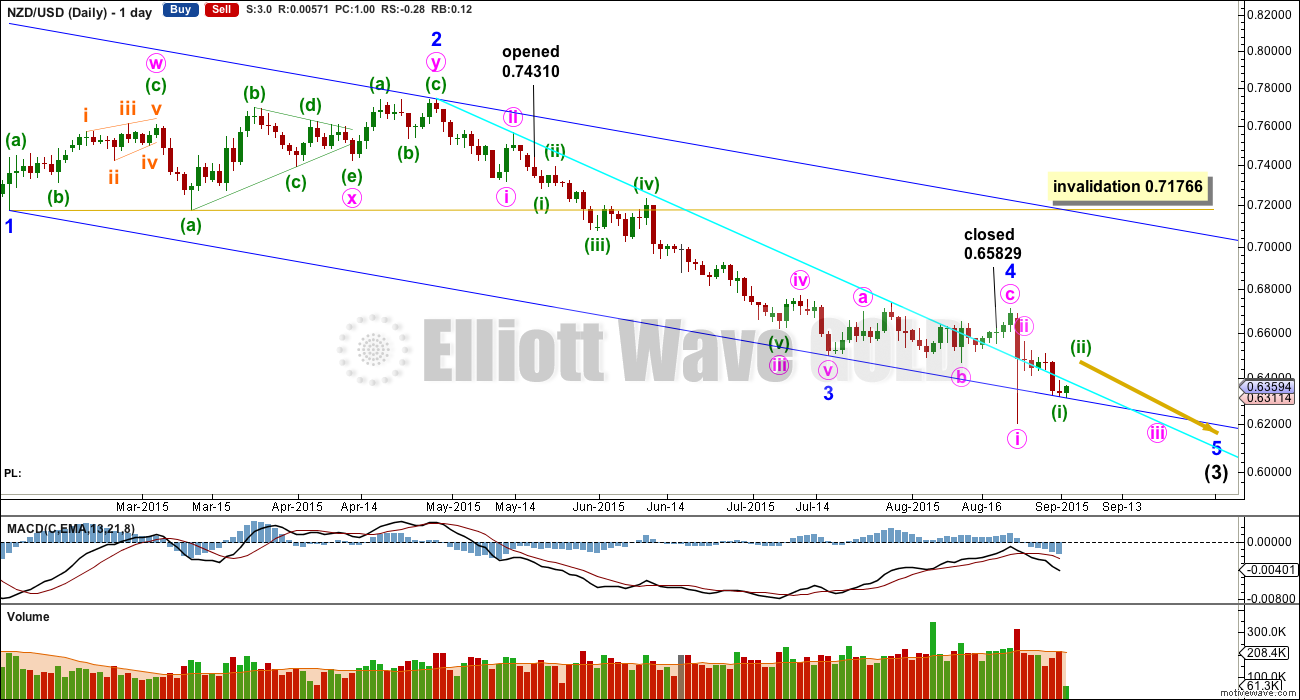
The risk is minor 4 may not be over. It may not move into minor 1 price territory above 0.71766. This is way too far away to set a stop. In this next trade I may use the hourly chart to set a stop, and there I prefer a trend line rather than an Elliott wave invalidation point only because it’s usually less risk.
My last trade was exited when the bright aqua blue trend line was breached. That was my exit strategy and it was strictly adhered to.
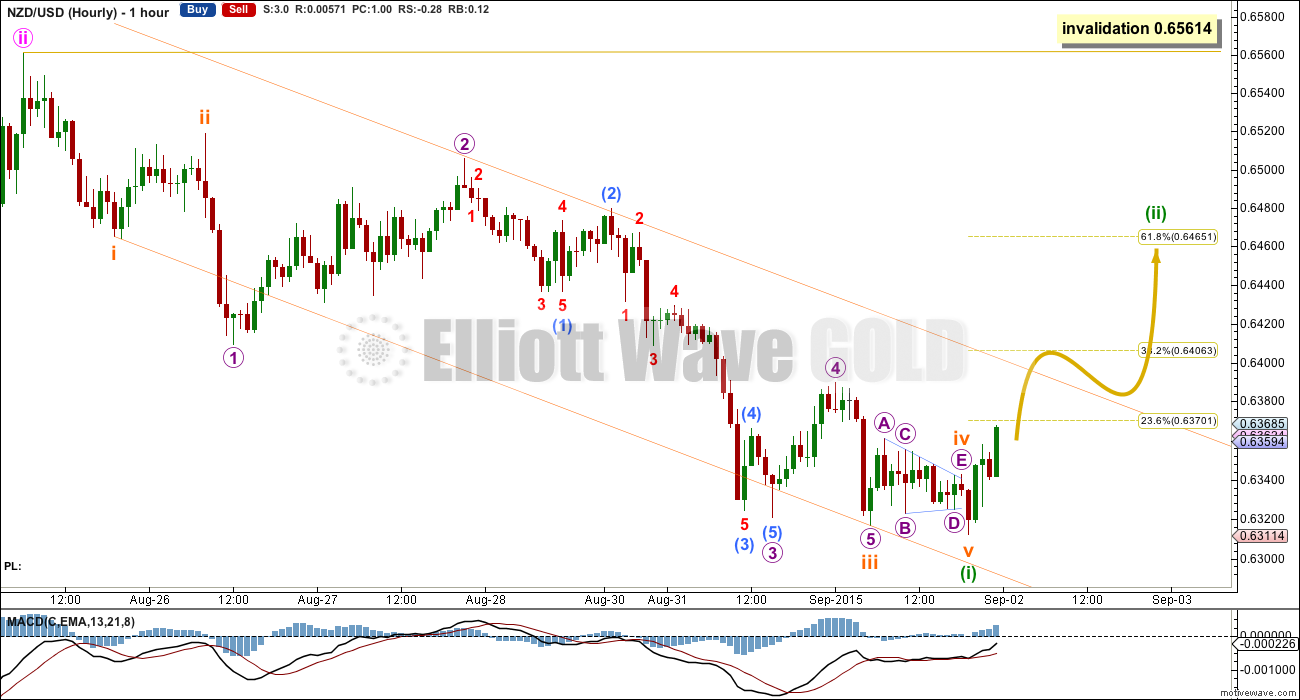
Minute ii was very deep. Minuette wave (ii) may end about the 0.618 Fibonacci ratio.
I will wait to see a complete corrective structure upwards before looking for an entry.
If this wave count is correct, then NZDUSD should move higher for a few days in another second wave correction. Once there is some structure within minuette wave (ii) I will draw a channel about it. I will wait for the channel to be breached and then wait for a throwback to the channel.
If at that time RSI oversold at the monthly chart level is resolved, then I may decide to enter another short. If RSI remains oversold I may wait, or I may reduce my position size to reduce risk.
TECHNICAL ANALYSIS
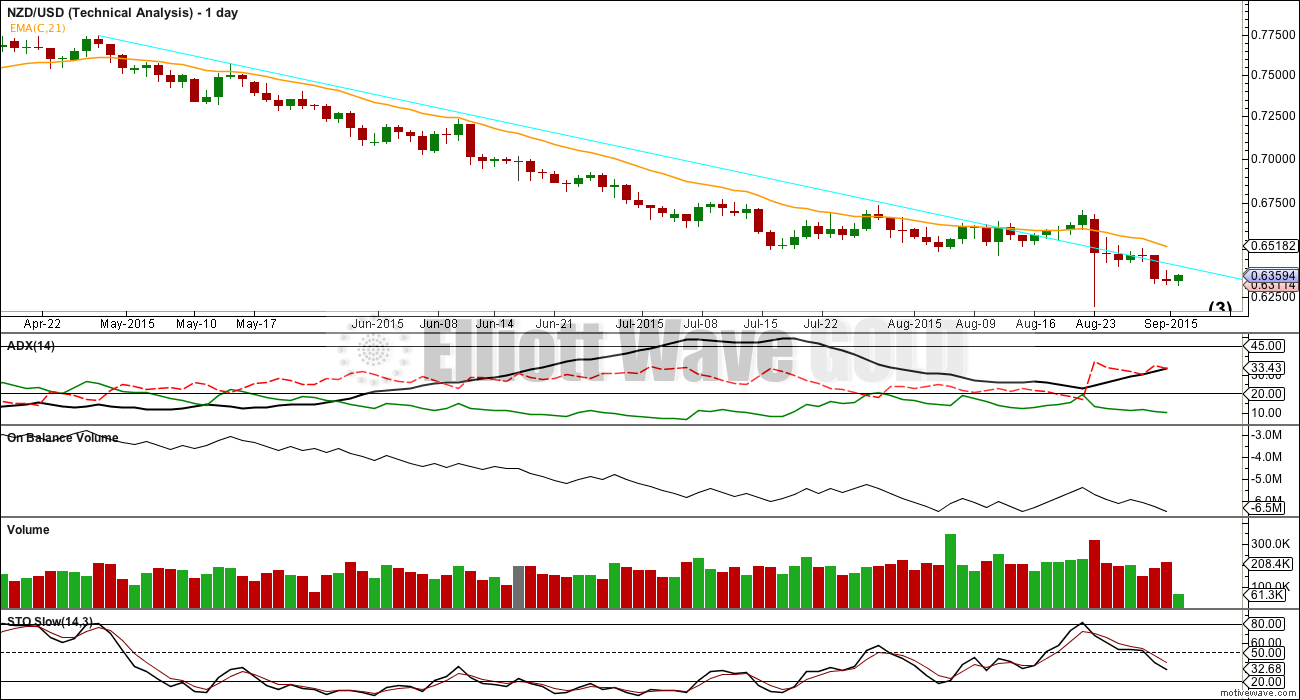
ADX is indicating the resumption of a downwards trend, but this may be skewed by the price shock of 24th August. It would be wise to wait another 8 days until that data falls off ADX before taking ADX as a reliable indicator at this time.
Volume and On Balance volume both support the fall in price over the last seven days. Price remains below the 21 day Exponential Moving Average. The Elliott wave structure is incomplete.
I expect NZDUSD to keep falling, but short term it may move higher in a correction against the trend to resolve RSI overbought at the monthly chart level.