
Silver has been in a bear market since April 2011.
There is not enough technical confirmation of a change from bear to bull. For this reason I favour the third wave count which is bearish. But the first two wave counts are entirely possible. Price will tell us which one is correct.
Changes to last week’s analysis are bold.
WAVE COUNT #1
Click chart to enlarge.
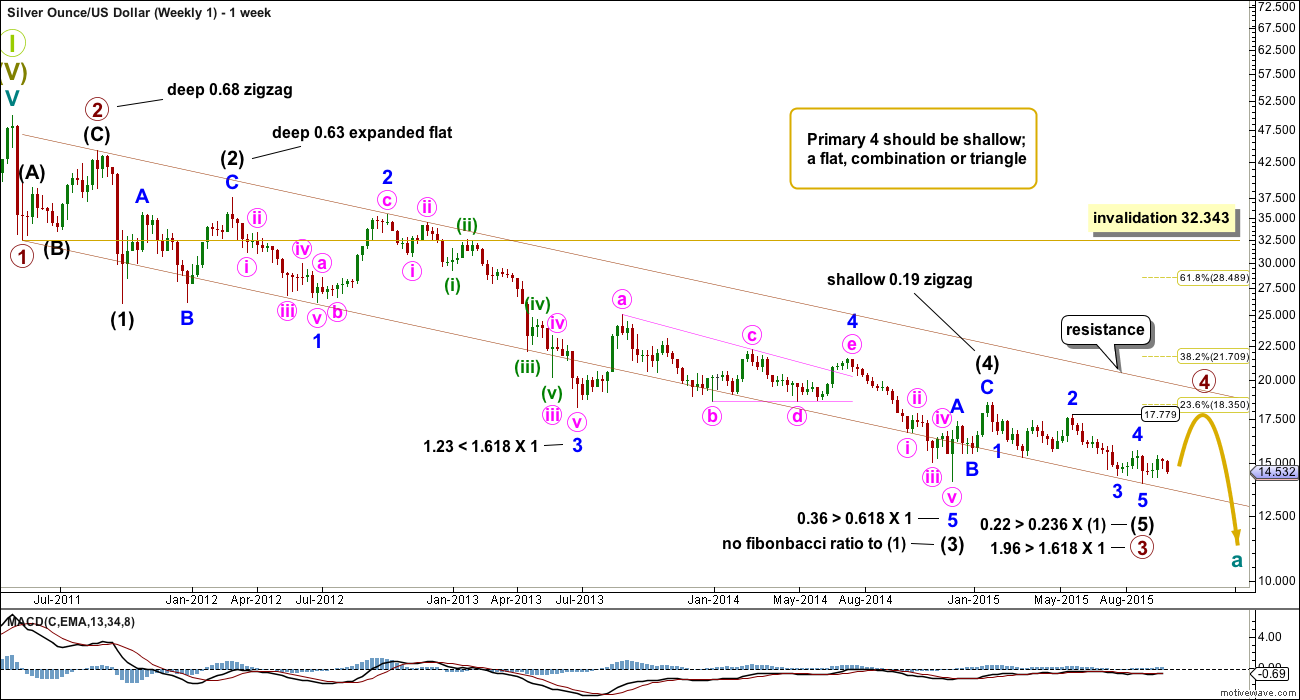
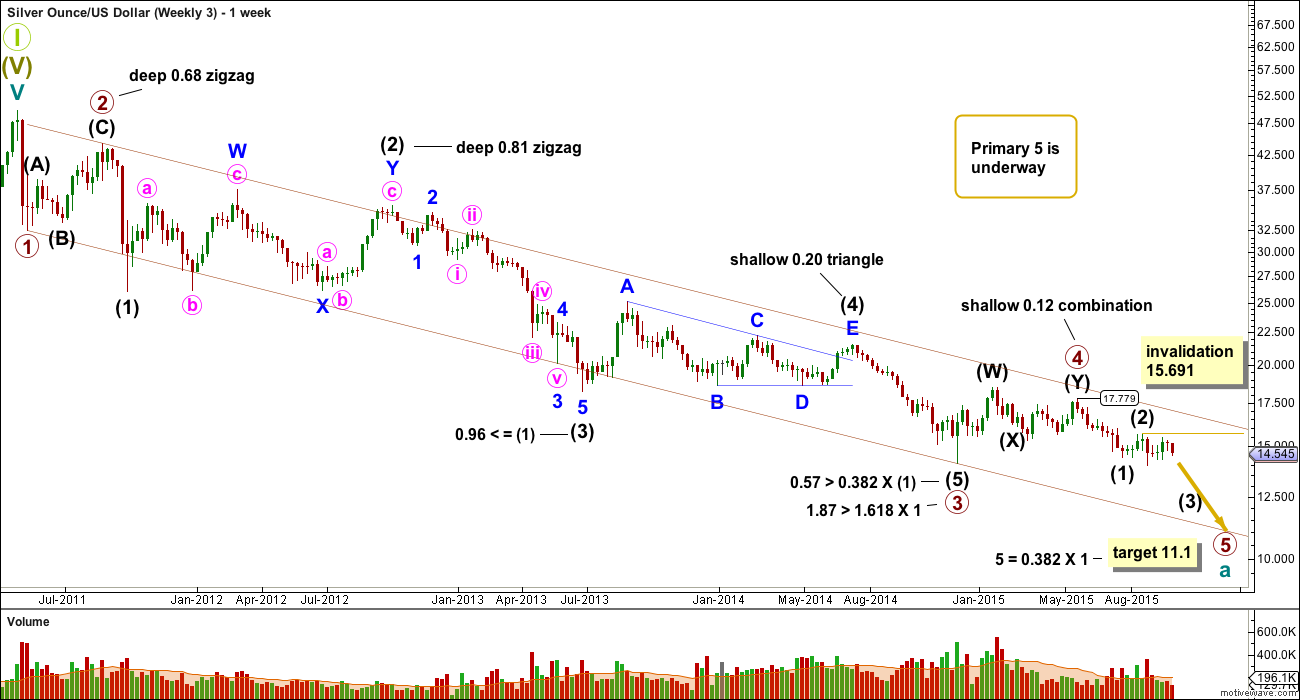
This first wave count sees a 5-3-5 complete downwards for primary waves 1, 2 and 3.
The channel (maroon) drawn about this downwards movement is drawn using Elliott’s first technique. Draw the first trend line from the lows labelled primary waves 1 to 3, then place a parallel copy on the high of primary wave 2. Primary wave 4 may find resistance at the upper edge of the channel.
Primary wave 2 was a deep single zigzag. Given the guideline of alternation expect primary wave 4 to be shallow and a flat, combination or triangle.
The difficulty with this wave count comes with the multiple structural possibilities for primary wave 4. It is impossible to tell which structure will unfold, only that it is most unlikely to be a zigzag or zigzag multiple. If it is an expanded flat, running triangle or combination, it may include a new price extreme beyond its start, so it may include a new low below 13.983.
Intermediate wave (1) lasted a Fibonacci 5 weeks; intermediate wave (2) was 22 weeks, just one more than a Fibonacci 21; intermediate wave (3) was exactly a Fibonacci 144 weeks; and, intermediate wave (5) was 31 weeks, three short of Fibonacci 34.
Primary wave 2 lasted 15 weeks. Primary wave 4 is expected to be longer lasting because zigzags are quicker than combinations, triangles and even flats. Primary wave 4 may total a Fibonacci 21 or 34 weeks, give or take up to three weeks either side of these expectations.
Primary wave 4 may not move into primary wave 1 price territory above 32.343.
Click chart to enlarge.
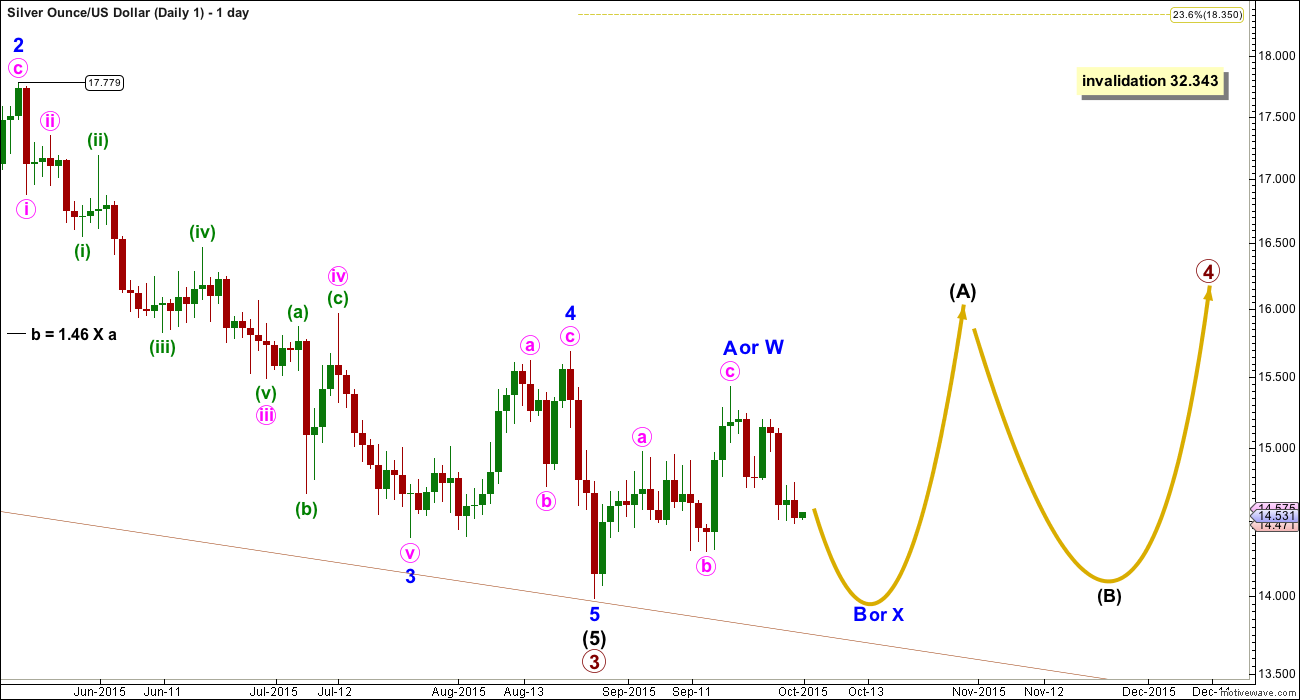
All wave counts will show daily charts from the price point marked at 17.779 was 18th May, 2015.
Primary wave 4 is most likely to be a flat, combination or triangle. For all of these structures the first wave up should be a three at intermediate degree.
The first movement up now looks like a complete three. This may be a zigzag for minor wave A within a larger flat correction for intermediate wave (A), or it may be the first zigzag in a multiple zigzag for intermediate wave (A).
If intermediate wave (A) is a flat correction, then within it minor wave B must retrace a minimum 0.9 length of minor wave A. This would be achieved at 14.128.
If intermediate wave (A) is a double or triple zigzag, or a combination, then there is no minimum requirement for minor wave X within it. It only needs to be a corrective structure.
Minor wave B of an expanded flat correction may make a new low below the start of minor wave A at 13.983. Minor wave X of a combination also may make a new low below the start of minor wave W at 13.983.
When intermediate wave (A) is a complete three wave structure then intermediate wave (B) should unfold downwards and may again make a new low below the start of intermediate wave (A) at 13.983, but it does not have to.
There are 23 possible corrective structures for primary wave 4. At this stage, it is impossible to tell which one will unfold, only that it would be unlikely to be a zigzag.
WAVE COUNT #2
Click chart to enlarge.
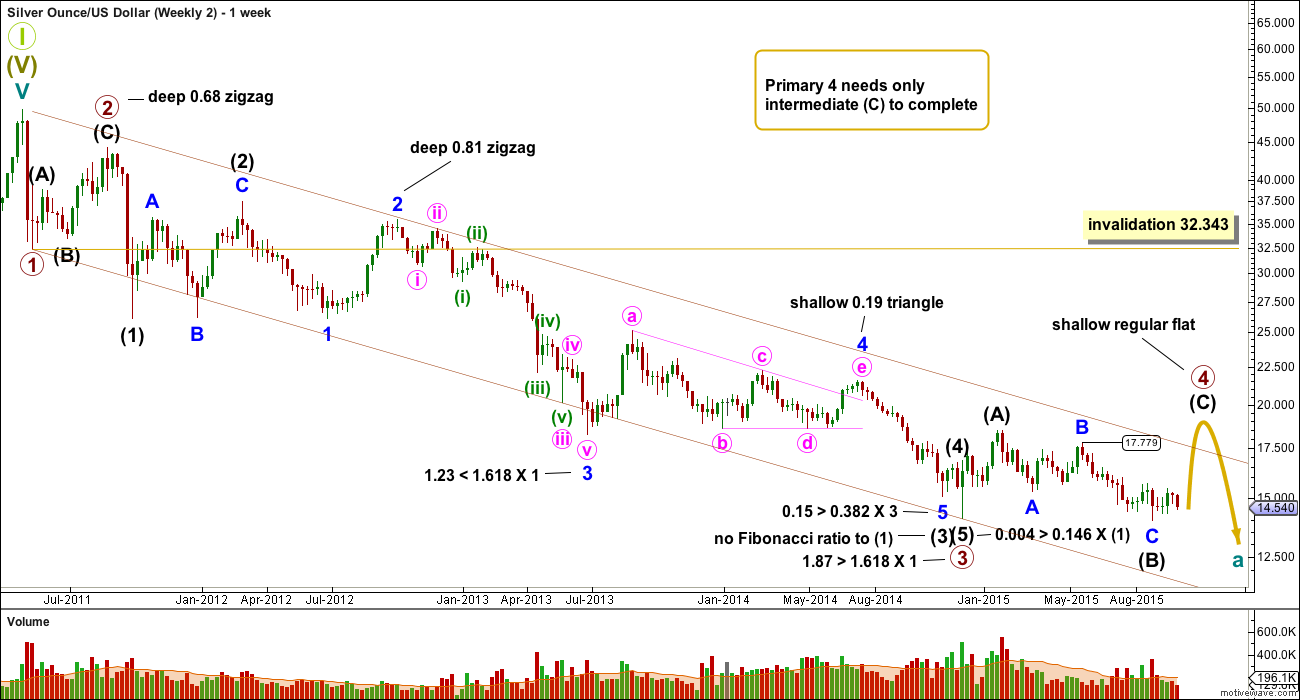
Primary wave 4 may already be underway. Primary wave 3 still has a close Fibonacci ratio to primary wave 1. This wave count and the first wave count both have similar Fibonacci ratios, so there is no advantage nor disadvantage between them in this regard.
Within primary wave 3, intermediate wave (1) lasted a Fibonacci 5 weeks; intermediate wave (2) lasted 22 weeks, one longer than a Fibonacci 21; intermediate wave (3) lasted 40 weeks with no Fibonacci duration; intermediate wave (4) lasted a Fibonacci two weeks; and, intermediate wave (5) lasted a Fibonacci one week.
Primary wave 4 may be over halfway complete as a regular flat correction. Within the flat correction, intermediate waves (A) and (B) both subdivide as three wave structures and intermediate wave (C) is incomplete.
The channel here is a little different, a best fit, so not drawn using Elliott’s technique.
Click chart to enlarge.
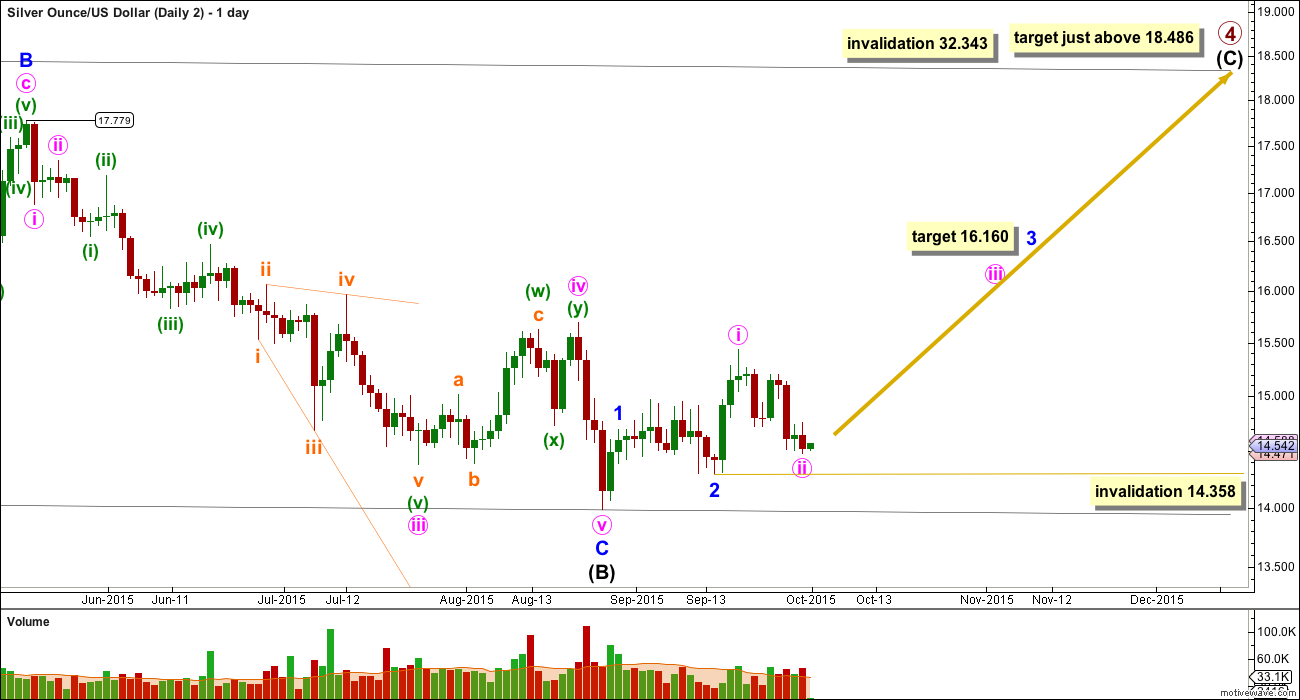
Intermediate wave (C) must be a five wave structure. So far minor waves 1 and 2 may be complete. Minor wave 3 would most likely be incomplete.
At 16.160 minor wave 3 would reach 2.618 the length of minor wave 1. Minor wave 5 may also be extended to end intermediate wave (C).
Intermediate wave (C) is highly likely to move at least slightly above the end of intermediate wave (A) at 18.486 to avoid a truncation. Regular flats normally have a sideways look; the C wave is normally close to equality in length to the A wave. Intermediate wave (C) would be likely to end just above 18.486 to achieve a sideways look.
Minor wave 3 should show its subdivisions clearly on the daily chart, and downwards movement within the last week gives minor wave 3 so far the “right look”.
Minute wave ii may not move beyond the start of minute wave i below 14.358.
If price moves below 14.358 to invalidate this wave count, then the only possibility for intermediate wave (C) would be an ending diagonal. This is unlikely because the diagonal would have to be expanding to reach the final target for intermediate wave (C) at 18.486. While ending diagonals are somewhat common they are normally contracting, not expanding.
The final invalidation point for that idea is at 13.983.
WAVE COUNT #3
Click chart to enlarge.
Primary wave 4 may be complete and primary wave 5 may be underway.
Primary waves 2 and 4 exhibit perfect alternation and good proportion: primary wave 2 was a deep zigzag lasting 15 weeks and primary wave 4 was a shallow combination lasting 24 weeks, 1.618 the duration of primary wave 2.
At 11.1 primary wave 5 would reach 0.382 the length of primary wave 1.
Within intermediate wave (3), which is currently underway, no second wave correction may move beyond its start above 15.691.
Although this wave count is labelled #3 it is my preferred wave count. I am presenting them in the order in which I developed each, not in order of preference. This wave count is preferred primarily for the reason that there has been no technical confirmation of a trend change from bear to bull for Silver.
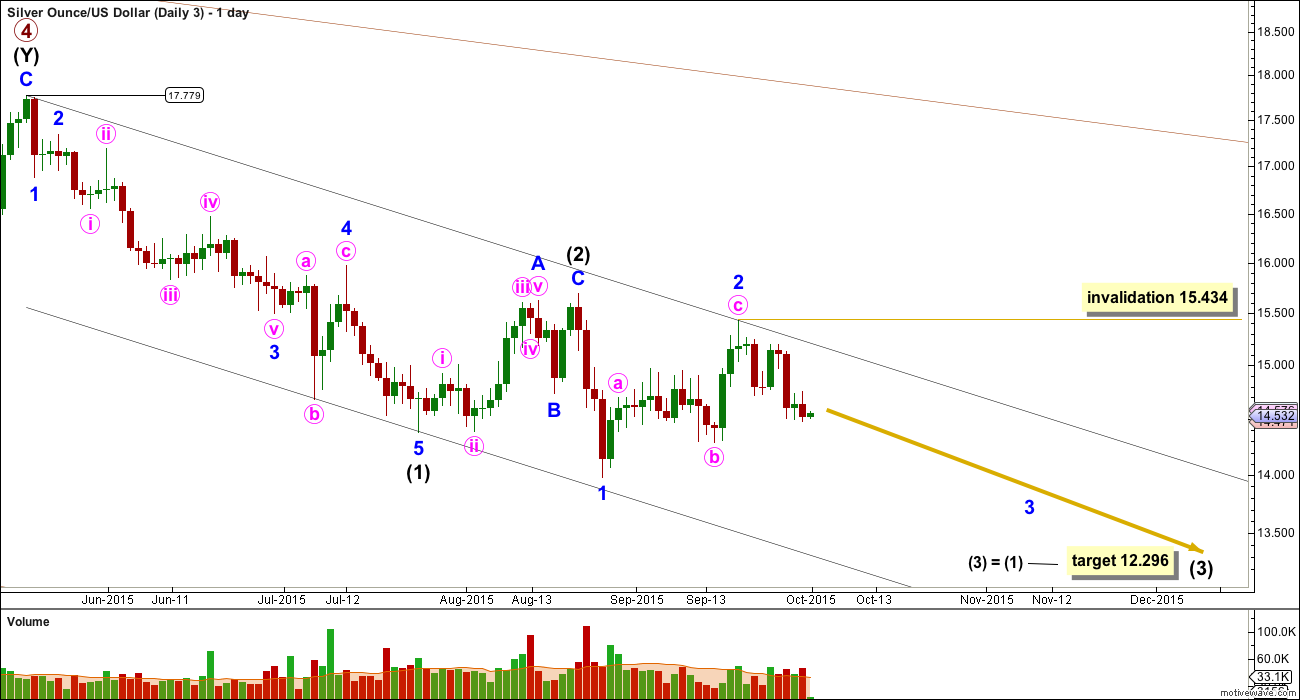
Click chart to enlarge.
There may be two overlapping first and second waves within primary wave 5: intermediate waves (1) and (2) and minor waves 1 and 2. Minor wave 2 may not move beyond the start of minor wave 1 above 15.691.
At 12.296 intermediate wave (3) would reach equality in length with intermediate wave (1).
This wave count now expects to see an increase in downwards momentum over the next month. Strongest momentum may come for minute wave v of minor wave 3, which is typical of commodities.
Within minor wave 3, no second wave correction may move beyond its start above 15.434.
I have drawn a best fit channel about this downwards movement. I would expect minor wave 3 to have the power to break through support at the lower edge of this channel. Along the way down, upwards corrections may continue to find resistance at the upper edge of this channel.
TECHNICAL ANALYSIS
Click chart to enlarge. Chart courtesy of StockCharts.com.
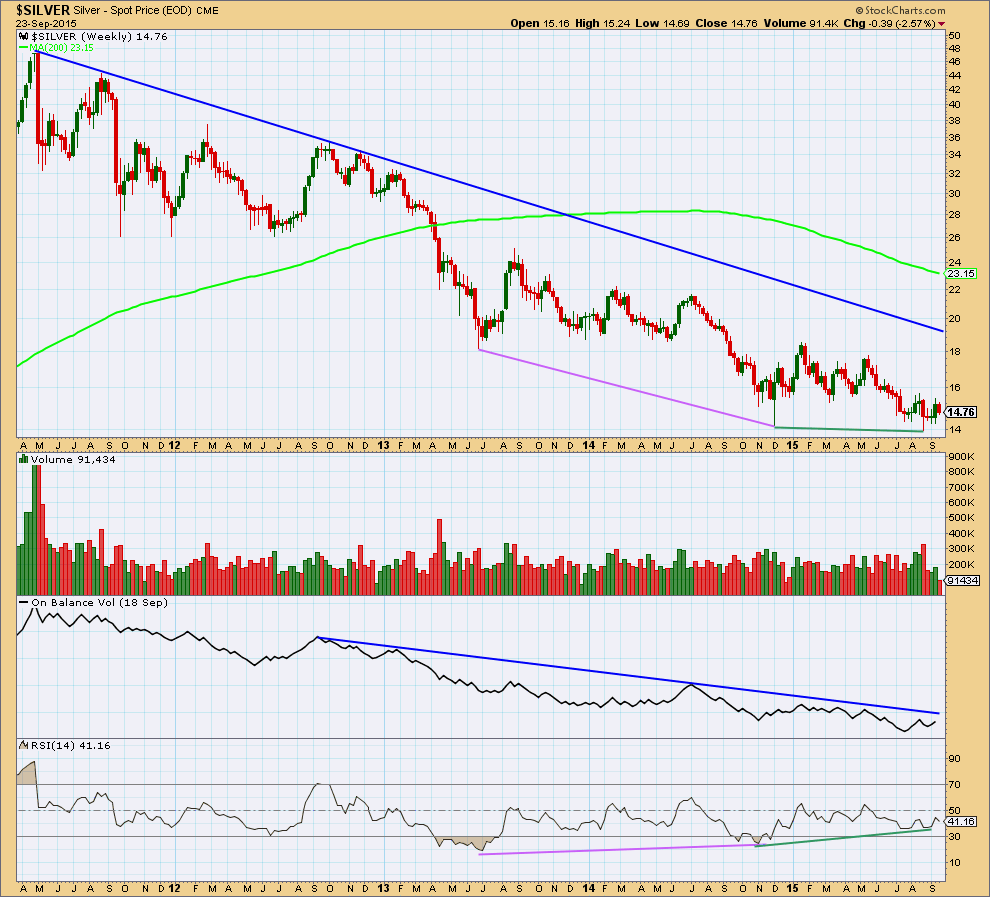
Weekly: Silver has been in a bear market since April 2011. While price remains below the 200 day Simple Moving Average and below the dark blue bear market trend line the bear market should be expected to remain intact. For this reason I favour the third Elliott wave count.
Overall, while Silver has been in a bear market, volume is declining which indicates the bear trend is maturing, a change to a bull market is closer. Volume will not tell us exactly when that change comes though. It is a warning sign only.
Of recent weeks, strongest volume is for a downwards week. This is bearish.
On Balance Volume remains below a long held trend line. This trend line is somewhat shallow, repeatedly tested, and reasonably technically significant. While OBV remains below that trend line it will remain bearish.
RSI shows strong double divergence with price over a long time period (pink and green lines on price and RSI). While price made new lows RSI failed to make new lows. This indicates weakness in downwards movement and is bullish. Because this divergence is double and over such a long time period it is highly technically significant. This indicator is often leading (anticipates a trend change). The first two bull wave counts must be seriously considered for this reason.
The regular technical analysis picture is unclear at the weekly chart level. A trend change will come and RSI is indicating it may come sooner or have arrived already. It needs to be confirmed by price, and a break above the blue bear market trend line would be confirmation of a trend change.
Click chart to enlarge. Chart courtesy of StockCharts.com.
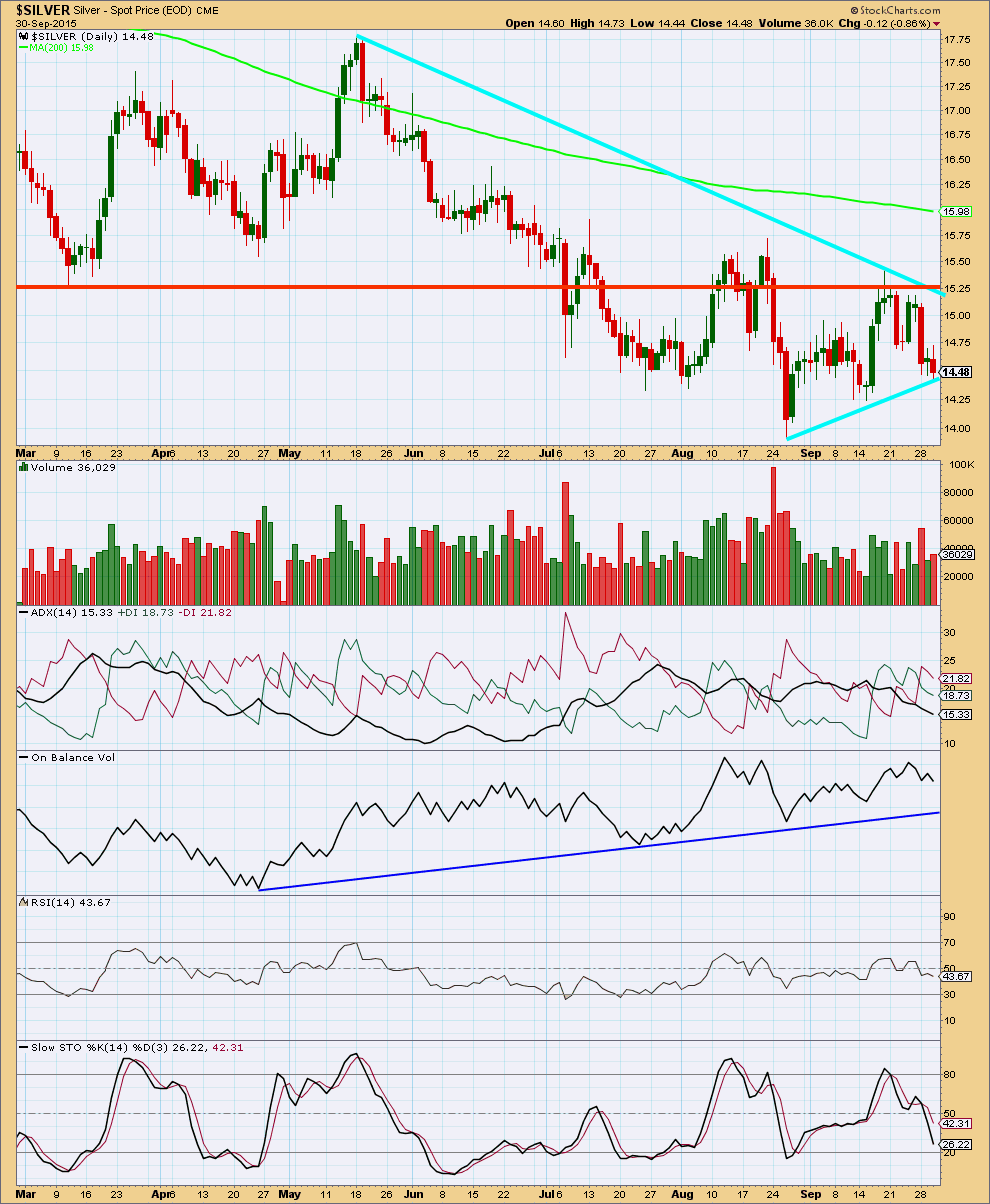
Daily: Silver has overall been consolidating since about 3rd August. During this time, it is four downwards days which have strongest volume which indicate a downwards breakout is more likely than upwards.
Price is being squeezed between the two sloping bright aqua blue lines providing some support and resistance. The consolidation is maturing. The breakout is closer.
ADX is currently indicating there is no clear trend, the black ADX line is pointing down. The market is range bound. But ADX does tend to be a lagging indicator.
On Balance Volume is finding support at a short held upwards sloping trend line.
RSI indicates neither overbought nor oversold. There is room for price to rise or fall.
Like wise, Stochastics is neither overbought nor oversold.
This analysis is published about 10:03 p.m. EST.