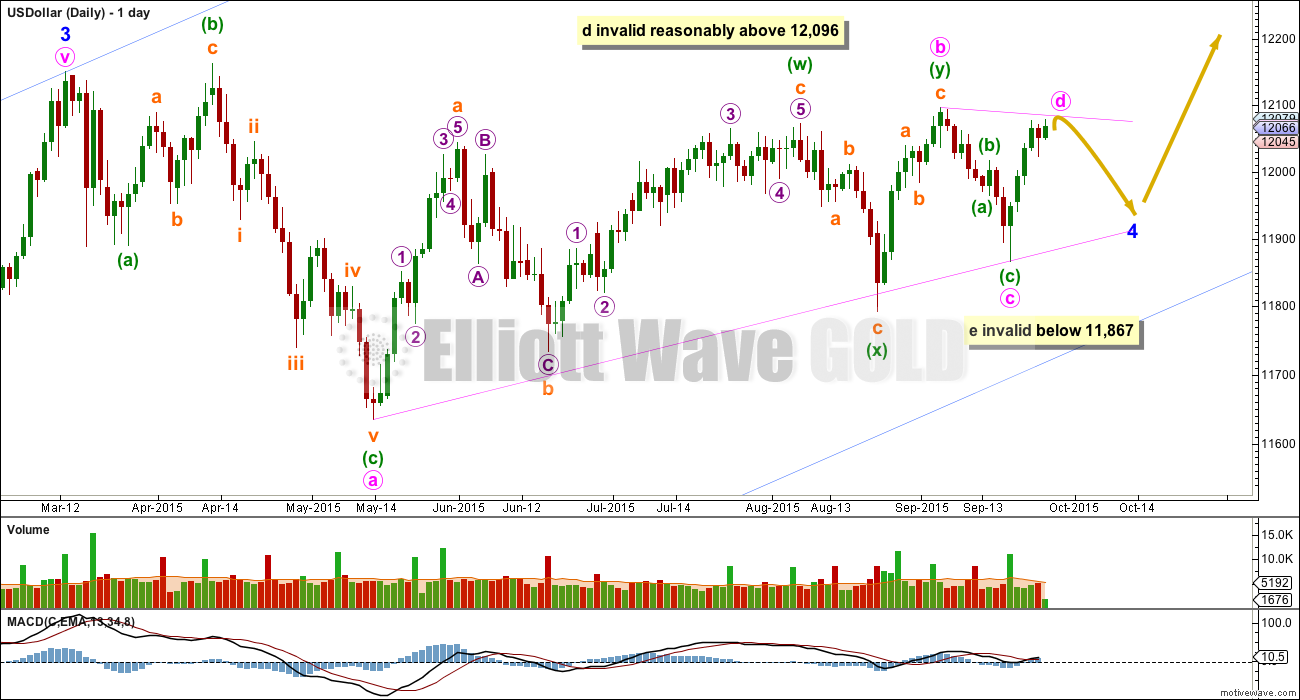
I have only one bullish Elliott wave count for the USD Index.
The US Dollar has been in a bull market since July 2011. So far there is no confirmation of a trend change.The bull market should be assumed to remain intact until proven otherwise.
Ratios within intermediate wave (1) are: minor wave 3 is 24.98 longer than 2.618 the length of minor wave 1, and minor wave 5 has no Fibonacci ratio to either of minor waves 3 or 1.
Within minor wave 3, there are no Fibonacci ratios between minute waves i, iii and v.
Ratios within minute wave iii are: minuette wave (iii) has no Fibonacci ratio to minuette wave (i), and minuette wave (v) is 8.46 short of 0.382 the length of minuette wave (iii).
Within intermediate wave (3), minor wave 3 is 87.36 longer than 4.236 the length of minor wave 1.
Minor wave 3, within intermediate wave (3), shows strongest upwards momentum. MACD supports the Elliott wave count.
Within intermediate wave (3), minor wave 2 was a very deep 0.98 zigzag. Minor wave 4 may be unfolding as a very shallow triangle which would exhibit perfect alternation.
Draw a channel about intermediate wave (3) using Elliott’s first technique: draw the first trend line from the highs labelled minor waves 1 to 3, then place a parallel copy on the low labelled minor wave 2. So far this contains all of intermediate wave (3). Minor wave 4 may find support at the lower edge of this channel if it gets that far.
The US Dollar has been in a sideways consolidation since mid March. During this sideways movement it is an upwards week which has strongest volume. This indicates that when the consolidation is complete an upwards breakout is more likely than downwards.
A final support line is shown in bright aqua blue.
The daily chart shows the whole structure of minor wave 4 which may complete as a triangle, as expected, but it is also possible the triangle may be invalidated and the structure may morph into a combination.
Minute wave d may not move beyond the end of minute wave b above 12,096 for the triangle to remain valid. This invalidation point is not black and white because for a barrier triangle D may end slightly above B, as long as the B-D trend line remains essentially flat.
Minute wave e may not move beyond the end of minute wave c below 11,867. This point is black and white for the triangle. If it is breached, then minor wave 4 may be morphing into a combination.
I would not consider the possibility that minor wave 4 could be over at the low labelled minute wave a because it would not exhibit alternation with minor wave 2; they would both be zigzags.


The issue of different price points on different data feeds always comes up.
It’s a fact of life. Gold spot price should be the same, but it’s not. The USD index cash price should be the same, but it’s not.
There is nothing I can do about those differences.
What I can do is provide a wave count for the data feed I have which I can access in Motive Wave. If I can’t access the data feed in Motive Wave then I will not be providing a wave count on it.
The differences in price points does not mean one is right and another is wrong, it just means they are different. If the data I am using is the same as your broker is using then the wave count will be more useful for you. If the data I am using is different to the one your broker quotes it will still be useful but invalidation points will need to allow for more flexibility. Structures may be a little different.
For something like Gold spot and USD index the overall bigger picture will still be very much the same.
Hi Lara,
I am looking at DXY, seems to be the same data feed as stockcharts.
https://www.tradingview.com/chart/?symbol=DXY
Cheers,
Heiko
Euro bearish
Lara, any idea why your chart has a much lower low in May than August and the Stockcharts $USD chart I show has a much lower low in August than in May? I know we’ve talked about different data feeds for gold, but this seems like a very large variance. Is there more than one way to look at the $USD and does it matter? Thanks,
Yes Dreamer, thanks for pointing that out, that one is even worst than the missing july low in gold. Seems like it is not going to be a transient problem but an on going one.
But as long as you’re trading the exact same instrument that Lara is analysing, her wave counts will be valid.
I am using the FXCM data feed for the USD index. Yes, the data is somewhat different from the data used by StockCharts.
I am not using StockCharts data for this market because they do not supply volume data.
There is more than one way to look at the USD index. There are as many ways as there are different data feeds. It may make a material difference to the wave count, but most likely it will not.
Thank you!
You’re welcome.
Lara, thank you for the unexpected surprise analysis of USD. Very helpful. Looks like another piece of the puzzle to support the bear count in gold.
Yes. I’ve been working on this for a wee while. I figured I should put it up here.