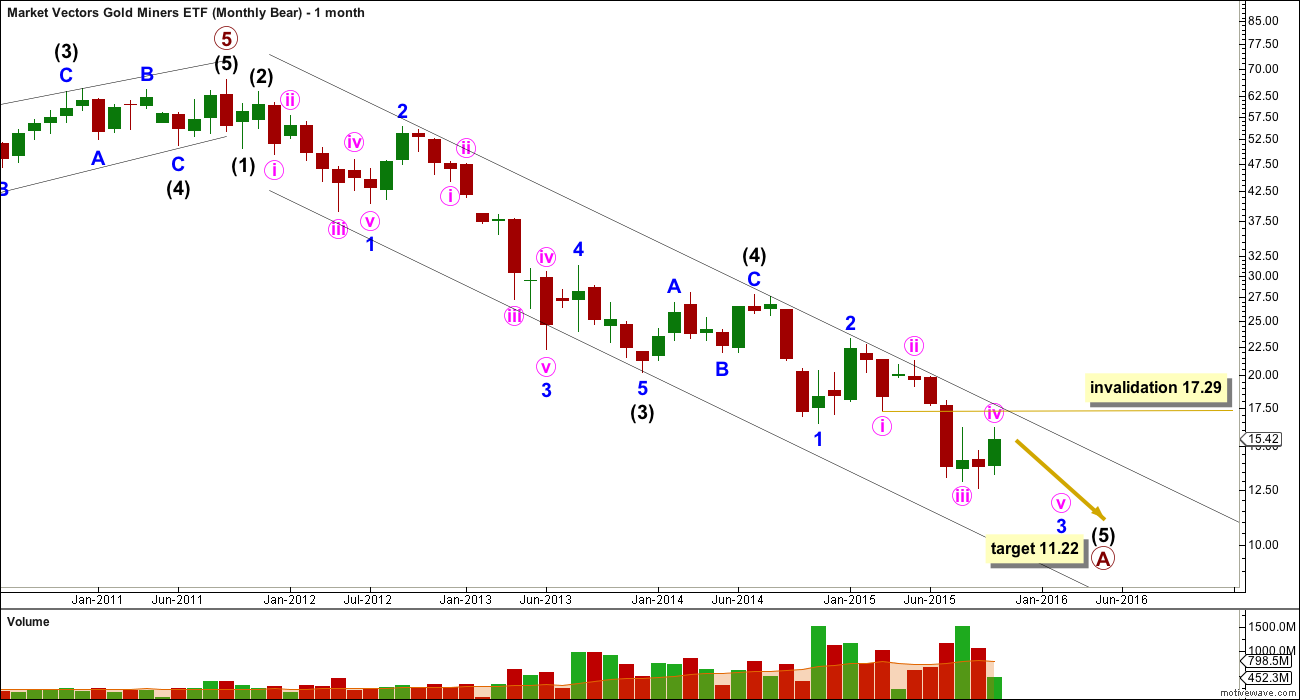
BEAR – MONTHLY ELLIOTT WAVE COUNT
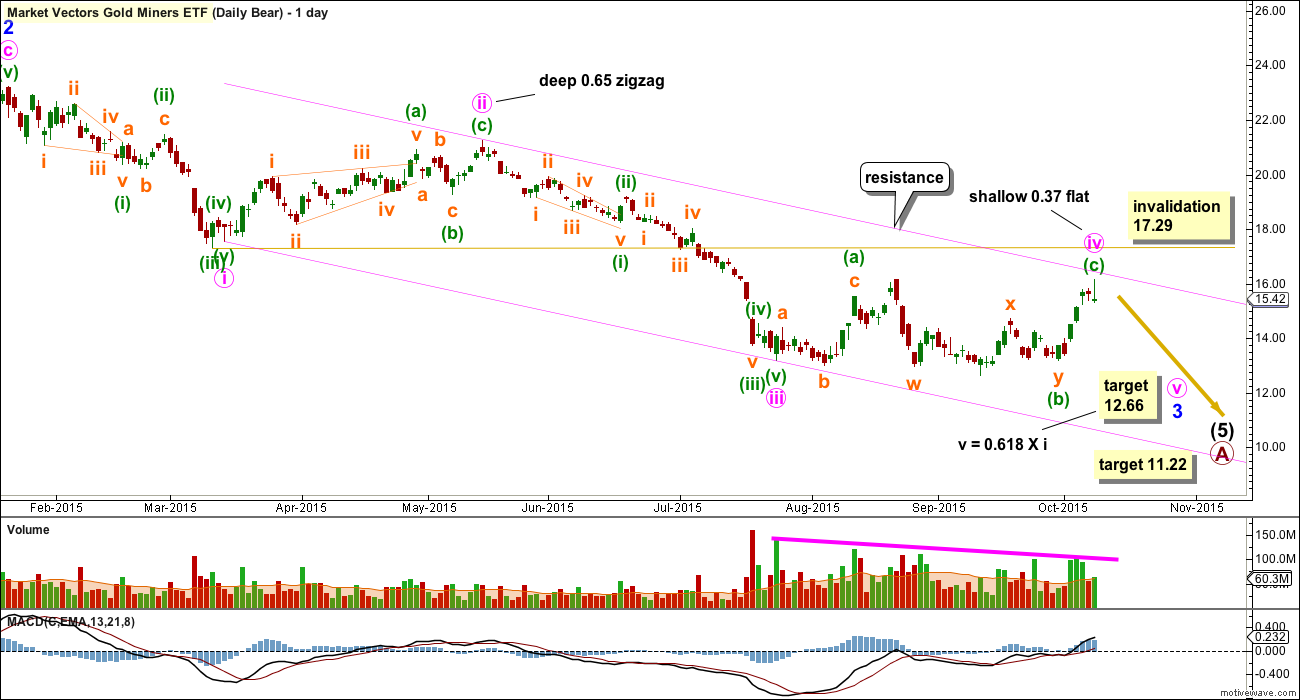
BEAR – DAILY ELLIOTT WAVE COUNT
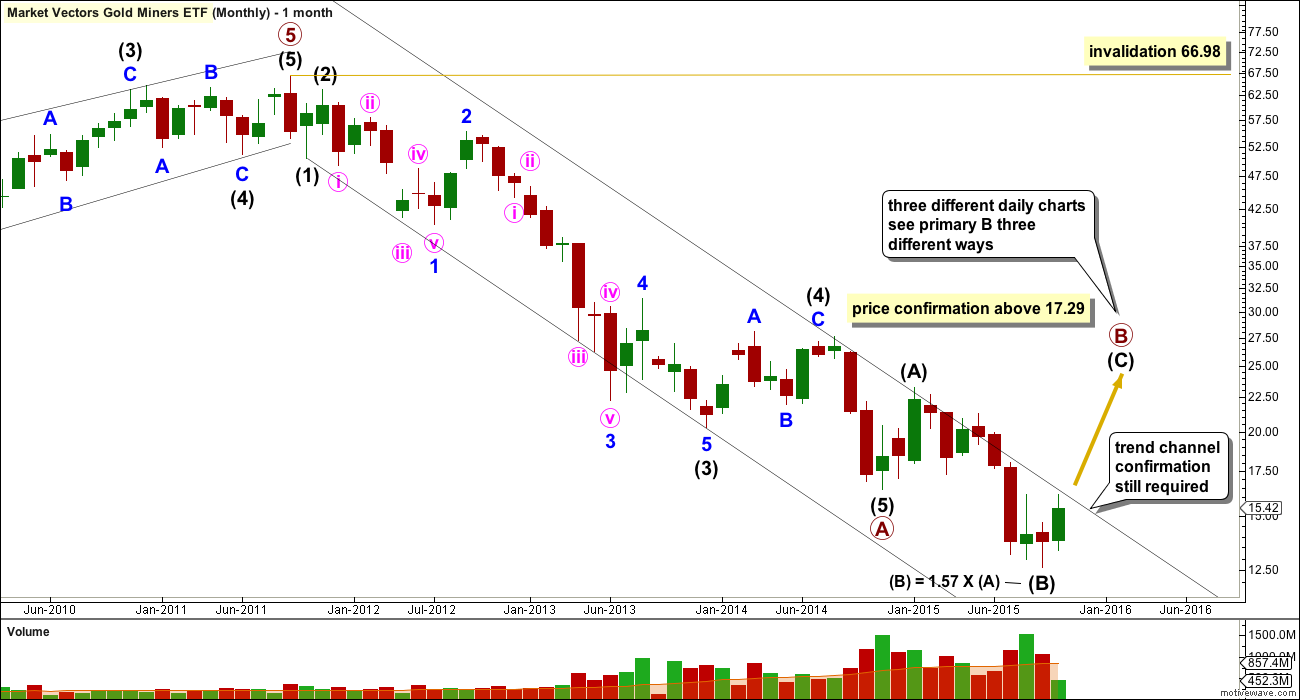
BULL – MONTHLY ELLIOTT WAVE COUNT
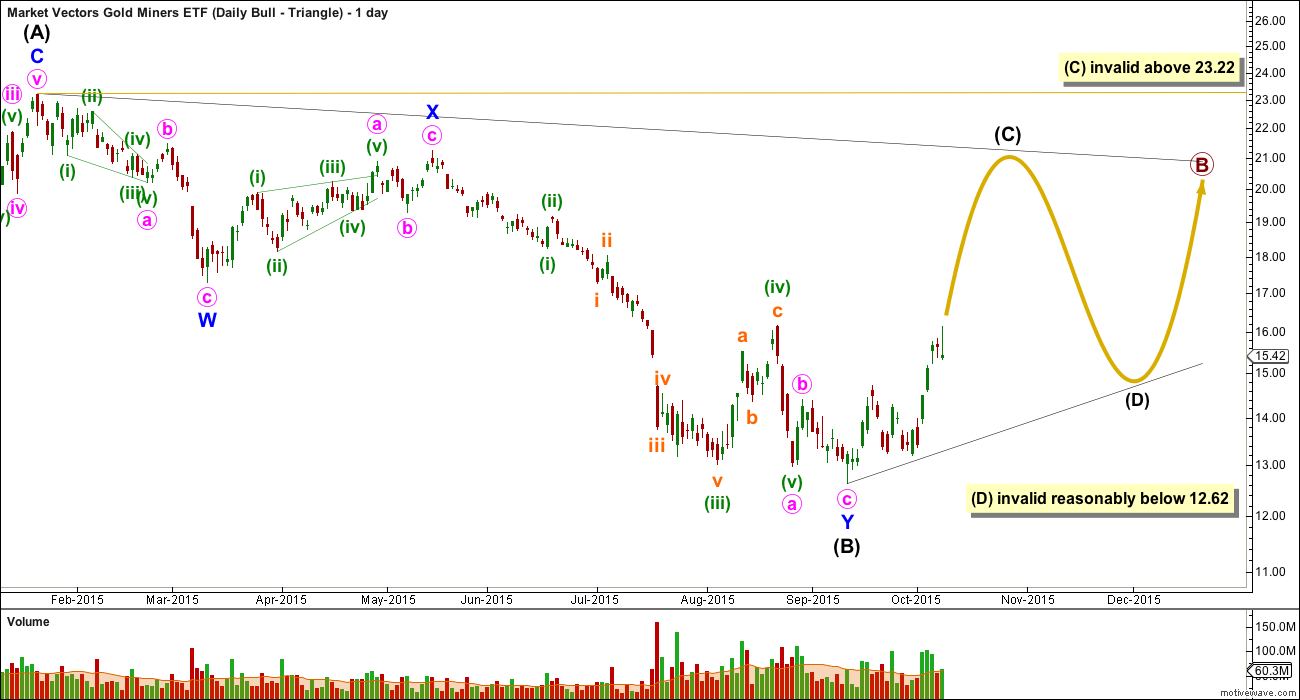
There are at this stage three likely structures for primary B for the bull wave count .
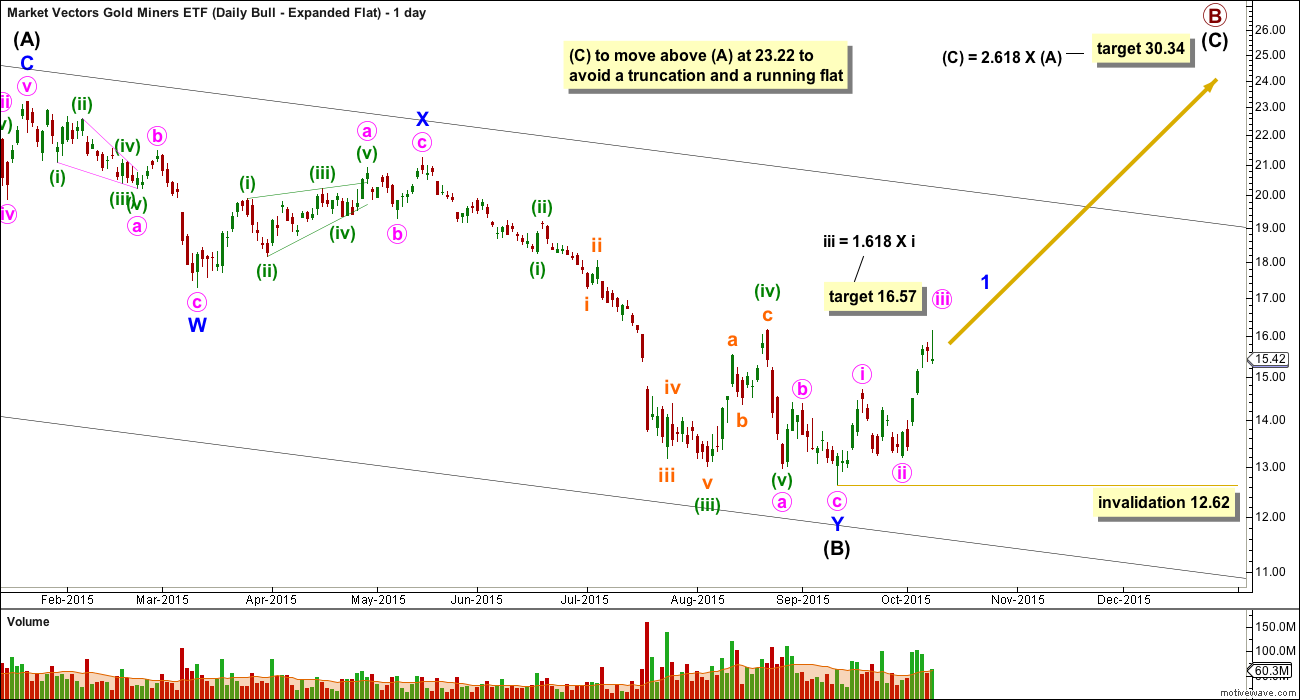
BULL – DAILY ELLIOTT WAVE COUNT – EXPANDED FLAT
BULL – DAILY ELLIOTT WAVE COUNT – TRIANGLE
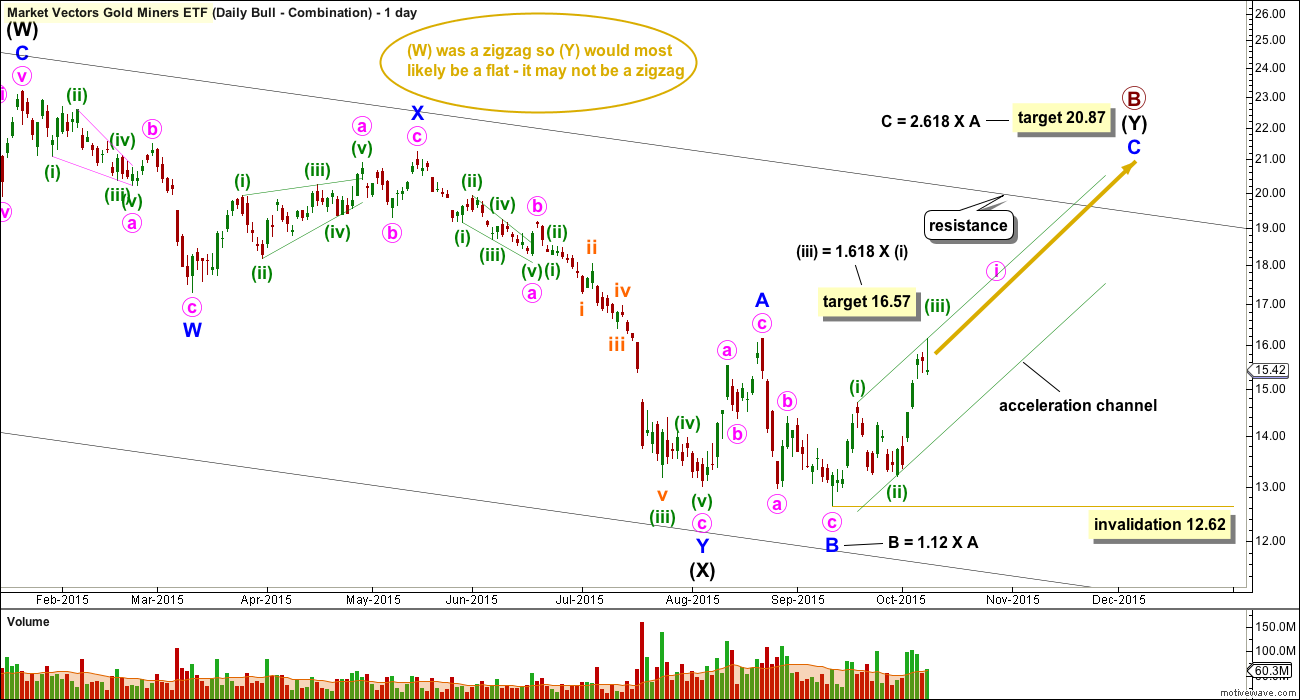
BULL – DAILY ELLIOTT WAVE COUNT – COMBINATION
Intermediate wave (Y) may be an expanded flat. The target may be too low as it may not see primary B breach the bear market channel, and it should.

