Again, upwards movement was expected but did not happen.
Price moved slightly lower to make a new low just 1.2 below the prior day’s low and complete a small red doji.
Summary: A new high above 1,174.51 is required to have confidence that upwards movement shall continue for another one to few days. If price makes a new high above 1,174.51, the first target would be at 1,999 and the second target would be at 1,219 – 1,226. If price makes a new low below Thursday’s low at 1,162.52, the new alternate wave count would be preferred which expects more downwards movement to a target at 1,145 – 1,142.
To see weekly charts for bull and bear click here.
New updates to this analysis are in bold.
BULL ELLIOTT WAVE COUNT
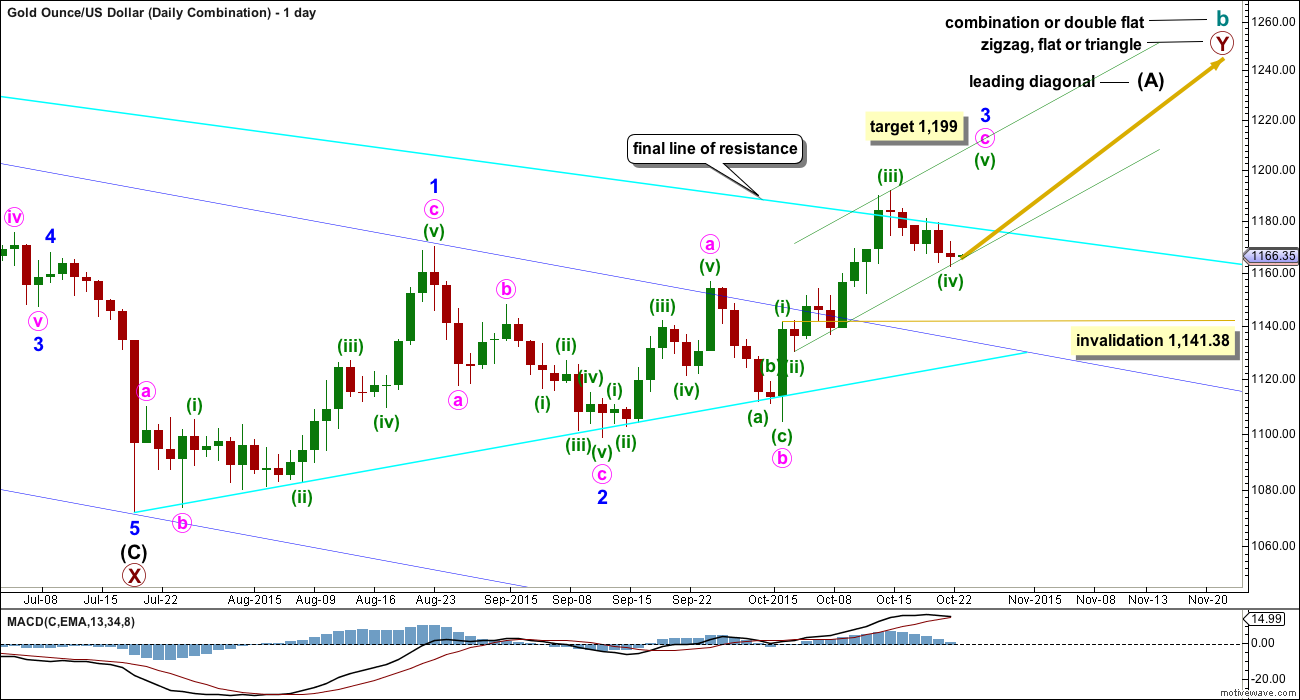
DAILY – COMBINATION
If cycle wave b is a combination, then the first structure in the double combination (or double flat) was an expanded flat. The double is joined by a three in the opposite direction labelled primary wave X which was a zigzag.
The second structure in the double may be another flat for a double flat, or it may be a zigzag or triangle for a double combination. Because a triangle for primary wave Y would essentially make the whole of cycle wave b the same as a triangle for cycle wave b, this chart will focus only on a possible zigzag for primary wave Y.
If primary wave Y is a zigzag, then intermediate wave (A) must be a five wave structure and may be unfolding as a leading diagonal.
If primary wave Y is a flat correction, then intermediate wave (A) must be a three wave structure and may be unfolding as a double zigzag (this idea is how the Daily – Triangle chart labels upwards movement).
For all possibilities, a five wave impulse is still required to complete upwards. The expected direction is still upwards for a fifth wave. At 1,199 minute wave c would reach 1.618 the length of minute wave a. At 1,200 minuette wave (v) would reach equality in length with minuette wave (i). This gives a $1 target zone calculated at two wave degrees, so it would have a reasonable probability.
The point at which minor wave 3 would reach equality in length with minor wave 1 is 1,196.95. If minor wave 3 ends above this point, the leading diagonal would be expanding. If it ends below this point, the leading diagonal would be contracting. When it is known if the diagonal is contracting or expanding, then a minimum and maximum for minor wave 4 shall be known.
Minuette wave (iv) may not move into minuette wave (i) price territory below 1,1141.38.
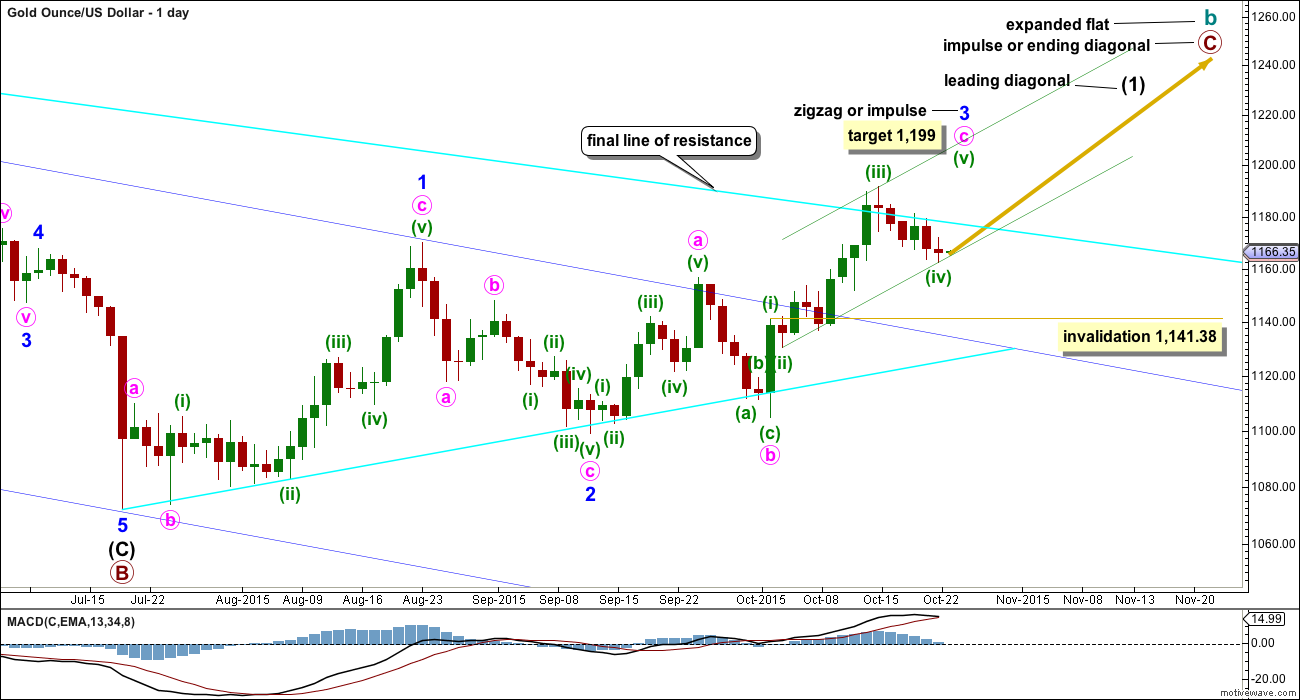
DAILY – EXPANDED FLAT
Cycle wave b may also be a flat.
If cycle wave b is an expanded flat, then primary wave C must be a five wave structure. If the current diagonal unfolds as a contracting diagonal (most common), then it would be intermediate wave (1) of a five wave impulse upwards for primary wave C. If the current diagonal unfolds as an expanding diagonal, then the degree of labelling within primary wave C may be moved up one degree because an expanding diagonal may be an ending diagonal for primary wave C in its entirety.
At 1,196.95 minor wave 3 will pass equality in length with minor wave 1. Above that point the diagonal must be expanding and not contracting.
A leading diagonal requires the second and fourth waves to subdivide as zigzags. The first, third and fifth waves are most commonly zigzags, but sometimes may appear to be impulses. So far minor wave 1 fits well as a zigzag.
Minor wave 2 is 0.73 the depth of minor wave 1, nicely within the normal range of between 0.66 to 0.81 for a second wave within a diagonal.
Third waves within leading diagonals are most commonly zigzags, but sometimes they may be impulses. Minor wave 3 is now showing some increase in upwards momentum beyond that seen for minor wave 1. Minor wave 3 has moved above the end of minor wave 1 above 1,170.19.
There now looks like a five up on the daily chart within minor wave 3. This may be minute wave a within a zigzag or it may also be minute wave i within an impulse.
Current upwards movement would be minute wave c or minute wave iii. Either way, it must subdivide as an impulse. On the hourly chart so far the structure still looks incomplete.
The hourly chart below works in the same way for the first two daily charts.
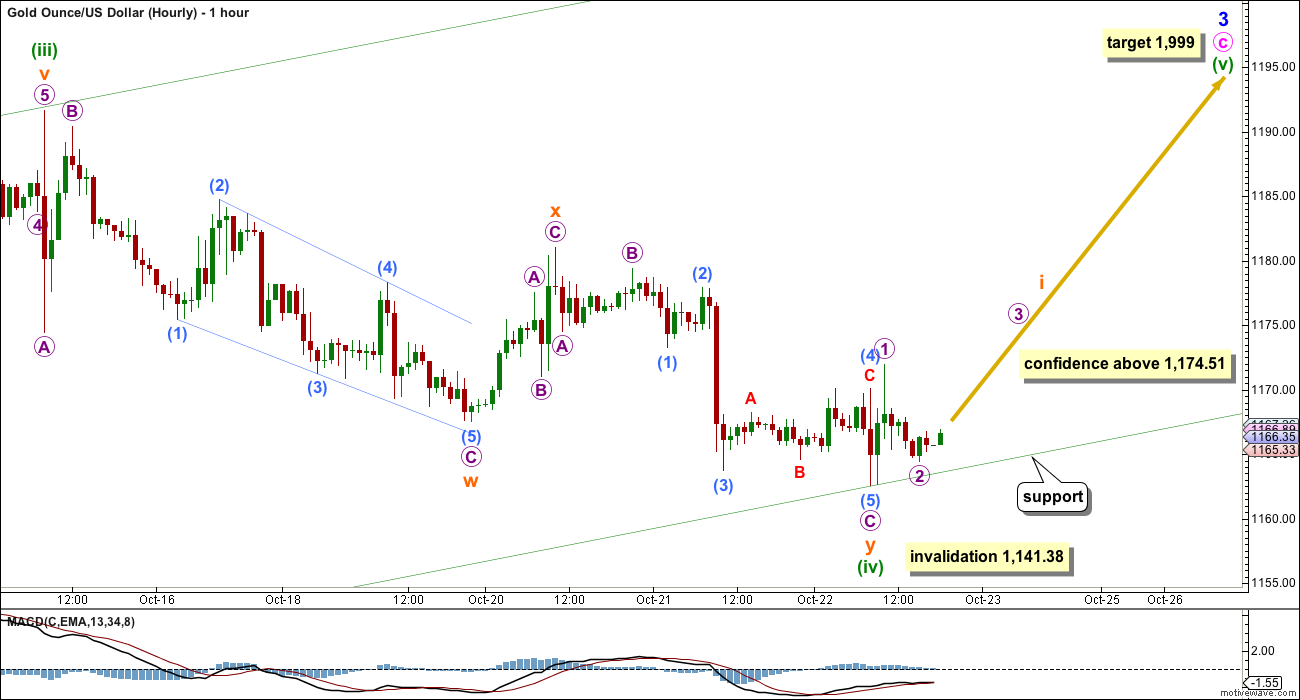
HOURLY CHART
A little further downwards movement now makes micro wave C look more clearly like a five wave impulse.
A new high above 1,174.51 would invalidate the new alternate wave count and provide confidence that downwards movement is over and a fifth wave upwards should be underway. While price remains below this point the risk will be that the new alternate wave count is correct.
At 1,999 minuette wave (v) would reach equality in length with minuette wave (i). Also now at 1,999 minute wave c would reach 1.618 the length of minute wave a.
Minuette wave (iv) may not move into minuette wave (i) price territory below 1,141.38. However, if price makes a new low below Thursday’s low at 1,162.53, then the probability of this wave count would substantially reduce in favour of the new alternate. At that stage, the expectation would be for price to keep moving lower for a few days.
DAILY – TRIANGLE
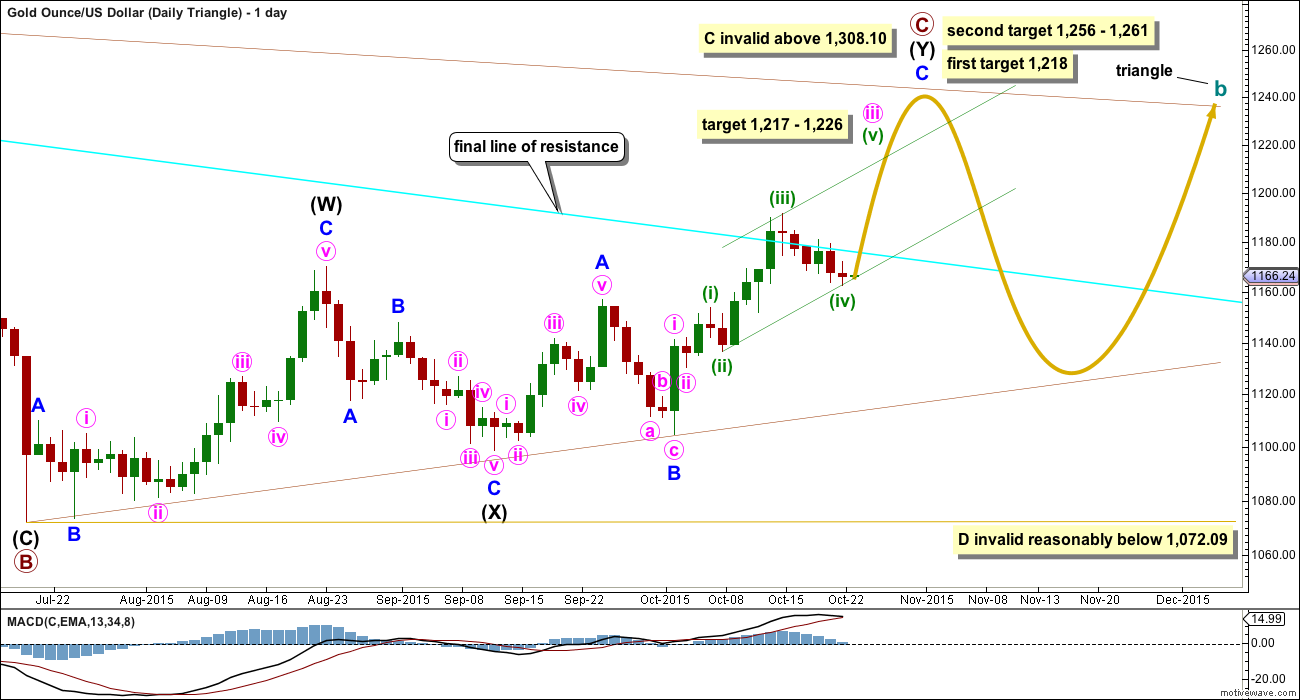
This daily chart looks at what a triangle would look like for cycle wave b. The triangle would be a running contracting or barrier triangle. Within the triangle, primary wave C up must be a single or multiple zigzag. Primary wave C may not move beyond the end of primary wave A above 1,308.10.
This idea slightly diverges from the other two ideas for cycle wave b as an expanded flat or combination.
The expected direction is still exactly the same, and the current upwards structure is still seen as an impulse. The first short term target is changed. At 1,222 minuette wave (v) would reach equality in length with minuette wave (i). At 1,226 minute wave iii would reach 2.618 the length of minute wave i. This target is higher than the first target for the end of primary wave C, so if the short term target is only the end of minute wave iii, then the second higher target would be more likely for primary wave C.
The first target at 1,218 is where primary wave C would reach 0.618 the length of primary wave B. If price gets up to the first target and the structure of minor wave C is a complete five wave impulse, then it may be over there.
The second target at 1,256 is where minor wave C would reach 2.618 the length of minor wave A, and at 1,261 primary wave C would reach 0.8 the length of primary wave A.
For the triangle idea, for cycle wave b, a five wave impulsive structure only needs to complete upwards. The next wave down for primary wave D should be fairly time consuming, lasting about 2 to 6 months. Primary wave D may not move beyond the end of primary wave B at 1,072.09 for a contracting triangle. Alternatively, primary wave D may end about the same level as primary wave B at 1,072.09 for a barrier triangle, as long as the B-D trend line remains essentially flat. In practice this means primary wave D can end slightly below 1,072.09 and this wave count remains valid. This is the only Elliott wave rule which is not black and white.
HOURLY – TRIANGLE
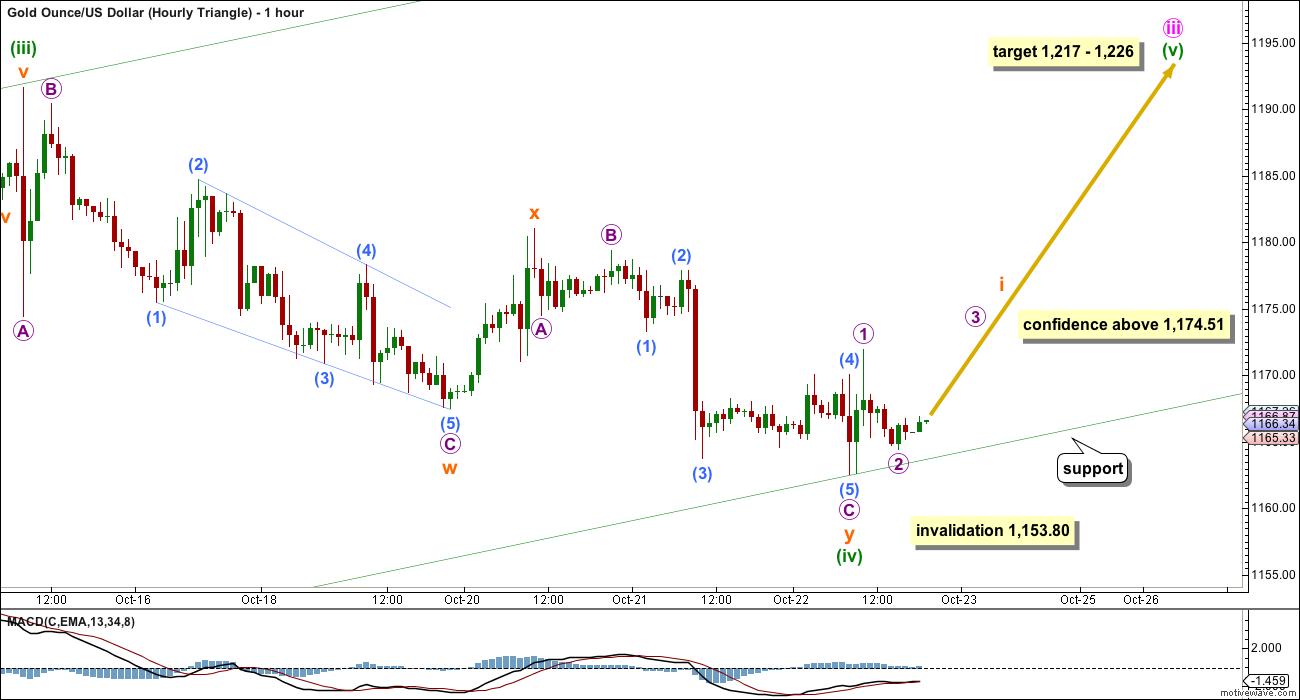
A new high above 1,174.51 is required to invalidate the new alternate wave count and provide confidence in this wave count.
At 1,217 minuette wave (v) would reach equality in length with minuette wave (iii). At 1,226 minute wave iii would reach 2.618 the length of minute wave i.
Minuette wave (iv) may not move into minuette wave (i) price territory below 1,153.80.
DAILY – EXPANDED FLAT ALTERNATE
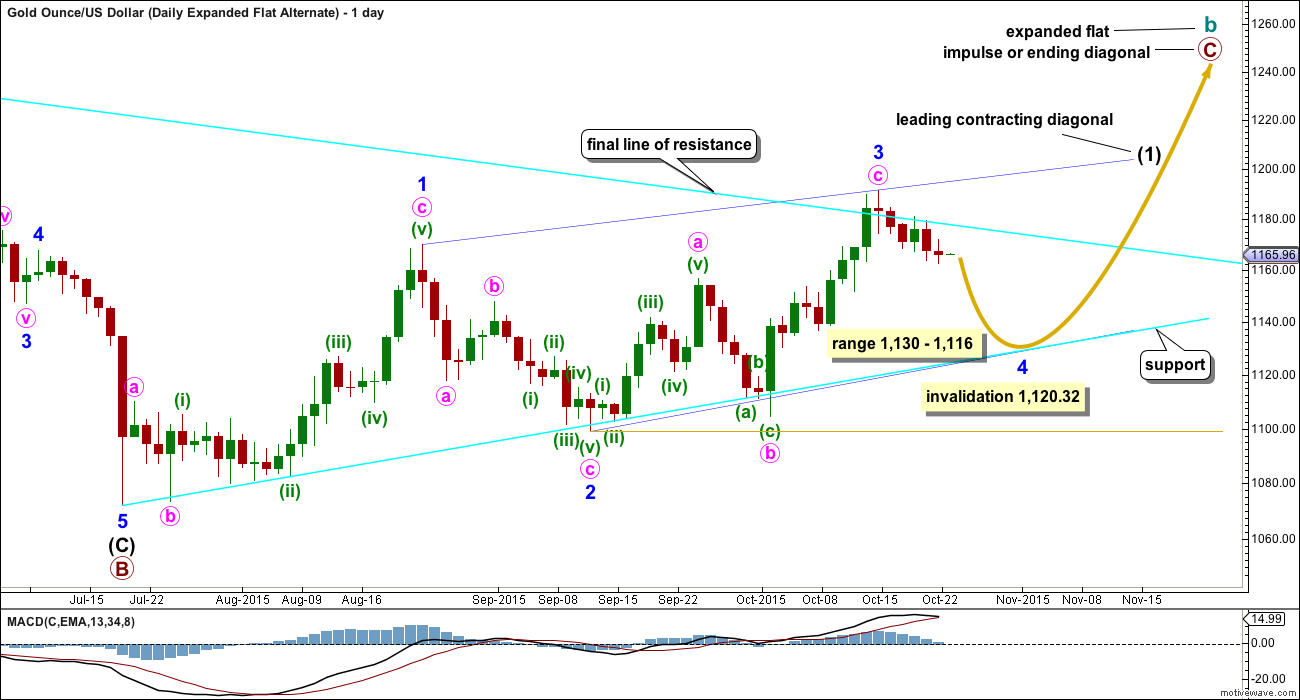
It is possible that the impulse upwards is complete, labelled here minute wave c. The subdivisions will fit at the hourly chart level and the Fibonacci ratios are good, but the problem with this wave count at the daily chart level is minute wave c does not look like a five wave impulse. This reduces the probability of this idea. It requires a new low at least below Thursday’s low before it should be seriously considered.
If we do see a new low in the next 24 hours, then minute wave c may be complete.
A leading diagonal may be unfolding upwards because minor wave 1 subdivides as a three (it will not fit as a five). Within leading diagonals, sub waves 1, 3 and 5 are most commonly zigzags, but sometimes they may also be impulses.
The normal depth for second and fourth waves within diagonals is between 0.66 to 0.81 the prior wave. This would give a target range for minor wave 4 from 1,130 to 1,116.
The diagonal would be contracting (the most common type, particularly for a leading diagonal), so minor wave 4 may not move beyond the end of minor wave 2. This maximum length is at 1,120.32.
Minor wave 4 must subdivide as a zigzag, must overlap back into minor wave 1 price territory, and may not move beyond the end of minor wave 2 (although the maximum length gives an invalidation point above the end of minor wave 2).
HOURLY – EXPANDED FLAT ALTERNATE
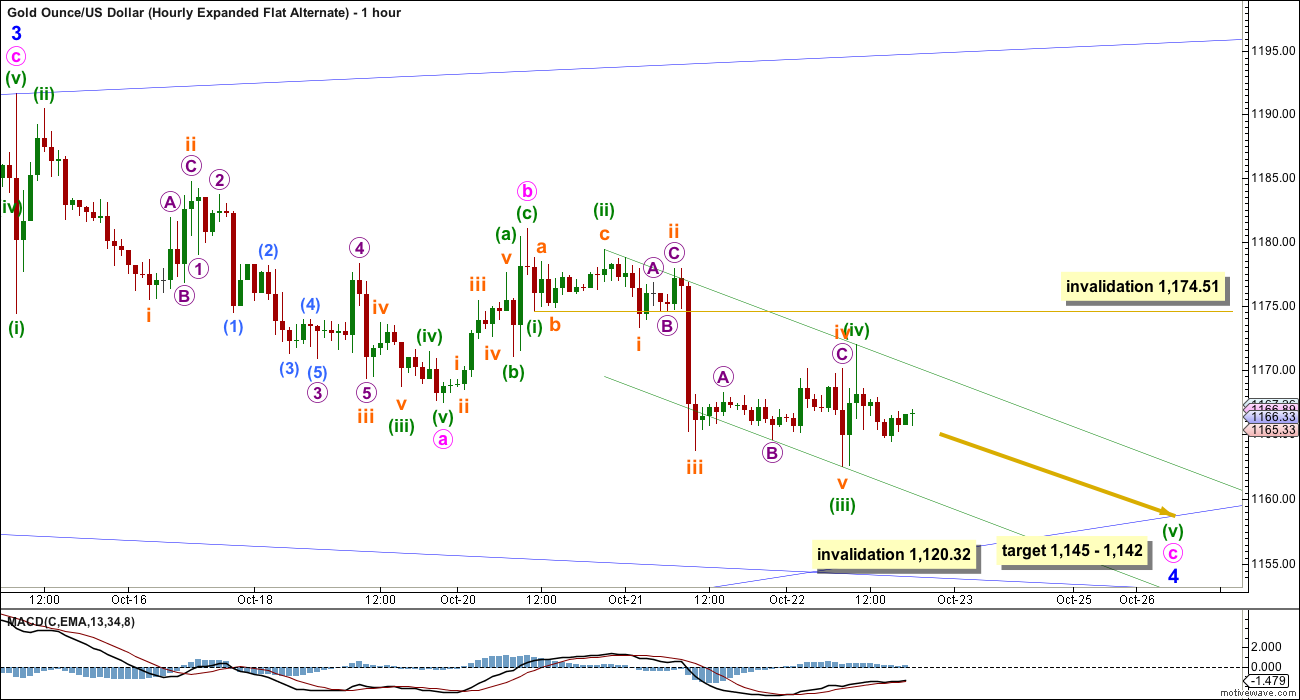
Minor wave 4 would be an incomplete zigzag. It is not yet deep enough for the diagonal to have the right look at the daily chart level.
At 1,145 minuette wave (v) would reach 1.618 the length of minuette wave (iii). At 1,142 minute wave c would reach 1.618 the length of minute wave a. This target would see minor wave 4 a little more shallow than the normal depth of a fourth wave within a diagonal. If this target is wrong, it would be too high.
Within minute wave c, minuette wave (iv) may not move into minuette wave (i) price territory above 1,174.51.
In order to compare this wave count which sees minute wave c as a complete five wave impulse with the first two wave counts which see it as incomplete, Fibonacci ratios are noted below. Fibonacci ratios for the other two ideas were noted in yesterday’s analysis.
Ratios within minute wave c are: minuette wave (iii) was just 0.40 longer than 1.618 the length of minuette wave (i), and there would be no adequate Fibonacci ratio between minuette wave (v) and either of (i) or (iii).
Ratios within minuette wave (iii) (extended) are: subminuette wave iii was 2.62 longer than 1.618 the length of subminuette wave i, and subminuette wave v was 2.07 longer than 0.618 the length of subminuette wave i.
BEAR ELLIOTT WAVE COUNT
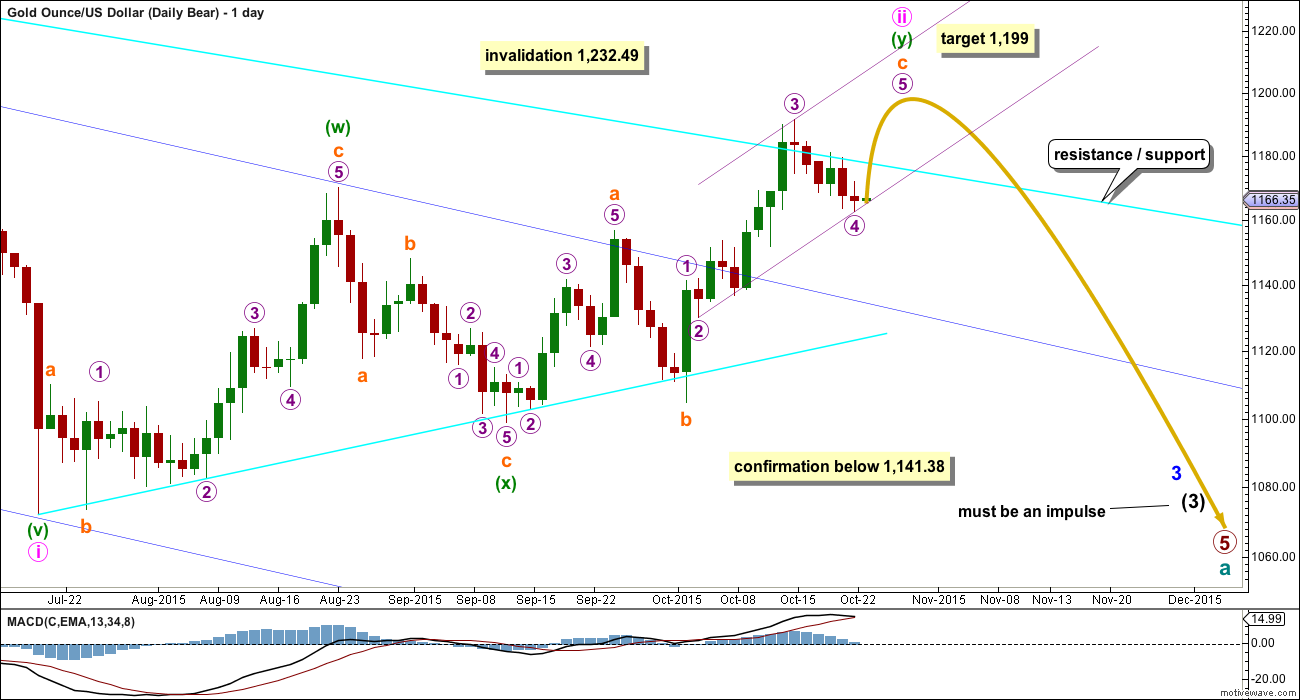
The final line of resistance (bright aqua blue line copied over from weekly charts) is only overshot and not so far properly breached. While this line is not breached the bear wave count will remain possible. Simple is best, and the simplest method to confirm a trend change is a trend line. While price remains below this line, it must be accepted that Gold has been in a bear market since 2011 and we don’t have technical confirmation that the bear market has ended.
The only option now for a bear wave count is to see minute wave ii continuing higher as a double zigzag.
Minute wave ii has strongly breached the dark blue base channel drawn about minor waves 1 and 2. When a lower degree second wave correction breaches a base channel drawn about a first and second wave one or more degrees higher, then the probability of the wave count reduces, particularly at higher time frames.
The structure of upwards movement for the bear wave count is exactly the same as the bull for the short term: a five wave impulse is unfolding upwards and it is incomplete.
Minute wave ii may not move beyond the start of minute wave i above 1,232.49. A new high above that price point would be final price invalidation of any bear wave count. That would fully eliminate the concept that Gold remains in a bear market. No bear wave count should be considered above that point.
The idea presented in the new alternate (Daily Expanded Flat Alternate) above, that the last wave up could be a complete five wave impulse, works for this bear wave count as well.
If there is a new low in the next 24 hours, then this bear wave count would see minute wave ii over as a complete double zigzag. Minute wave iii downwards may then be underway.
TECHNICAL ANALYSIS
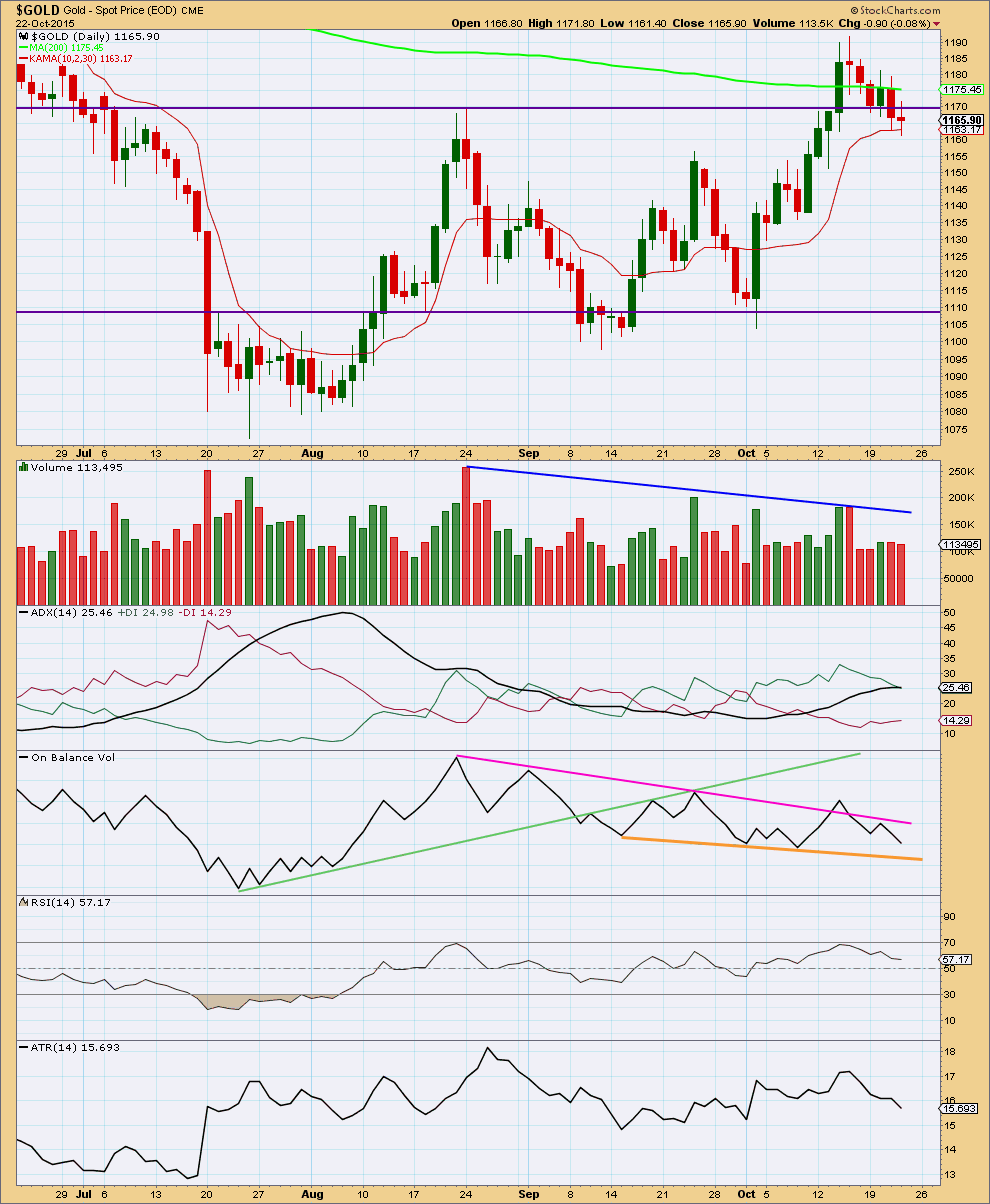
Click chart to enlarge. Chart courtesy of StockCharts.com.
Daily: Thursday’s downwards day comes on again slightly reduced volume. The fall in price is not supported by volume. This indicates it is more likely a small consolidation and not the start of a new downwards trend. This supports the Elliott wave counts which expect upwards movement from here and does not support the new alternate wave count.
I have reverted to using Kaufman’s Moving Average because the 9 day EMA was not useful to show where price is finding support at this time. This is more clearly showing where price is finding support today.
Today ADX is almost flat. Overall, ADX still indicates the market is trending and the trend is up.
The pink trend line is not working well for On Balance Volume. It is not technically significant enough. OBV may now find some support at the orange trend line, but that too is too short lived and not tested enough to be highly technically significant. It may provide some weak support.
RSI is not yet overbought. There is room for further upwards movement.
I added Average True Range (ATR) today to supplement ADX. ATR may be used as an indicator of trending / consolidating. When ATR declines the range price is travelling in declines; this is more typical of price behaviour during a consolidation. When ATR increases the range price is travelling in increases; this is more typical of price behaviour during a trend. Caution must be applied to the use of this indicator. Looking at how it behaves on this daily chart, the overall direction should be considered not each small daily movement.
Since 15th of September ATR has been overall moving higher indicating a trend while price moves higher. At this stage, ATR supports ADX in indicating the market is trending and the trend is up.
Overall, it looks like Gold has broken out of the recent consolidation and the breakout was upwards, despite the strongest volume day during the consolidation being downwards.
This analysis is published about 08:11 p.m. EST.

Updated COT Analysis. Made a few dollars on JNUG this week, but flat right now. This chart is getting way to high for me to be long in a bear market that is not quite a bull market yet. I’d like to see some follow through on the upside next week for Gold to Lara’s targets, and then I will likely add some short positions. Seems like good R/R.
Enjoy, and have a great weekend!
Thanks for the chart. This was quick I was expecting over the weekend.
Indicators are giving alert for PM sector higher prices.
I am long. Just bot JNUG at the close.
It only takes a few minutes to update now that it’s all set up.
I agree that miners look set to move up, i own some individual mining stocks, just not the leveraged etfs right now.
Unsure of miners just finished a c wave in a b wave and possibly headed down into an abc to finish this correction along with gold, or if both are already finished and heading up from here.
For the wave counts which see this as a fourth wave correction:
It may now be seen as a double flat. The up and down whipsaw for today will fit as a B and C wave of a second flat.
A new high now above today’s high at 1,179.49 would indicate more upwards movement.
For the wave count which sees a larger fourth wave incomplete within a diagonal:
The whipsaw would be wave (ii) and the start of wave (iii) down within wave C of the fourth wave zigzag. It needs further down to go. A new low below 1,159.07 would indicate more downwards movement.
Any opinions of possible retrace point today before close?
1,179.48 at 7:28 am morning high
– 1,159.01 at 9:55 am morning low
= 1,171.66 possible retrace point
Unless I figured it wrong.
If price is now in a short / mid term down trend (or the bear count is correct) then 1,171.65 would be the 0.618 Fibonacci ratio.
It’s at the 0.382 Fibonacci ratio now, at 1,166.83.
One of those, 50 /50
GDX very bullish MACD 1, 3, 5, 15, 39, 78 and 195 minute are all bullish.
NUGT is doing surprisingly well moving up from 42.26 at 10:00 am low and now at 46.88 at 2:32 pm up 10% from the 10:00 am low.
IMHO there is a good chance that, over the next 3 trading days, gold will bob around within the confines of today’s candlestick. There is a chance of gold creeping below today’s low, but if so it would be minor and would come back up. I expect gold will hold in the 1160s/1170s before Weds.
Matt you mention next Wednesday. There is no FMOC next week.
Thursday there is the weekly jobless claims.
http://www.marketwatch.com/Economy-Politics/Calendars/Economic
October 27-28 is the next Fed meeting, with a statement being released on Weds, the 28th, at 2pm EST. This statement will normally not come with a press conference, which is done every other meeting.
The full FOMC meeting schedule can be found under federalreserve.gov.
Surprising that gold now at 1162.95 and GDX is near day high now $16.43 and higher than Thursday when gold was at day high of 1,171.91 at 10:25 am and GDX at $16.27.
I now have 100% confidence that the Oct high will hold and that gold will gradually decline from here.
The high from last week seemed like the peak to me, but I was a little nervous because it went higher than I had originally anticipated. A similar scenario occurred in January, when gold moved higher than many expected, only to tumble down for the next 2 months.
I was impressed yesterday by gold’s resilience in the face of a massive US dollar rally. This again made me think that maybe there was a chance that gold could make a new high, but I have now put that idea to rest. That strength was enough to reach today’s high, but there was no follow through. Gold retraced close to .618 from last week’s high, so I took a chance and added to shorts today. I will continue to do so at each interim high on the way down.
Why I am so sure:
Gold has been in a bear market for over 4 years. It had a great rally from the July low and even exceeded the 200 day moving average. However, the 50 day average was way below the 200, which hinted that a rally was doomed to fail. The long term trend line has held. The dollar is breaking higher, so that makes it virtually impossible for gold to excel. And, Lara finally conceded that the 1191 high could have been a complete corrective structure for the bear count – came in the form of a brief comment in the video. 🙂
Hi Matt: I wouldn’t be too sure about the downside just yet although it appears to be heading there; not at least until Gold price gets below 20dma at 1153; once that occurs, then 100dma at 1141-40 and 50dma at 1138 become automatic magnets seeking lower lol….There is a likelyhood of 50dma crossing above 100dma soon, which would be bullish then…..//// Incidentally, Gold price is as yet having an inside week~!
I expect a gradual decline – not a plunge – with much overlapping. I also think that gold may retrace some of today’s movement over the coming days.
To add to another reason for being short, COT data really is indicating that gold (silver even more so) is near levels of previous highs. This does not help the short term trader, but gives me a lot of confidence that the general direction remains down.
Agree with you there for the general direction to the downside. Upside is becoming labored now, pretty much being capped below 1180-83 with 1190-91 a long shot… All the best & have a profitable trade.
Syed: I wanted to say that I really value your posts. While I generally view and trade the markets from a longer term perspective, I enjoy reading your crisp comments on the short term direction of gold. They are very helpful. Thanks.
Gold price seems to keep getting rejected under 1180 at 1179-80… Needs to now rise back up above 1164.50 for 1168-73 to face off with 200dma at 1175.50 yet again before looking to test a break above 1177 lol….
First gold overnight gives confidence to hourly Bull and invalidates hourly Alternate.
Then at 9:37 am takes away confidence in hourly Bull and tries but can’t take back invalidation in hourly Alternate. We need a new hourly alternate wave count.
Sold GDX as gold went below 1162.52 (down to 1,160.70) sign that wave up to 1,199 is over. Darn first confirms wave up high to 1,199 then confirms it’s over and heading down to 1145 or lower.
If we do see a new low in the next 24 hours below 1,162.52, then minute wave c up to 1,199 may already be complete and the new alternate wave count would be preferred which expects more downwards movement for a few days to a target at 1,145 – 1,142 then down to 1,130 to 1,116.
Lara,
Your main hourly chart has a target of 1999. I think you meant to have it as 1199.
I did. A mis type.
Great news gold went above 1,174.51 confirms heading for 1,199 and invalidates alternate hourly. I bought GDX at Thursday close.
Joseph
It is called BMR. Bear market rally. But EW counts are what they are.
Also it is known that EW sounds the alarm but mind set is not ready to accept the change just yet.
We need to let price tell us which count is real.
Live with Oscar video
Fast forward to minute 5.02
http://livewithoscar.com/Commodities/DailyVideo.aspx
Enjoy!!!
USD chart at 9:42 PM
If USD is strong gold is sideways and going up.????
I have a hard time believing gold is in a bull market now when most trends and elliottwave agree…dollar, equities in bull market and silver, oil in long term bear. Not saying it can’t happen but something is amiss.
That’s why I have a bear wave count.
I’m using the final line of resistance, a simple trend line, to define whether gold is in a bull or bear market. That line needs to be breached (not just overshot) before we shall have technical confirmation of a trend change.
It’s not breached yet and so we don’t have technical confirmation of a trend change from bear to bull.
$USD needs to break above the down sloping trend line from the high back in March before folks will take a continued rally seriously. Looks like the breakout point is around 97.25. A breakout is unlikely before the Fed meeting next week.