
Downwards movement was expected, but price has moved mostly sideways to complete a small green candlestick.
Summary: Short term a little upwards movement to about 1,172 is expected to complete a second wave correction. Thereafter, downwards movement is expected to the target at 1,142. If this target is wrong, it may not be low enough. The target should be met within five days, sooner rather than later.
To see weekly charts for bull and bear click here.
New updates to this analysis are in bold.
BULL ELLIOTT WAVE COUNT
DAILY – COMBINATION
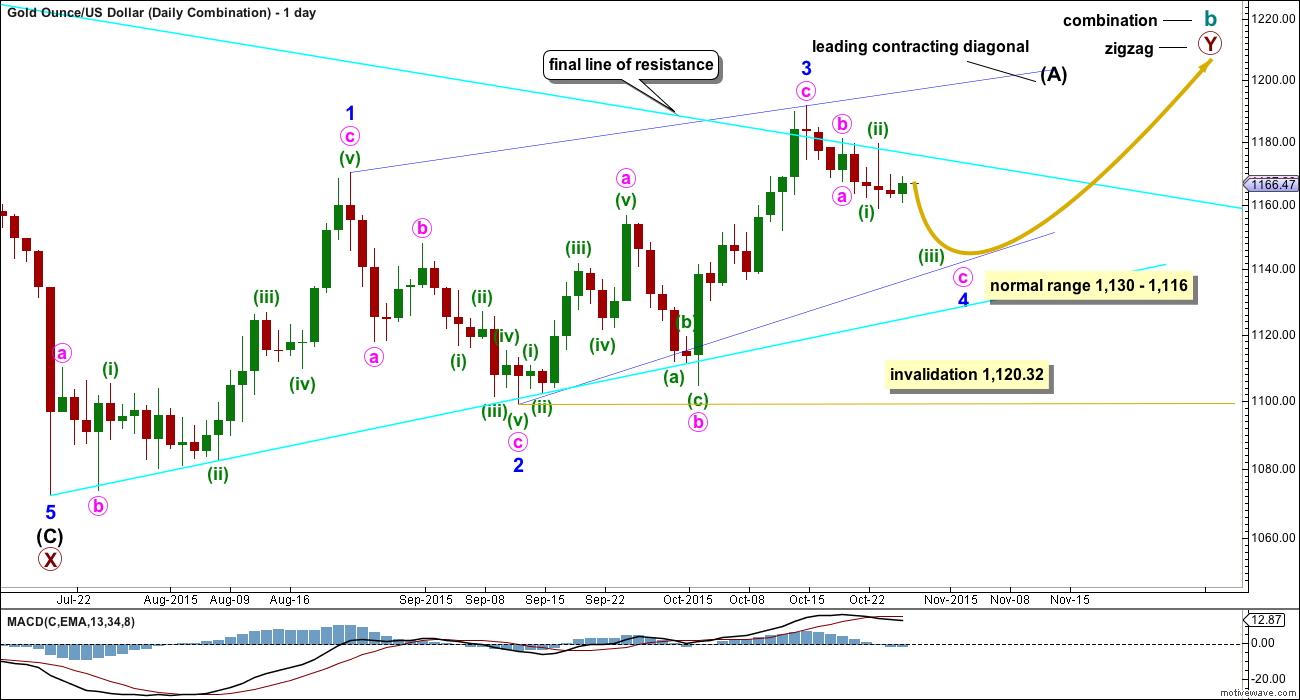
Click chart to enlarge.
If cycle wave b is a combination, then the first structure in the double combination (or double flat) was an expanded flat. The double is joined by a three in the opposite direction labelled primary wave X which was a zigzag.
Downwards movement of the last several days looks now to be too large in price and duration to be part of the prior upwards wave, which now looks like a separate wave. Minor wave 3 may be a complete zigzag of a leading diagonal. Minor wave 3 is shorter than minor wave 1, so the diagonal would be contracting which is the most common type particularly for a leading diagonal. This limits minor wave 4 to no longer than equality in length with minor wave 2. Minor wave 4 may not move below 1,120.32.
A five wave structure would be developing upwards for this wave count as a leading contracting diagonal. Because primary wave Y would be beginning with a five wave structure, this reduces the possible structures to a zigzag. Cycle wave b as a combination would be a flat – X – zigzag.
The normal range for a fourth and second wave within a diagonal is between 0.66 to 0.81 the prior actionary wave. That gives a normal range for minor wave 4 from 1,130 to 1,116. Minor wave 4 must end at the upper edge of the normal range (or above) to remain above the invalidation point.
DAILY – EXPANDED FLAT
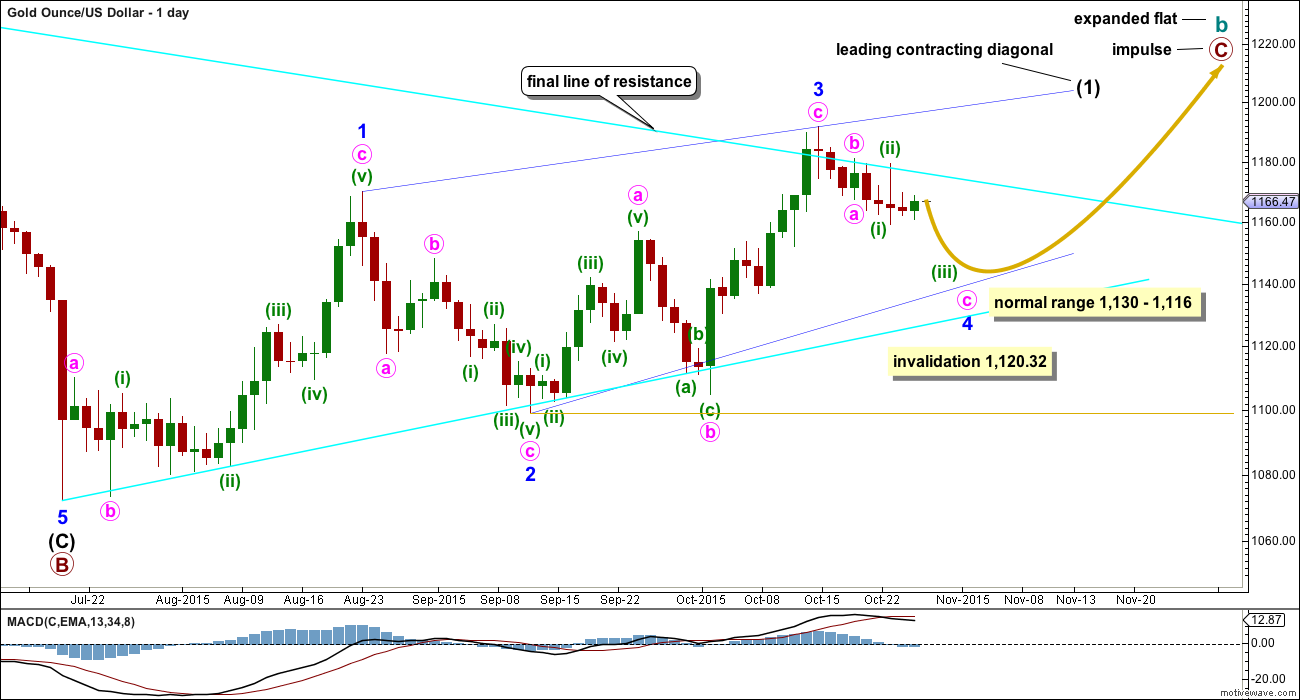
Click chart to enlarge.
Cycle wave b may also be a flat.
If cycle wave b is an expanded flat, then primary wave C must be a five wave structure. The current upwards wave may be unfolding as a leading contracting diagonal, so this would be minor wave (1) within primary wave C.
There are two possible structures for a C wave within a flat correction: an impulse or an ending diagonal. If the first wave is a five and not a zigzag, then an ending diagonal may be ruled out because ending diagonals require all sub waves to be zigzags. Primary wave C may now only be an impulse.
A leading diagonal requires the second and fourth waves to subdivide as zigzags. The first, third and fifth waves are most commonly zigzags, but sometimes may appear to be impulses. So far minor waves 1 and 3 both fit well as zigzags.
Minor wave 2 is 0.73 the depth of minor wave 1, nicely within the normal range of between 0.66 to 0.81 for a second wave within a diagonal.
The hourly chart below works for both these first two daily charts.
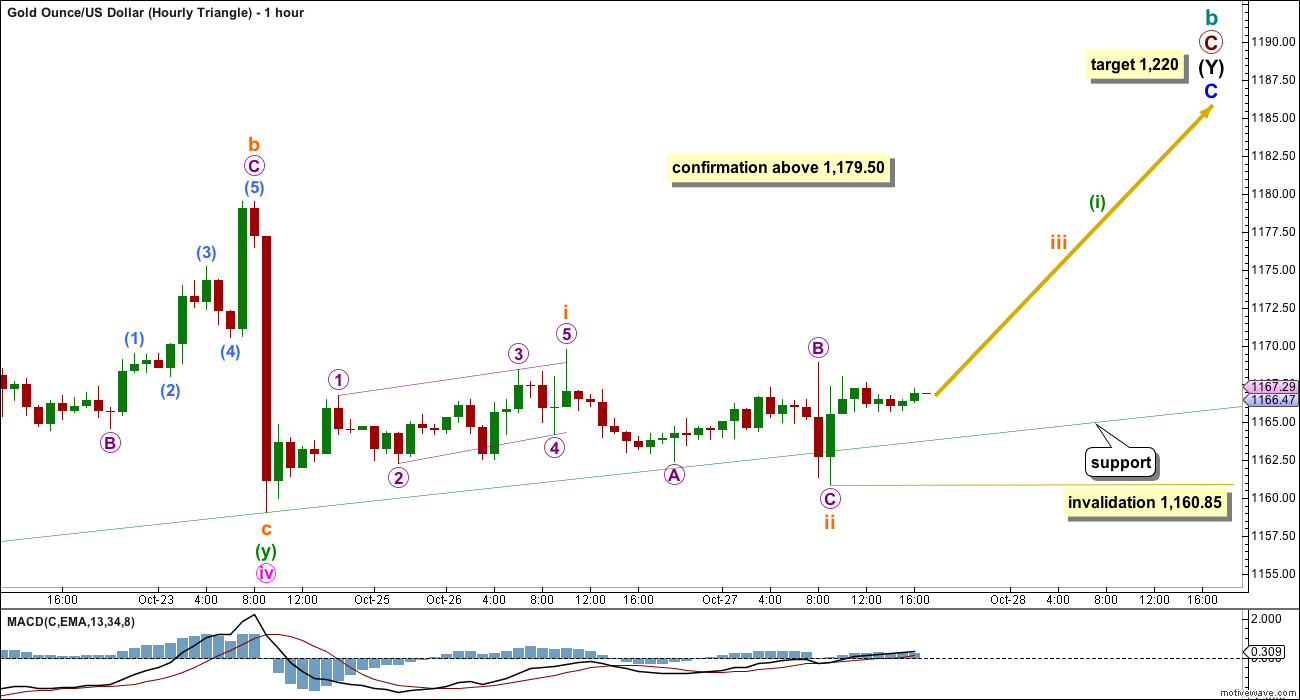
HOURLY CHART
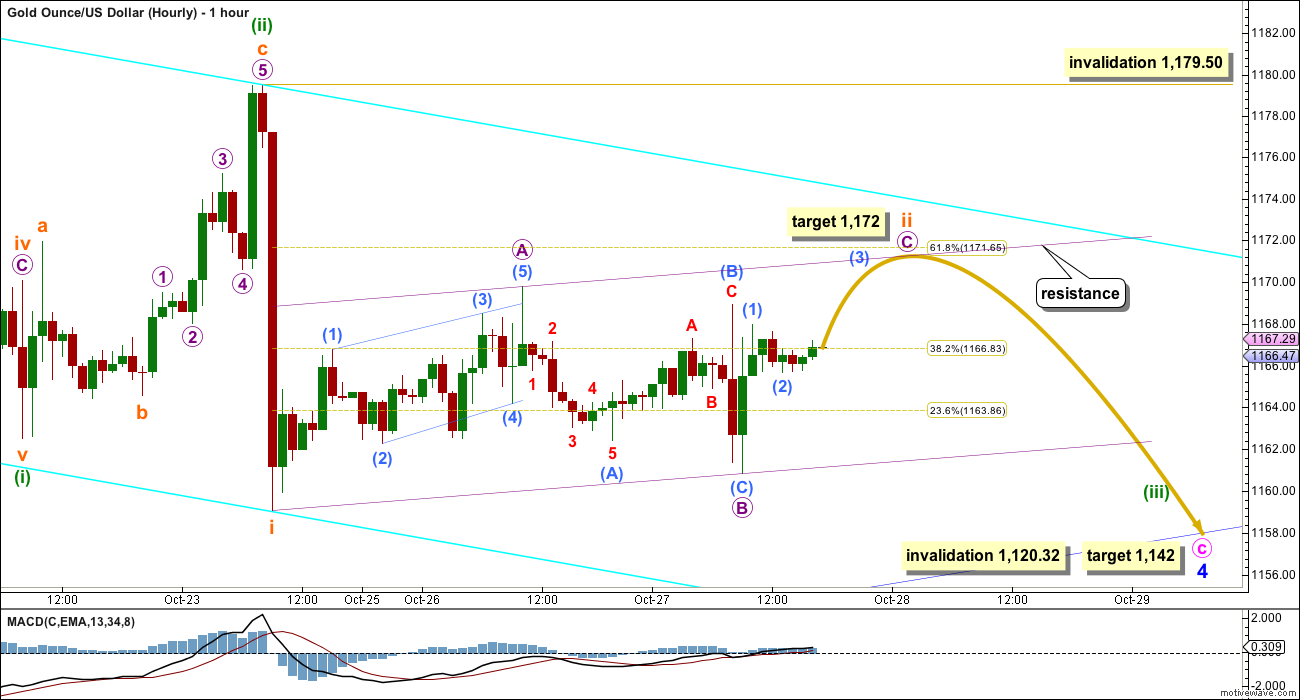
Click chart to enlarge.
Subminuette wave ii looks like it is continuing sideways. The downwards wave which began Tuesday’s session is a three and not a five, so this may not be part of an impulse down but more likely part of a correction.
Subminuette wave ii may be unfolding as a zigzag. Micro wave A within it will subdivide as a five, a leading contracting diagonal. Micro wave B subdivides as a three. Micro wave C upwards must complete as a five wave structure. It is very likely to move at least slightly above the end of micro wave A at 1,169.79 to avoid a truncation.
Micro wave C may end about the 0.618 Fibonacci ratio of micro wave A. I will use this for the target as it may be more reliable than expecting micro waves A and C to exhibit a Fibonacci ratio to each other. This target would also see micro wave C end about the upper edge of the small channel drawn about subminuette wave ii. Price is likely to find resistance at the upper violet trend line.
When subminuette wave ii can be seen as a complete zigzag, subdividing 5-3-5, then a subsequent breach of the violet channel drawn about it by downwards movement would provide trend channel confirmation that submineutte wave ii would be over and subminuette wave iii should be underway.
Subminuette wave ii may not move beyond the start of subminuette wave i above 1,179.50. When the channel about subminuette wave ii is breached by downwards movement, then the invalidation point may move down to the end of subminuette wave ii.
DAILY – TRIANGLE
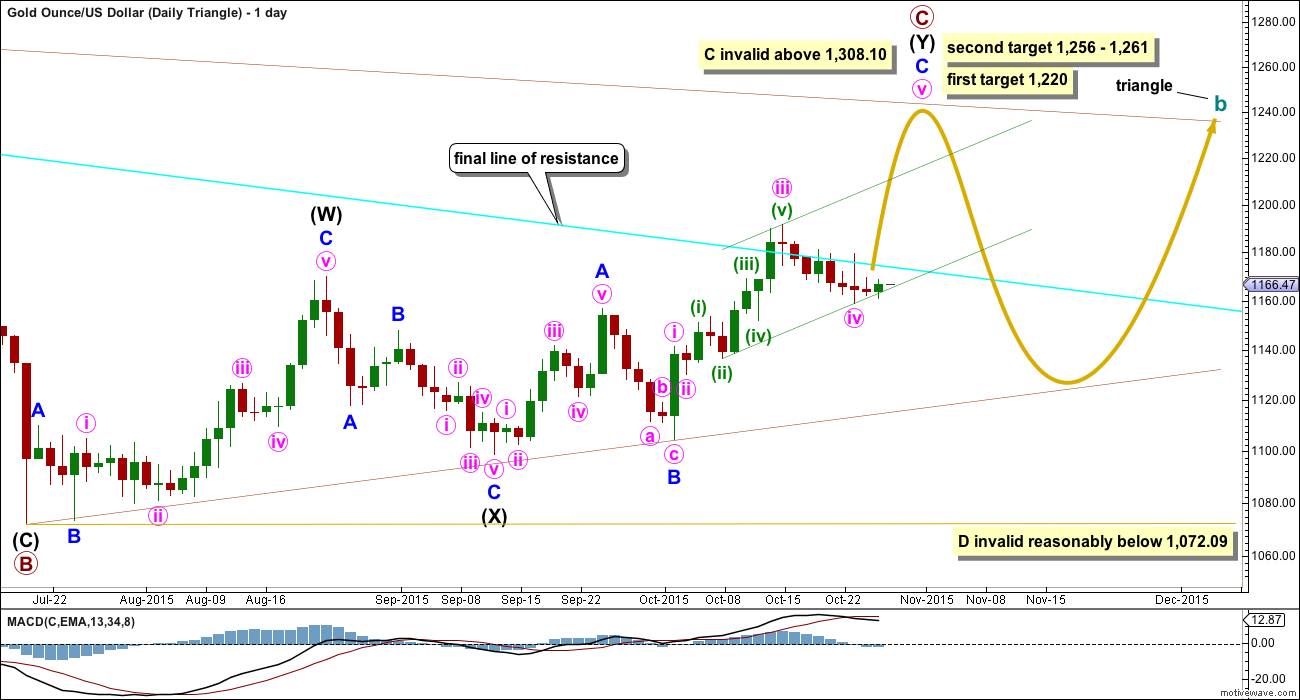
Click chart to enlarge.
This daily chart looks at what a triangle would look like for cycle wave b. The triangle would be a running contracting or barrier triangle. Within the triangle, primary wave C up must be a single or multiple zigzag. Primary wave C may not move beyond the end of primary wave A above 1,308.10.
This idea slightly diverges from the other two ideas for cycle wave b as an expanded flat or combination.
If a triangle is unfolding, then at the weekly chart level primary wave C looks unlikely to be complete and should move higher for the triangle to have the right look. This wave count sees upwards movement as incomplete for minor wave C with a final fifth wave yet to unfold. At 1,220 minute wave v would reach equality in length with minute wave iii. This would see primary wave C end close to 0.618 the length of primary wave B. One of the five sub waves of a triangle is commonly about 0.618 the length of its predecessor.
The second target at 1,256 is where minor wave C would reach 2.618 the length of minor wave A, and at 1,261 primary wave C would reach 0.8 the length of primary wave A.
For the triangle idea, for cycle wave b, a five wave impulsive structure only needs to complete upwards. The next wave down for primary wave D should be fairly time consuming, lasting about 2 to 6 months. Primary wave D may not move beyond the end of primary wave B at 1,072.09 for a contracting triangle. Alternatively, primary wave D may end about the same level as primary wave B at 1,072.09 for a barrier triangle, as long as the B-D trend line remains essentially flat. In practice this means primary wave D can end slightly below 1,072.09 and this wave count remains valid. This is the only Elliott wave rule which is not black and white.
HOURLY – TRIANGLE
Click chart to enlarge.
A new high now about 1,179.50 would invalidate the first hourly chart and provide some confirmation of this second idea. For the first two daily charts, this idea is also possible; there, the five wave impulse of minute wave c may also be incomplete requiring a final fifth wave upwards.
The subdivisions of recent movement are seen in the same way at the hourly chart level for both wave counts. Here, the leading diagonal may have been a first wave followed by a zigzag downwards for a second wave.
This wave count expects a third wave upwards to develop which should show some increase in upwards momentum. The fifth wave within it may be surprisingly swift and strong.
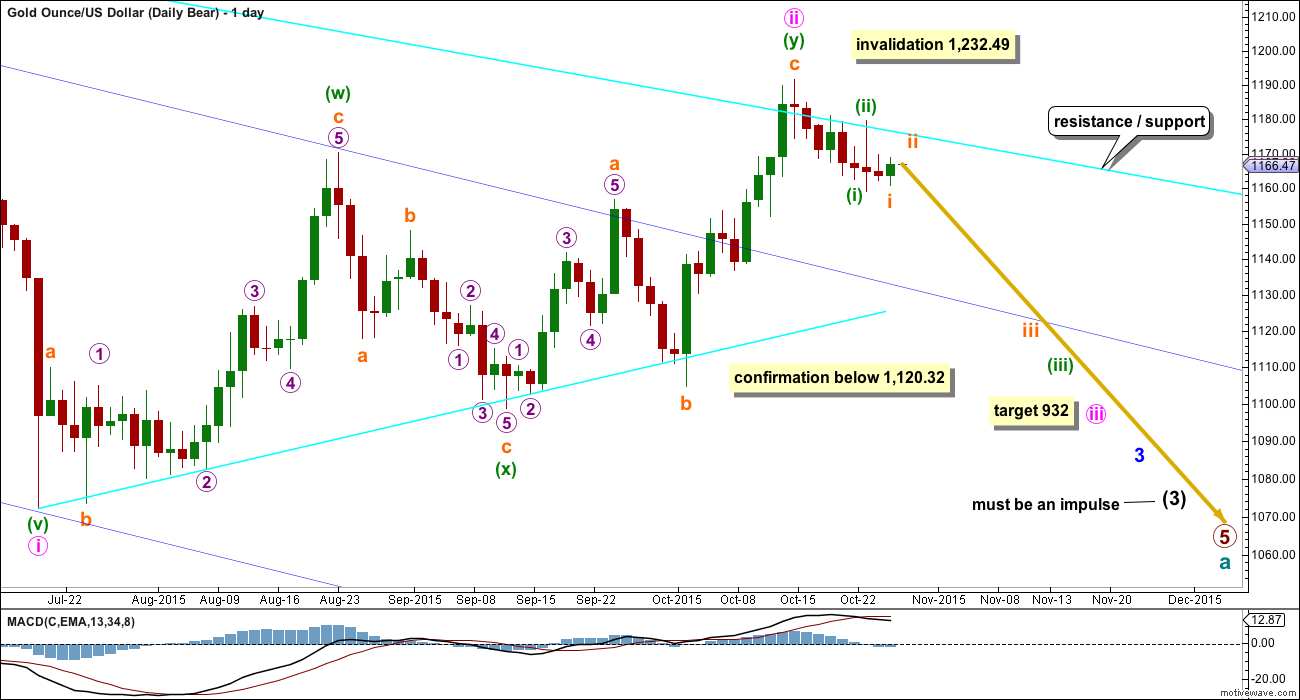
BEAR ELLIOTT WAVE COUNT
Click chart to enlarge.
The final line of resistance (bright aqua blue line copied over from weekly charts) is only overshot and not so far properly breached. While this line is not breached the bear wave count will remain possible. Simple is best, and the simplest method to confirm a trend change is a trend line. While price remains below this line, it must be accepted that Gold has been in a bear market since 2011 and we don’t have technical confirmation that the bear market has ended.
The most likely possibility is that minute wave ii is a complete double zigzag and deep at 0.75 the length of minute wave i for the bear wave count. It has breached the dark blue base channel drawn about minor waves 1 and 2, one degree higher. When a lower degree second wave correction does this it reduces the probability of the wave count but does not invalidate it. Base channels most often work to show where following corrections find support or resistance, but not always.
At 932 minute wave iii would reach 1.618 the length of minute wave i.
If minute wave ii were to continue further, it may not move beyond the start of minute wave i above 1,232.49. A new high above that price point would be final price invalidation of any bear wave count. That would fully eliminate the concept that Gold remains in a bear market. No bear wave count should be considered above that point.
The first hourly chart works in exactly the same way for this bear wave count, and that is the only reason why I am not publishing a separate chart for the bear. This bear wave count also expects a third wave to be unfolding downwards. The degree of labelling on the hourly chart would also be the same.
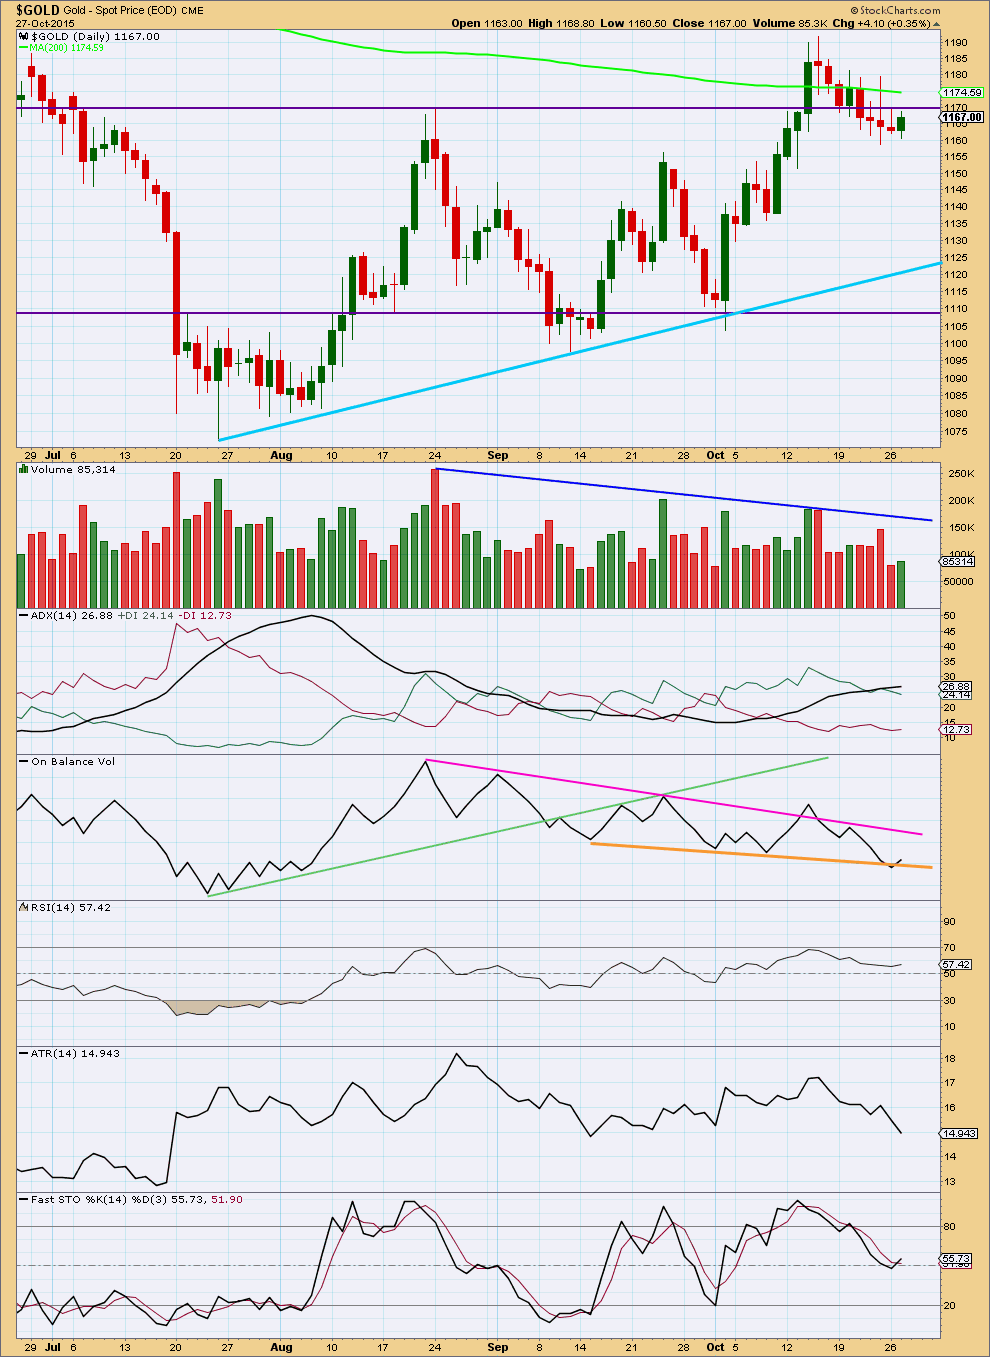
TECHNICAL ANALYSIS
Click chart to enlarge. Chart courtesy of StockCharts.com.
Daily: The technical analysis picture is unclear today for Gold. Volume indicates Gold is consolidating, ADX indicates Gold is trending, and ATR indicates Gold is consolidating. Because ADX is a lagging indicator, at this time I will choose to decide that on balance it looks like Gold is consolidating and the breakout of 14th October was false. The rest of this technical analysis rests on that assumption.
Price is finding resistance at the horizontal trend line now two days in a row. The strength of this line is reinforced. Both the last two daily candlesticks are small, both look corrective. Volume overall continues to decline. It is looking increasingly like the potential upwards breakout of 14th October was false and that the consolidation phase continues for Gold.
During this consolidation which began about 7th August it is still a downwards day which has strongest volume. This favours the bear Elliott wave count.
The black ADX line is pointing upwards and is above 20. With the +DX line above the -DX line the trend should be upwards. This may be a lagging indicator of the last upwards swing which overshot resistance.
ATR is declining indicating the range price is moving in continues to narrow. This is more typical of corrections than a trend.
Stochastics has returned from overbought but has not yet reached oversold. A range bound approach to this market would expect more downwards movement to continue until Stochastics reaches oversold and at the same time price reaches either the sloping light blue line or the lower horizontal line of support.
This analysis is published about 06:15 p.m. EST.
GDX weekly looks bearish. Chart by metalhead
What oil says lara..please give ur precious view..thnk u
It’s in a second wave correction I think. But I need to spend some time on the hourly chart before I’ll have confidence in that idea.
I may update Oil later today. I am concerned that the downwards move out of intermediate (2) looks like a three. I am concerned that intermediate (2) may be continuing as a double zigzag.
Updated chart and comment on US Oil post.
Lara is the 1,144 target still valid?
Or is gold already heading back to 1,171.
Gold is now at 1157
Gold is already a buy at 1,3, and 5 minute now at 3:11.
I think the retracement has begun up to 1,171.
Look at volume on the 5 minute chart, it declines sharply to the end of that move.
Chintan Karnani, chief market analyst at Insignia Consultants, had expected gold prices to fall if the Fed offered indications of a rate increase in December, but he also said that a”big crash will happen only if gold trades below $1,155 or gold does not break $1,191 after the FOMC.”
http://www.marketwatch.com/story/gold-futures-approach-highest-level-in-more-than-a-week-2015-10-28
The main wave count will be adjusted to see todays high the end of minute wave b.
This strong downwards move will be the start of minute wave c.
Target for this to end 1,144.
We’re currently seeing the end of a big price shock.
A strategy from Kaufman:
“A larger than normal move will more often be caused by market noise and will tend to be reversed. A stop loss in the event prices continue to move in the direction of the volatile bar. An exit at the end of the day.
…. adapt the method used by floor traders of watching the volume. While they actually listen to the level of screaming on the floor, the intraday volume can be a good substitute. Floor traders will buy on price moving higher as long as the floor noise was high or increasing. Once that noise started to fade, they exit the position, under the belief that whatever caused the excitement was over and price would pull back”
currently I can see a decline in volume at the 5 minute time frame, but not the hourly yet
I would expect most of this big downwards move to be reversed
and I would expect it to be ending soon because volume is declining
the retracement of this big move may end about 1,171, the 0.618 Fibonacci ratio.
Astrological call on metals is rckingg…
yes it is! were they thinking the crash was short term, or long term?
They say it should end on friday..lets c.
2:35 pm gold just invalidated hourly triangle below 1,160.85 dropped to 1154.50
Gold dropped $25 since 2:00 pm
So where do I sign up for this astrologist?
I’ve obviously been do this all wrong
Gold dropped $17.50 to 1,161.78 and stays above invalidation at 1,160.85 so far at 2:20 pm.
Gold falls, oil pares gains after Fed announcement – Oct 28, 2015 2:08 p.m. ET
http://www.marketwatch.com/story/gold-falls-oil-pares-gains-after-fed-announcement-2015-10-28
Text of FOMC decision – Oct 28, 2015 2:07 p.m. ET
Federal Reserve’s October statement on interest-rate policy
http://www.marketwatch.com/story/text-of-fomc-decision-2015-10-28
Lara, is it possible that Minuette 2 is a flat correction and that the first 2 bull counts and the Bear count are still viable? Huge reversal today after the high.
Yes. But I’m working on something that has a better look.
Just heard on Bloomberg TV, no rate hike yet…gold started dropping just before the announcement…miners turning down quickly…oil is looking shaky at the moment…is this a good place to short the miners?
It was exactly at 2:00 pm and gold hit 1179 then and already down to 1164 .
DUST went from 11.60 then to 13.70 now at 2:14 pm
Tham, what would be a clear downtrend for oil?
“I am waiting for it to show a clear downtrend before shorting it.”
Hi Davey.
I usually trade like what Lara recommends. Wait for price to hit a high then pullback (wave 1) and a backtest (wave 2). After wave 2 showing that it is indeed wave 2 and not a false alarm (which occurs when price shoots past the high), it is time to enter the trade. The same remarks apply for a price low, only in reverse. The stop can be placed just above the high (or low, whichever case it may be).
Tham, thank you, I have been following oil and always value your perspective.
Today US oil will gave huge reversal candle.
Is oil going higher from here????
Waiting for some update for oil from lara
I wouldn’t expect that at this stage, no.
I would expect this is a second wave correction for Oil.
Just an information…hard to believe…i hav subscribed for an astrological service..according to it..metals and energy will crash aftr 11.3 am…
Let us know how it works out????
Moon has changed its star at 11.3am nd vl chnage its sign at arnd 5pm today..so according to them smewher arnd 2.3 ther vl b a change in the trend which was since last 2days..!!!!!!
Is that the morning of November 3rd or today at 11:30 am EST that metals will crash?
I don’t text so not sure what you are saying?
It was for todays morning..time has passed lets c does anything happen near 2.3pm…
Will it be a rate hike.??!!!!!!.haha..
Thanks for sharing! will it be a short term crash (days), or are they saying it will be long term crash?(months)
Oil shoot up…is ther any change in daily counts..??
I don’t think so. It is most likely micro 2 of subminuette 3. I am waiting for it to show a clear downtrend before shorting it. It should be a lucrative trade because it would be a third of a third of a third. Probably waiting for the end of the Fed meeting to make its move.
Lara wave count is 1-1, 1-2 and was expecting iii to unfold here??
It may????
The second 1-2 has already passed.
This is the third 1-2.
I just asked it bcoz lara dint expected such a bounce…yaa im new to elliot counts..so i might have misunderstood it…
I didn’t expect a bounce that high, its breached the best fit channel I had drawn.
New video tonight due to invalidation and confirmation.
Daily Bear requires 1 full daily candlestick above upper trend line to be invalidated OR price to go above 1,232.49
“The final line of resistance (bright aqua blue line copied over from weekly charts) is only overshot and not so far properly breached. While this line is not breached the bear wave count will remain possible.”
What I understand from Lara’s post is that the bullish combination and expanded flat counts are both invalidated. Only the bull triangle remains. You are right for the bear count.
As I see it, minuette 1 for the triangle count is completed at 1183.04 as there is a 5-wave count. Minuette 2 should target 1168 thereabouts. Probably price is dragging its feet waiting for the Fed results.
Minuette 2 target $1,168 thanks Alan.
Of course FED 2 pm today has a say in that.
Besides FED 2 pm hike or no hike.
When will a new trend get established?
Could be when the Fed hikes?
To keep the bear and first two bull counts alive, we need to turn down soon today. Maybe Minuette 2 morphed into a flat? Anyone see that as a possibility?
First target of 1,220 maybe 1,256 – 1,261 HOURLY TRIANGLE confirmed above 1,179.50 and gold already at 1,182.21.
Looks like the hourly bull has been invalidated.
This is interesting: “The black ADX line is pointing upwards and is above 20. With the +DX line above the -DX line the trend should be upwards. This may be a lagging indicator of the last upwards swing which overshot resistance.”
Upward movement may be over?????
Gold is at 1171.
Today at 2 pm it will show the direction. UP/Down.
Mr gold at 1172..SCARING
Another great analysis. Thanks Lara.
You’re welcome, but it turned out to be no good, quite useless in fact.