An upwards correction was expected as likely to have begun, and this was confirmed when the small channel on the hourly chart was breached. Two targets were provided: 1,128 or 1,139. Price reached up to 1,141.
Summary: Next week both wave counts expect downwards movement. A new low short term below 1,131.44 would increase the probability that the next wave down has begun. The bear wave count expects the middle of a big third wave is beginning, short / mid term target 1,067. The bull wave count expects downwards movement to end about 1,098.85, but to remain valid this price point may not be breached for the bull. Next week may provide us with clarity as to which wave count is correct.
Changes to last analysis are bold.
To see the bigger picture on weekly charts click here.
BEAR ELLIOTT WAVE COUNT
Note: FXCM closed their data feed for the weekend while I was not logged in. I had hourly data cached, but not the daily data. Therefore, the candlestick for Friday I’ve reproduce it here. That is why it looks a little odd.
Gold has been in a bear market since September 2011. There has not yet been confirmation of a change from bear to bull, and so at this stage any bull wave count would be trying to pick a low which is not advised. Price remains below the 200 day moving average and below the blue trend line (copied over from the weekly chart). The bear market should be expected to be intact until we have technical confirmation of a big trend change.
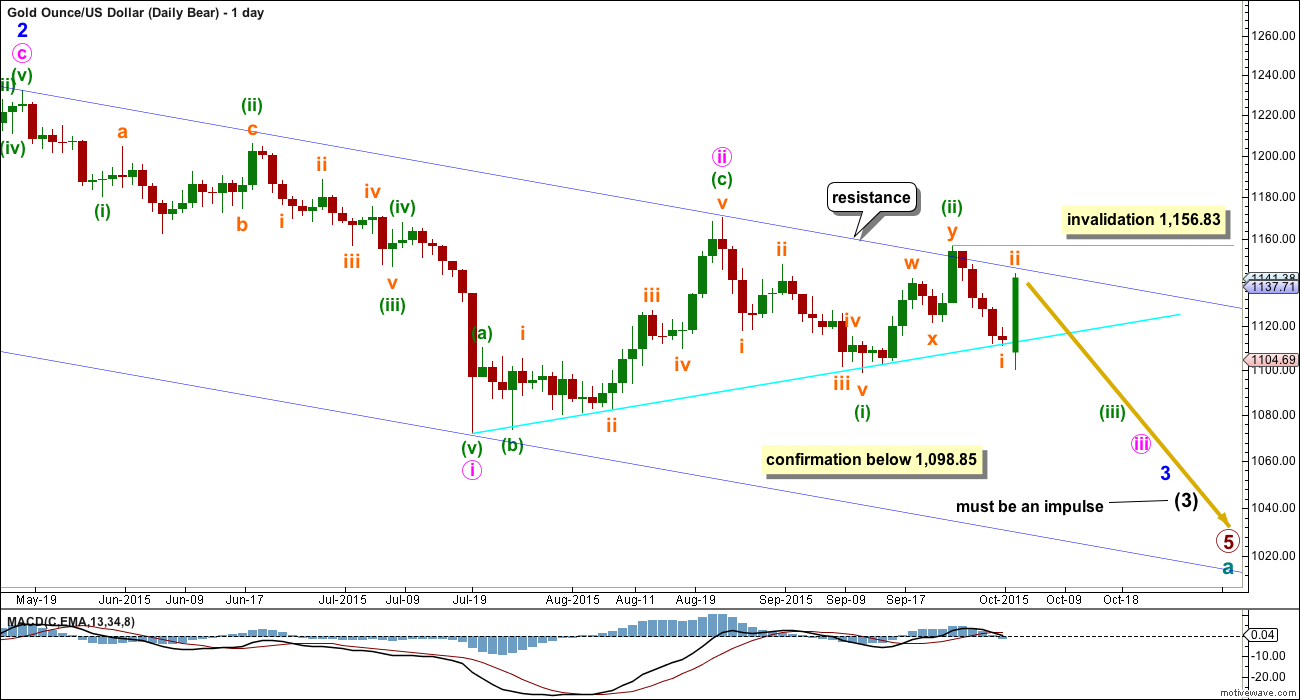
This wave count now sees a series of four overlapping first and second waves: intermediate waves (1) and (2), minor waves 1 and 2, minute waves i and ii, and now minuette waves (i) and (ii). Minute wave iii should show a strong increase in downwards momentum beyond that seen for minute wave i. If price moves higher, then it should find very strong resistance at the blue trend line. If that line is breached, then a bear wave count should be discarded.
The blue channel is drawn in the same way on both wave counts. The upper edge will be critical. Here the blue channel is a base channel drawn about minor waves 1 and 2. A lower degree second wave correction should not breach a base channel drawn about a first and second wave one or more degrees higher. If this blue line is breached by one full daily candlestick above it and not touching it, then this wave count will substantially reduce in probability.
To end the week, I am moving the invalidation point down. If subminuette wave ii continues any higher when markets open on Monday, then it may not move beyond the start of subminuette wave i above 1,156.83.
Downwards movement from 1,170.19 will subdivide as a complete five wave impulse on the hourly chart, but on the daily chart it does not have a clear five wave look. Subminuette wave iii has disproportionate second and fourth waves within it giving this movement a three wave look on the daily chart.
Minuette wave (ii) will subdivide as a double zigzag, but it has a five wave look on the daily chart, not a three. Both the wave down labelled minuette wave (i) and the wave up labelled minuette wave (ii) have a better fit and look for the bull wave count than the bear at the daily chart level.
Gold has the most textbook looking structures and waves of all the markets I have analysed over the years, probably due to the high volume of this global market. And so I am quite concerned with the look of minuette waves (i) and (ii). Sometimes Gold has movements which don’t look perfect on the daily chart, but this is uncommon.
Sometimes Gold’s impulse waves start out slowly. There is a good example on this daily chart for minute wave i. When the fifth wave approaches that is when momentum sharply increases, and it often ends on a price shock with a volume spike. This is an even more common tendency for Gold’s third wave impulses. The strongest downwards movement is ahead, and it should be expected to arrive when subminuette wave v within minuette wave (iii) begins.
This bear wave count expects Gold is within a third wave at five wave degrees. Expect any surprises to be to the downside for this wave count.
Within minuette wave (iii), subminuette wave ii now shows up very clearly on the daily chart. This was expected, and will give minuette wave (iii) the right look. Minuette wave (iii) may only subdivide as an impulse.
Full and final confirmation of this wave count would come now with a new low below 1,098.85.
I will remove the final target for primary wave 5 at this stage. If it were to reach only equality with primary wave 1 , then this wave count would end about 985. But it has begun with three big overlapping first and second waves, so the target no longer looks low enough. I will calculate a target for primary wave 5 to end at intermediate degree when intermediate waves (3) and (4) are complete. Primary wave 5 may not exhibit a Fibonacci ratio at primary degree.
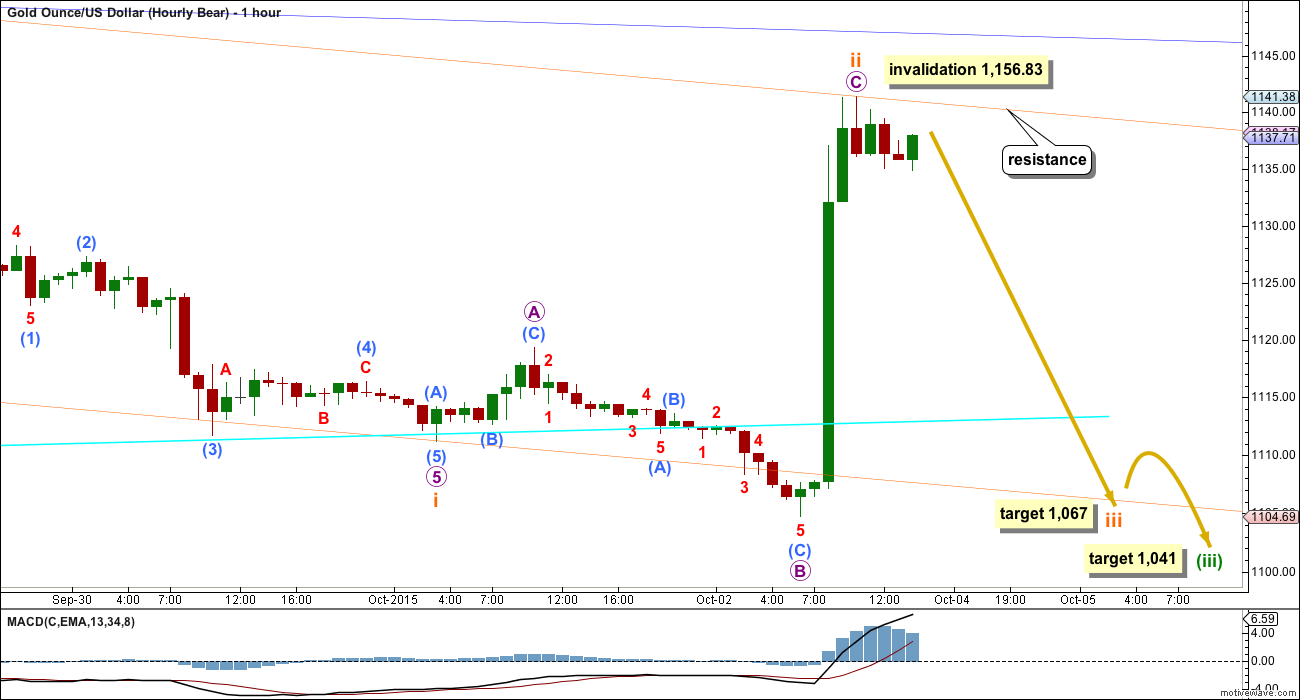
Subminuette wave ii subdivides as an expanded flat correction. Within the expanded flat, micro wave B is 1.79 the length of micro wave A, longer than the maximum common length of 1.38 but within the allowable convention of up to 2 times the length of micro wave A.
Micro wave C is 2.21 longer than 4.236 the length of micro wave A.
Draw a base channel about subminuette waves i and ii: draw the first trend line from the start of subminuette wave i (which is seen on the daily chart) to the end of subminuette wave ii, then place a parallel copy on the end of subminuette wave i. If subminuette wave ii is over, then corrections within subminuette wave iii should find resistance at the upper edge of the base channel. If that trend line is breached, it would be earliest indication that my labelling of subminuette wave ii as over is premature and may be continuing higher.
On the five minute chart, I can see the earliest possible start of the final fifth wave within micro wave C at 1,131.44. A new low below this price point may not be a second wave correction within the final fifth wave of micro wave C, and so at that stage the probability that micro wave C would be over would be increased.
The possibility that subminuette wave ii could continue higher will remain while price has not yet broken below 1,131.44. The invalidation point must remain at 1,156.83 for this reason.
At 1,067 subminuette wave iii would reach 1.618 the length of subminuette wave i. This target may be about eight or thirteen days away (eight more likely). Subminuette wave i lasted a Fiboancci five days and subminuette wave ii lasted a Fibonacci two days. If subminuette wave iii is extended in price, then it would also fairly likely be extended in time.
The next interruption to the trend may not be until the arrival of subminuette wave iv, after subminuette wave iii has completed.
Subminuette wave iii should have the power to break below the lower edge of the orange base channel. Along the way down price may again find some support at the bright aqua blue trend line. A breach of the base channel would be an early indication that the bear wave count may be more likely than the bull.
At 1,041 minuette wave (iii) would reach 1.618 the length of minuette wave (i). This target is still at least two weeks away, probably longer.
BULL ELLIOTT WAVE COUNT
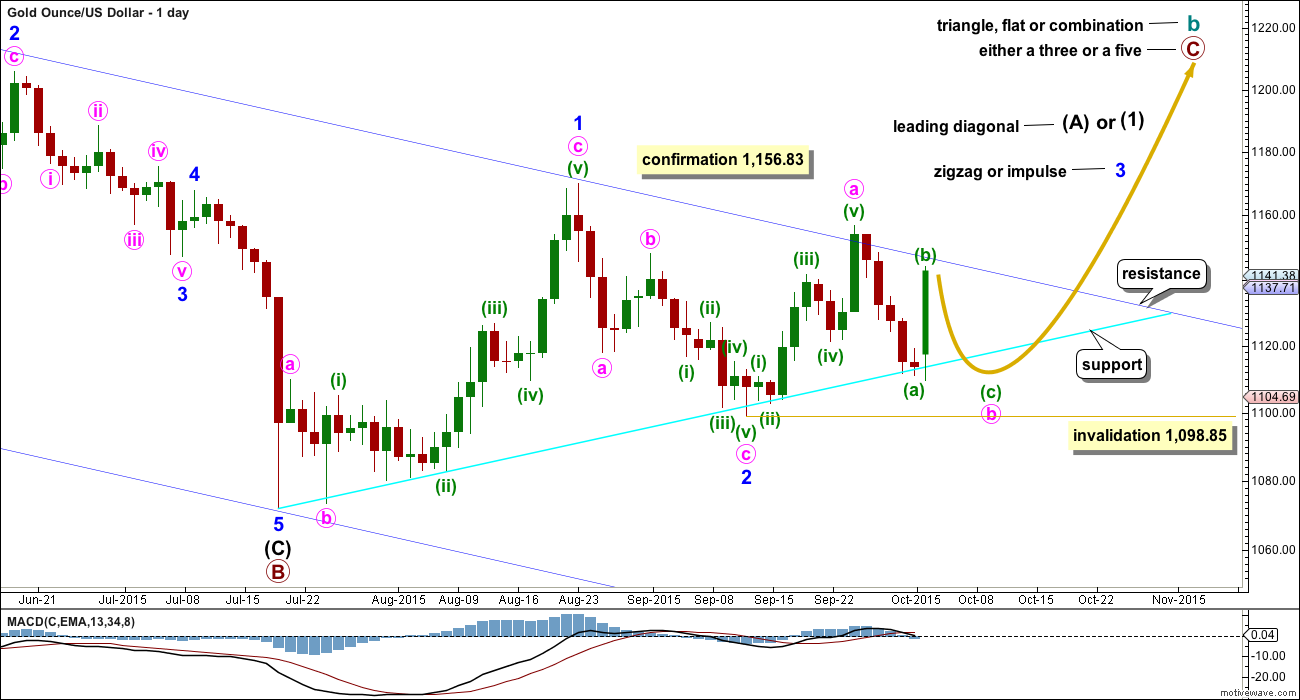
The bull wave count sees cycle wave a complete and cycle wave b underway as either an expanded flat, running triangle or combination. This daily chart works for all three ideas at the weekly chart level.
For all three ideas, a five up should unfold at the daily chart level for a movement at primary degree. This is so far incomplete. With the first wave up being a complete zigzag the only structure left now for intermediate wave (1) or (A) would be a leading diagonal. While leading diagonals are not rare they are not very common either. This reduces the probability of this bull wave count.
A leading diagonal requires the second and fourth waves to subdivide as zigzags. The first, third and fifth waves are most commonly zigzags, the but sometimes may appear to be impulses. So far minor wave 1 fits well as a zigzag.
To the upside, a new high above 1,156.83 would invalidate the bear wave count and provide strong confirmation for this bull wave count.
Upwards movement is finding resistance at the upper edge of the blue channel and may continue to do so. Use that trend line for resistance, and if it is breached, then expect a throwback to find support there.
Price has again come down to touch the bright aqua blue trend line and bounced up from here. If price continues any higher on Monday, then it should find very strong resistance at the upper dark blue trend line.
Minor wave 2 can now be seen as a complete zigzag. It is 0.73 the depth of minor wave 1, nicely within the normal range of between 0.66 to 0.81 for a second wave within a diagonal.
Third waves within leading diagonals are most commonly zigzags, but sometimes they may be impulses. Minor wave 3 should show some increase in upwards momentum beyond that seen for minor wave 1. Minor wave 3 must move above the end of minor wave 1 above 1,170.19. That would provide price confirmation of the bull wave count and invalidation of the bear.
There now looks like a five up on the daily chart within minor wave 3. This may be minute wave a within a zigzag, or it may also be minute wave i within an impulse. The five up is being followed by a three down which looks incomplete. Minute wave b may not move beyond the start of minute wave a below 1,098.85.
Because it is most likely that minute wave b will have a clear three wave look to it on the daily chart, I would expect that it is most likely not over yet. However, if the bear wave count is invalidated on Monday or Tuesday with a new high above 1,156.83, then I would consider the possibility that minute wave b was over at Friday’s low as a sharp zigzag. That would mean that the bull wave count would be confirmed and a third or C wave up within minor wave 3 would be underway.
What is more likely for this bull wave count though is minute wave b shall have a clear three wave look to it on the daily chart, so another wave down to end below the end of minuette wave (a) should unfold next week.
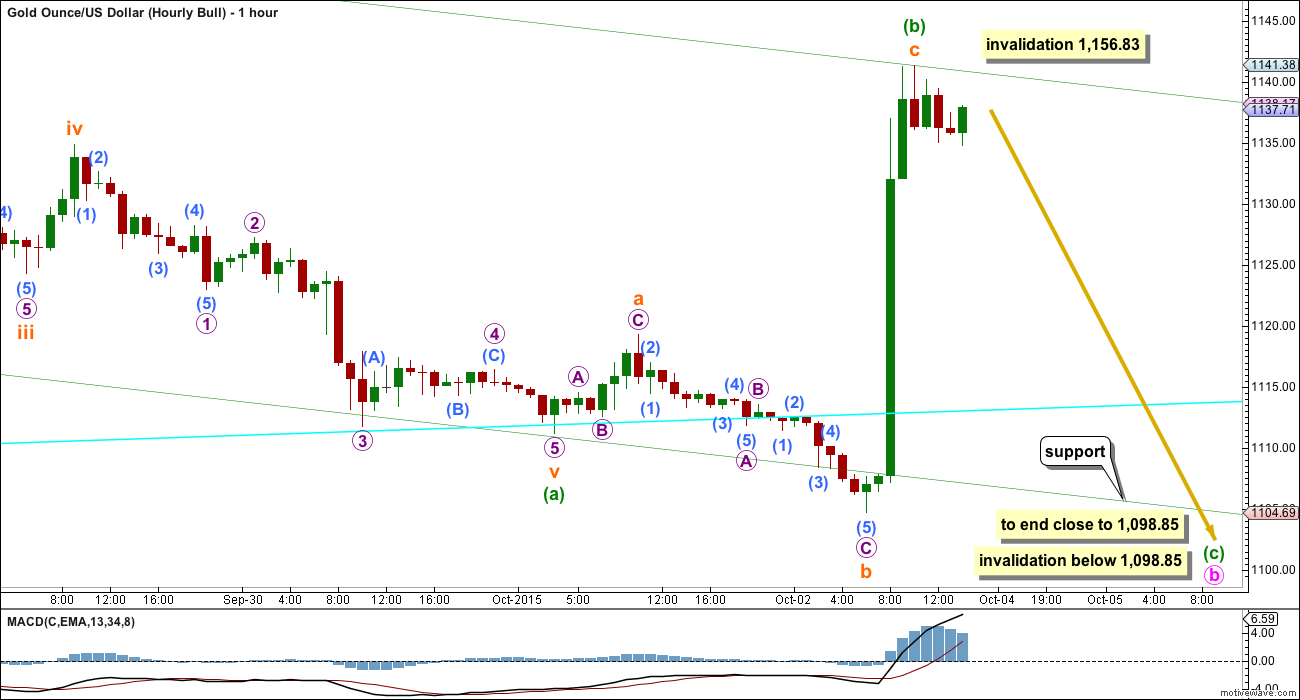
Minuette wave (a) subdivides as a five wave impulse. This now narrows the possible structures for minute wave b to a single or multiple zigzag. Within a zigzag, minuette wave (b) may not move beyond the start of minuette wave (a) above 1,156.83.
Minuette wave (b) would now be complete as an expanded flat correction.
There is no divergence between the two wave counts at the hourly chart level in terms of expected direction at this point, because A-B-C of a zigzag and 1-2-3 of an impulse have exactly the same subdivisions, 5-3-5.
About 1,098.85 minuette wave (c) would reach close to equality in length with minuette wave (a). Minute wave b may not move beyond the start of minute wave a below 1,098.85 for this bull wave count. How low the next wave goes may indicate which wave count is correct.
The green channel drawn here is drawn in the same way as the base channel on the bear hourly chart. Here it is termed a corrective channel. For this bull wave count, downwards movement should find support at the lower edge of this channel.
TECHNICAL ANALYSIS
Click chart to enlarge. Chart courtesy of StockCharts.com.
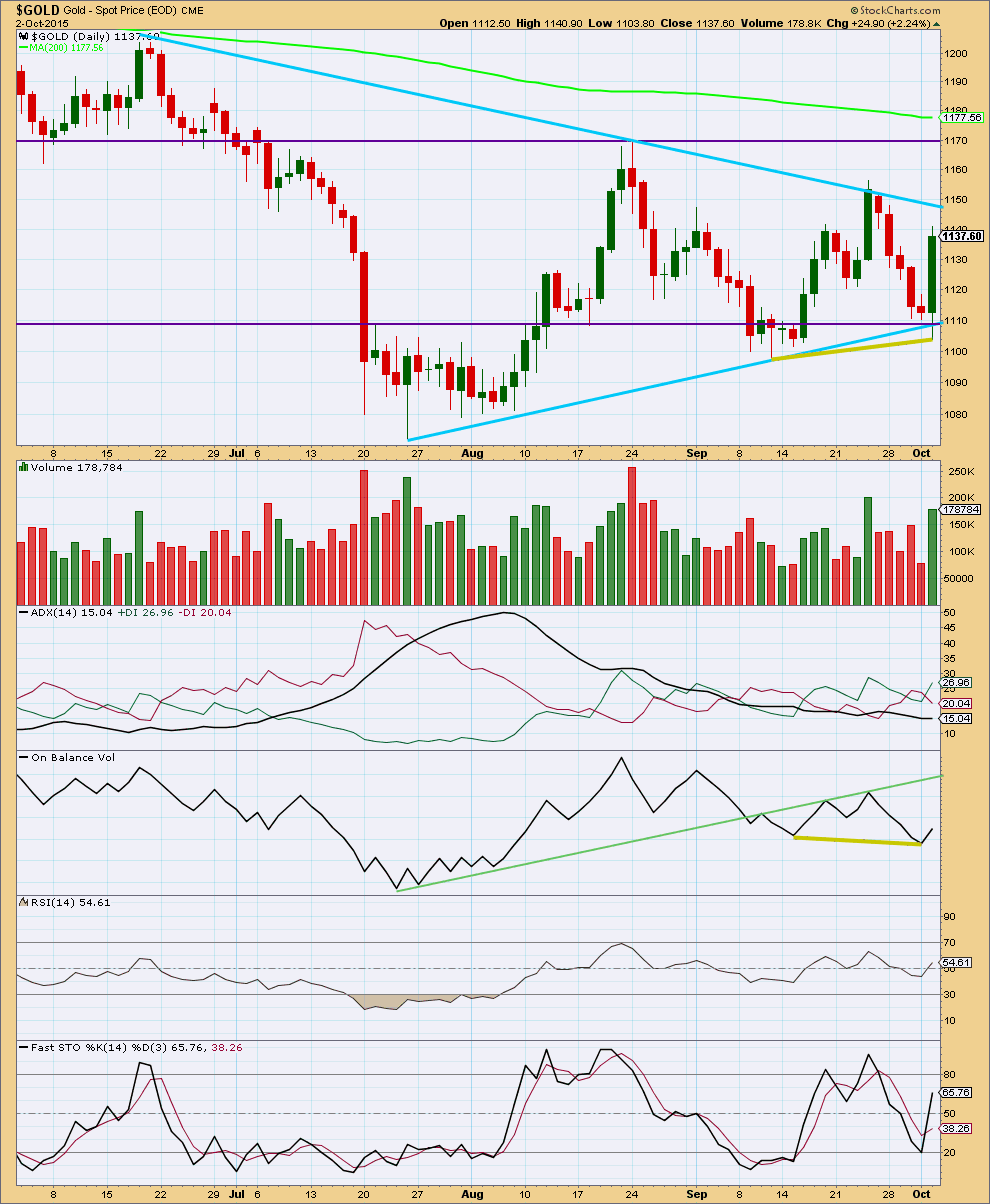
Daily: Today’s strong green candlestick comes on increased volume. Gold often exhibits a volume spike at the end of a movement. However, with volume supporting Friday’s rise in price is it also possible this may be the start of an upwards breakout.
The black ADX line is pointing downwards which indicates there is no clear trend to the market yet. ADX does tend to be a lagging indicator. ADX has been indicating no clear trend for almost every day since 7th August; Gold has been range bound now for some time. During this time, it is still a downwards day which shows strongest volume which indicates that a downwards breakout would be more likely than upwards.
It would be expected that during this consolidation price should find support at one or both of the upwards sloping aqua blue line or the horizontal purple line.
Overall, volume continues to decline as this consolidation continues. While price is being squashed between the sloping lines providing resistance and support the consolidation comes closer to maturity. The breakout is closer.
A range bound system is outlined here using lines on price for resistance and support in conjunction with Stochastics to indicate overbought / oversold. The downwards swing ended with Friday’s strong upwards move in price, but although price reached support Stochastics did not quite reach oversold. This is one illustration of why trading a range bound market is so risky. Here price should be expected to move higher until it finds resistance and at the same time Stochastics reaches overbought. A range bound approach to this market is in opposition to both Elliott wave counts today.
RSI at the daily chart level is neither overbought or oversold. There is room for the market to rise or fall.
There is some hidden bullish divergence to end this week between price and On Balanace Volume (olive green lines). While price made a higher low, OBV has made a lower low. This is a weak signal, but it does support a range bound approach. The risk to the Elliott wave counts here is that price may continue a little higher on Monday and may only end when it finds resistance at the upper sloping blue trend line.
Overall, at this stage, volume analysis indicates the bear wave count may be more likely than the bull.
This analysis is published about 10:28 p.m. EST.

This new high makes micro wave C look like a three.
I can’t publish a wave count that sees it as a completed five, that looks all wrong.
The only option really at this stage for the bear is subminuette wave i ended lower and subminuette ii is a zigzag.
I figure the same for the bull, this upwards movement would be a zigzag for minuette (b).
Lara does that mean the upward movement is not over yet for subminuette wave ii and minuette wave (b) before both the bull and bear wave counts continue much lower maybe in one more day? Or did they peak and end today?
For the bear it should be over. It’s so close to the dark blue trend line. Subminuette ii looks like a completed three.
I can see subminuette i over at the last low, that does fit. Sill to check Fib ratios there.
For the bull I’m looking at the structure on the daily chart and I am really struggling to see minute b continuing further. For the bull I would think it would more likely to be over at the last low at 1,105. Minute b would not have a clear three wave look on the daily chart, so not the most typical look, but at that low its a deep correction.
And with so many subdivisions within that last wave down it may be seen either as a five wave impulse or a three wave zigzag. Its impossible to tell which one for sure. So I’ll consider both.
And so now the bull and bear will diverge again: the bear expects a third wave down from here to a new target at 1,058. The bull a third wave up.
Short term differentiation point 1,104.69.
A CHANGE IN CHARACTER – Gary Savage Oct 2, 2015
http://blog.smartmoneytrackerpremium.com/2015/10/a-change-in-character.html
Says Gold bull rally may have already started.
Matt: Looks like Gold price has some more upside to go for a test yet again of 1140-41 and possibly break above there. Appears to be no compulsiuon yet for Gold price to drop below 1133-1131(10dma). Gold price hardly made it down to 1130 earlier today avoiding tagging below there for pivot…. DMI is up trending. Past the various 1140’s resistance there is overhead resistance at 1151 (dropping by about $2-3 a day)… Gold price is overbought (in my view overbought occurs when close is nearer the upper band than the lower band) and in my view would look to get more overbought before reversing…. Best to wait for an update from Lara…. Thanks. //// I am short and will look for opportunities to add on shorts. However, Gold price inability of late to look to convincingly break below 1100 remains a concern specially with a strong upside reversal from 1104-03 the other day. Good luck~! Thank you.
I would still argue that the chart damage (long term, medium term) has already been done to the case for higher prices. Bollinger bands also indicate to me that the direction is still down.
Friday was a heavy knee jerk reaction with very weak follow through today.
I believe that what we’re experiencing here in gold is a lot of whipsawing to shake money out of the weak hands on both sides.
Sure, I am all for the downside with upside risk past the upper band coming in at 1159-60 (20 week moving average which has not been breached since end May this year)… More power to the bears though a break below 1080-79 looks fairly distance for now. Gold price is still stuck in range 1080-1169 whipsawing around as you mention, testing everyones patience and really needs to get on with it one way or the other~! lol
Blue channel resistance comes in just above in the mid-1140s. That, combined with the fact that the corrective ratios would be too extreme (deep), lead me to believe that your target is too high.
We shall see. 🙂
Possible Retrace target 2nd wave up
1142.05 high at 9:48 am
– 1132.61 bottom 1st wave
= 9.44
x .618
= 5.834
+ 1132.61
= 1138.44 retrace target top of 2nd wave
Any comments?
On my charts gold reached 1138.5 at 1:29 pm, right on the upper trendline of the base channel, and falling since. Early days, but it looks like a good call at the moment. I hope you’re right (I am currently short), I am getting seasick with today’s ups and downs! Thanks
Gold just dropped $7 in 20 minutes by 10:29 am
Looks bearish to me with GDXJ lagging and gold volatility rising…I’m looking at puts in GDX…
I think Gold may have did a 5 wave count and may have peaked at 9:48 am at 1,142.05 ?
Any wave counts or comments on gold dropping from here?
for better or worse, I actually added to longs
Since DUST bottomed at 9:48 am I’m getting buy signals on DUST first 1 minute then 3 minute then 5 minute. Although the longer time frames are still down for DUST.
If gold did peak at 9:48 am and gradually drops then DUST may turn to a buy at longer time frames as well. I have a small amount of DUST.
I agree that gold just completed a 5 up and should overall begin to break down from here. However, first gold may retrace to the 1139-40 area again for a small 2nd wave of a larger downward move.
I was premature in adding longs earlier today but i don’t think that was a completed 5 up. it would have a 4th wave that was extremely large compared to the 2nd wave, which can barely be seen. I think that big movement up was a first wave and we are in a second wave that is either an incomplete expanded flat and needs to make a lower low, or is already done as a zig zag and we are in the beginning of a big third wave up.
Technical Trading: Gold Consolidates In Potential Triangle Pattern
Monday October 05, 2015 09:13
http://www.kitco.com/news/2015-10-05/Technical-Trading-Gold-Consolidates-In-Potential-Triangle-Pattern.html
Gold since Friday close, has hit a low of 1,130.21 at 7:19 am Monday on pmbull.com
“The possibility that subminuette wave ii could continue higher will remain while price has not yet broken below 1,131.44.”
Lara: “A new low short term below 1,131.44 would increase the probability that the next wave down has begun. ”
Gold is trending down and is at 1132. Plus COT report on Friday was bearish.
Just a View: IMHO with a high range close on Friday, Gold price is bullish basing off 1135-34, with 1131-30 seen as holding. Gold price has the upward momentum in its favor for a good upward move / rally to occur to test the various upside resistance / retrace-Fibo levels between range 114x-115x *takes a break above 1139*. Currently a drop below 1121-19 is not seen…. On weekly outlook basis, although Gold price is overbought, expecting further overbought levels with Gold price looking to rally which may be a good short selling opportunity…. Significantly Gold price has not yet been able to break below 1100 and put in an upside reversal on Friday from 1104-03 low possible short term bottoming here (earlier reversal came from 1098-97)…. Will remain to be seen, (once topping occurs) if Gold price can break below 1111-1110 let’s say below 1104-03…. Advantage Bulls ~ 🙂 //// Seems like breaking below 1100 has become a bit of an enigma for Gold price….
If there is any movement at all above the current high, I, as someone who is short, will immediately retreat. Gold has corrected 70% already, which is already too much. If that were to occur, then something else is forming here – not a bullish pattern, but some other kind of correction within a bear.
If gold breaks down now, like below 1131 as is suggested in the analysis above, I trust it will break down further.
I decided to hang in there and believe gold made a final small 5th wave up to complete the correction.
Lara, what do you make out of Gdx?
I’m surfing and studying this weekend.
We’ve had no surf for weeks and now the waves have come. I have to surf.
When the waves go I’ll look at GDX and post a chart at least.
Lara,
Great that you got to finally surf on the weekend after weeks of waiting for waves.
COT Data and Gold Price:
Time after time gold has moved along with commercial short position fluctuation.
Last Sunday’s post indicated Gold COT is bearish with increase in commercial shorts by 19348.
Gold dropped from previous Friday’s close at 1146.30 to low of 1111 on Friday morning.(Kudos)
Once again commercial shorts have increased to total 33594 for last two weeks. That is big!!!!!! bearish signal- Believe it or not!!!!
Once again it is a bearish COT report.
10/02 Commercial shorts 303,599, Spec long: 184,378; Gold :1137.60 (low1111) (+14246)
9/25 Commercial shorts 289,353, Spec long: 180,716; Gold close:1146.30 (+19348)
9/18 Commercial shorts 270,005, Spec long: 168,892; Gold close: 1139.00
COT data is in line with Lara’ EW hourly count. Can’t get any better.
Nice chart
Papudi, where do you get your COT data? Wondering why it doesn’t match the data in the chart I posted below. Thanks,
I get it from Goldseek.com or 321gold.com
http://news.goldseek.com/COT/1443814249.php
http://www.321gold.com/cot_gold.html
The difference lies in the futures only vs. the one i use is futures and options combined open interest.
Good to know. Thanks.
Options and futures vs. futures only probably.
I saw a lot of charts today talking about a GDX breakout. Maybe so, but the breakout ended at even stronger resistance. Volume was not impressive for the big move up.
GDXJ was not as strong as GDX today. Not a bullish sign for the miners.
Commercial shorts increased by 16,358