Downwards movement for the week was expected for US Oil.
Summary: Downwards movement is still expected, but a trend change is still not yet confirmed. It is important to wait for confirmation before having confidence in this wave count. A full daily candlestick below the lower edge of the blue channel and not touching the lower blue line is required. So far price is only overshooting the blue line. I am concerned that the fall in price for this last week comes on declining volume, although this volume profile was seen in parts of the last big drop in price for US Oil. The market can fall of its own weight and this may be happening again, but it illustrates why it is important to have confirmation before having confidence.
New updates to this analysis are in bold.
MONTHLY ELLIOTT WAVE COUNT
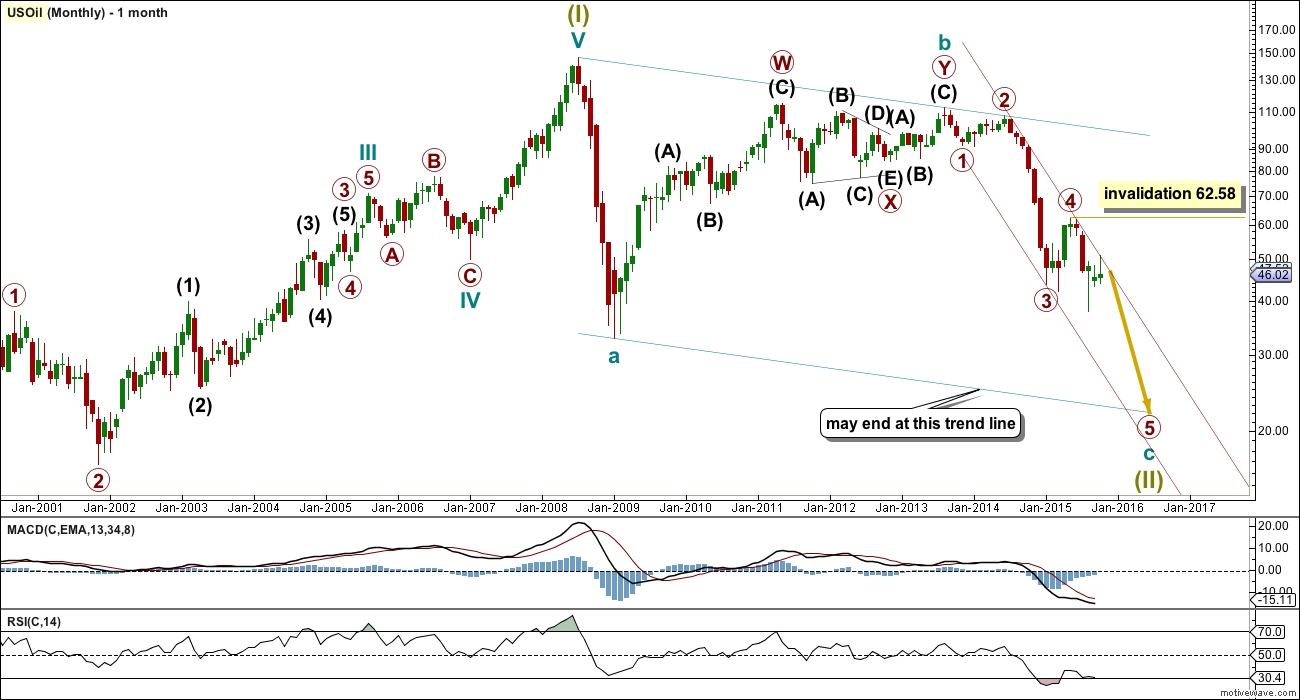
US Oil has been in a bear market since August 2013. While price remains below the upper edge of the maroon channel drawn here and below the 200 day simple moving average it must be accepted that the bear market most likely remains intact. I will not publish a bull wave count while this is the case and while there is no technical confirmation of a trend change from bear to bull.
The structure of cycle wave c is incomplete.
This wave count sees US Oil as within a big super cycle wave (II) zigzag. Cycle wave c is highly likely to move at least slightly below the end of cycle wave a at 32.70 to avoid a truncation. Cycle wave c may end when price touches the lower edge of the big teal channel about this zigzag.
It is just possible that cycle wave c could be complete at the last low of 37.75. However, that would see cycle wave c truncated by 5.05, which is a large truncation. I would consider this possibility only if it is confirmed with a clear breach of the maroon channel on the monthly chart.
Within cycle wave c, primary wave 5 is expected to be extended which is common for commodities.
Within primary wave 5, no second wave correction may move beyond its start above 62.58.
Draw a channel about this unfolding impulse downwards. Draw the first trend line from the highs labelled primary waves 2 and 4 then place a parallel copy on the end of primary wave 3. Next push up the upper trend line slightly to contain all of primary waves 3 and 4. Copy this channel over to the daily chart. The upper edge should provide resistance.
DAILY ELLIOTT WAVE COUNT
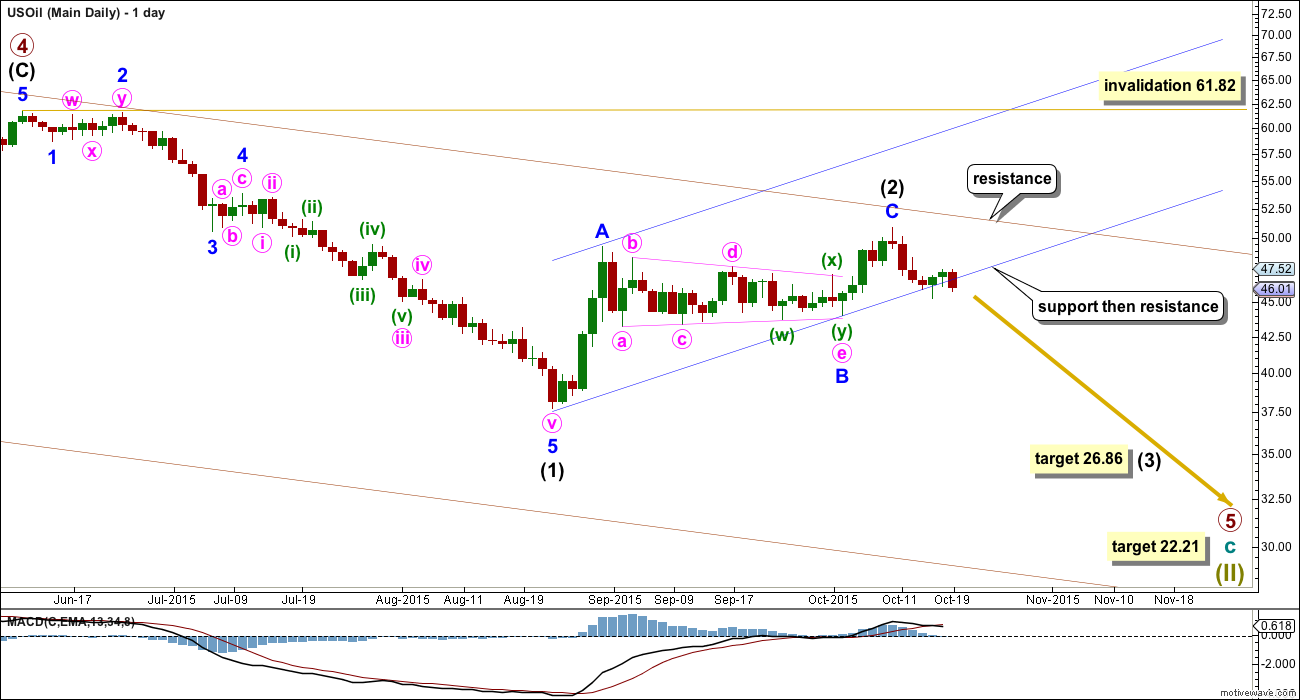
The intermediate degree corrections were brief and shallow within primary wave 3 down. Now, within primary wave 5, this correction for intermediate wave (2) is neither brief nor shallow.
Within the zigzag of intermediate wave (2), minor wave C is 0.21 short of 0.618 the length of minor wave A. Intermediate wave (2) has reached up almost to the 0.618 Fibonacci ratio of intermediate wave (1). It is very likely that it is over here.
If it continues any further, intermediate wave (2) is likely to find resistance at the upper edge of the maroon channel copied over from the monthly chart.
Intermediate wave (2) may not move beyond the start of intermediate wave (1) above 61.82.
Draw a channel about intermediate wave (2) using Elliott’s technique for a correction: draw the first trend line from the start of minor wave A to the end of minor wave B, then place a parallel copy on the end of minor wave A. At this stage, there is still no confirmation that intermediate wave (2) is complete. Only when there is a full daily candlestick below the lower edge of the channel and not touching that lower trend line would there be confirmation that the upwards wave is over and the next wave down has begun. While price remains within that channel the risk that upwards movement could continue will remain high and the invalidation point will remain at 61.82. The lower trend line is currently about where price is finding some support. This wave count expects that support to give way and price to break below the channel. Thereafter, it may provide resistance.
Look for a throwback to that trend line. If a throwback to the line ends at resistance, at the line, then the trend line strength is reinforced. When price behaves like that it provides a perfect opportunity to join a trend.
At 26.86 intermediate wave (3) would reach equality in length with intermediate wave (1).
TECHNICAL ANALYSIS
DAILY CHART

Click chart to enlarge. Chart courtesy of StockCharts.com.
Note: At the time of publication markets are still trading for the 19th. StockCharts data for this session is unavailable until after NY closes. This regular technical analysis covers sessions only up to 16th October.
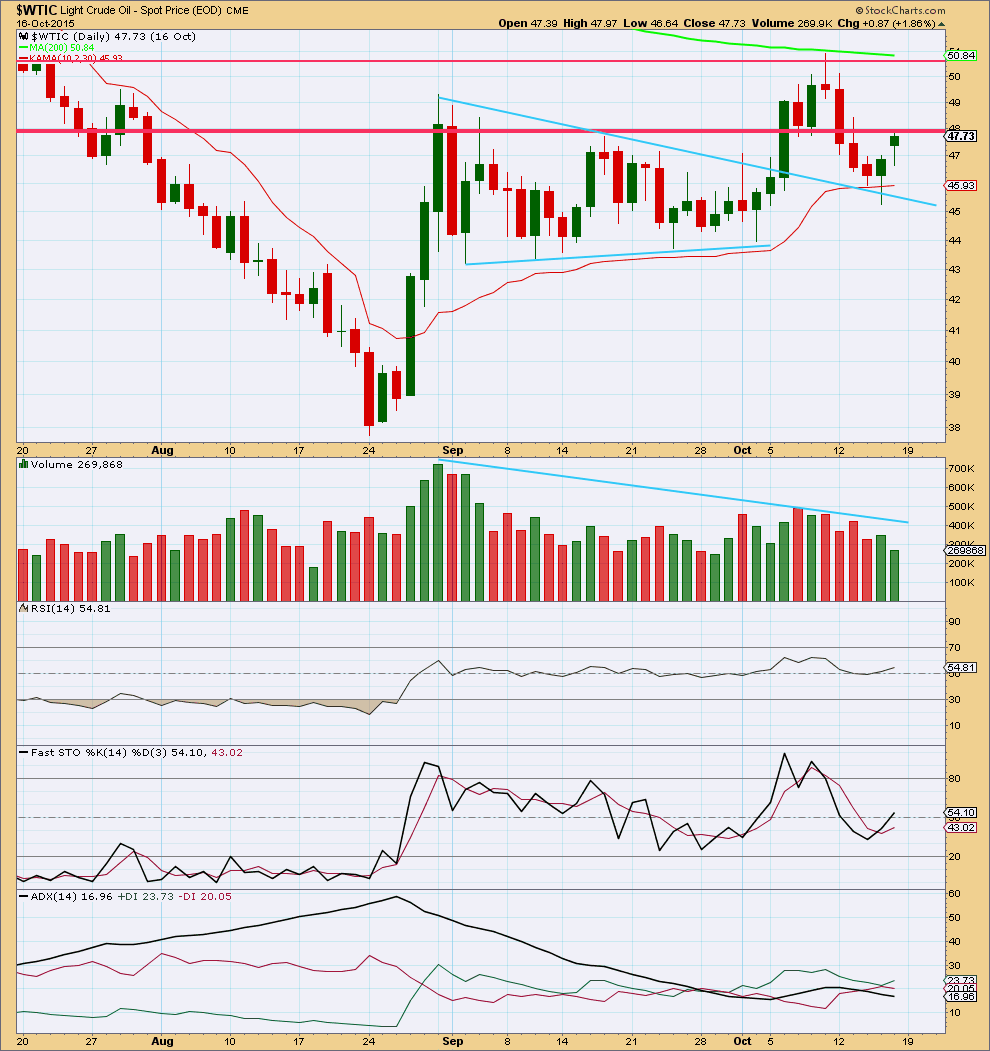
Volume overall continues to decline. The volume profile indicates US Oil remains within a consolidation. Price returned to below the lower red horizontal trend line, which is now again providing some resistance. If the Elliott wave count is correct, then this line should continue to provide resistance. A break above that line would indicate the Elliott wave count has prematurely labelled intermediate wave (2) as over.
ADX this week is declining indicating the market is range bound and not trending.
There still has not been a breakout from this consolidation. A downwards swing may be expected to continue until price finds support and Stochastics is oversold.
This analysis is published about 03:58 p.m. EST.


WTIC and line chart analysis: US Oil target 20.
Hi Lara,
Do you see anything new regarding the trend change?
Yes. Today we have a full daily candlestick below the lower edge of the blue channel and not touching it.
That is the confirmation I was waiting for to confirm US Oil has completed the correction upwards and the downwards trend has likely resumed.
I would now move the invalidation point on the daily chart to 50.93.
At this stage it looks like there may not be another throwback to the trend line, I think that happened yesterday. I would expect now it’s pretty likely US Oil is going to just keep on moving lower.
Draw a trend line from the high labelled intermediate (2) to the last small swing high on 19th October. Extend that line out. That may be useful at this time to show where upwards corrections may find resistance.
When markets are trending they often move along trend lines. If you can find a line which shows good support or resistance then each time price touches that line it may offer a good opportunity to join the trend. Stops can be set close, just beyond the line, because if the line is breached then the market is doing something else and the trend may be failing, i.e. your analysis is wrong.
Appreciate the follow-up
Thank you.
Lara,
What do you think of Oil’s performance today? Looks like its downward mobve has started. Any comments?
Today’s candlestick is a small doji below the lower trend line. It’s close to a break, but not quite.
I want to see a full daily candlestick below that line and not touching it before I have confidence the trend has changed.
The probability that the trend has changed is high, but it’s not confirmed yet. It may be tomorrow.
Once ADX for US Oil start trending watch for DWTI ADX also for entry. May not get the best lowest price but one can catch the impulse move up.
In the past how well ADX indicator worked pointing the start of impulse move up for DWTI.
Read more about ADX indicator here…..
http://stockcharts.com/school/doku.php?st=adx&id=chart_school:technical_indicators:average_directional_index_adx