Upwards movement was expected, but this is not what happened. Price moved lower.
However, there was no breach of the small channel on the hourly chart, so no confirmation of a trend change.
Summary: A final low to 1,132.80 (but not below 1,132.12) may complete this downwards movement. The trend channel on the hourly chart needs to be breached before any confidence that downwards movement is over may be had. When that is breached, then how high the next movement goes may indicate which wave count is correct. The bull wave counts expect new highs above 1,191.66 which would invalidate the bear.
To see weekly charts for bull and bear click here.
New updates to this analysis are in bold.
BULL ELLIOTT WAVE COUNT
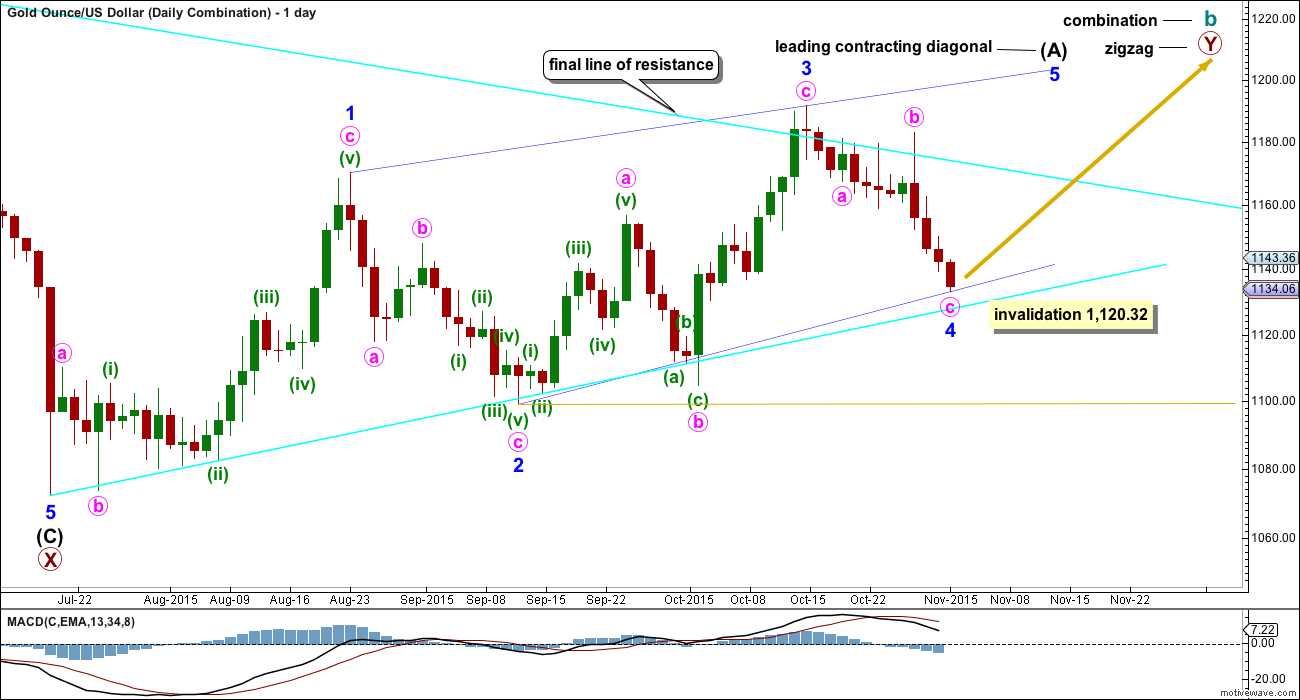
DAILY – COMBINATION
If cycle wave b is a combination, then the first structure in the double combination (or double flat) was an expanded flat. The double is joined by a three in the opposite direction labelled primary wave X which was a zigzag.
A five wave structure would be developing upwards for this wave count as a leading contracting diagonal. Because primary wave Y would be beginning with a five wave structure, this reduces the possible structures to a zigzag. Cycle wave b as a combination would be a flat – X – zigzag.
Minor wave 3 is a complete zigzag of a leading diagonal. Minor wave 3 is shorter than minor wave 1, so the diagonal would be contracting which is the most common type particularly for a leading diagonal. This limits minor wave 4 to no longer than equality in length with minor wave 2. Minor wave 4 may not move below 1,120.32.
The normal range for a fourth and second wave within a diagonal is between 0.66 to 0.81 the prior actionary wave. That gives a normal range for minor wave 4 from 1,130 to 1,116. Minor wave 4 must end at the upper edge of the normal range (or above) to remain above the invalidation point.
Look for price to find support at the lower bright aqua blue trend line.
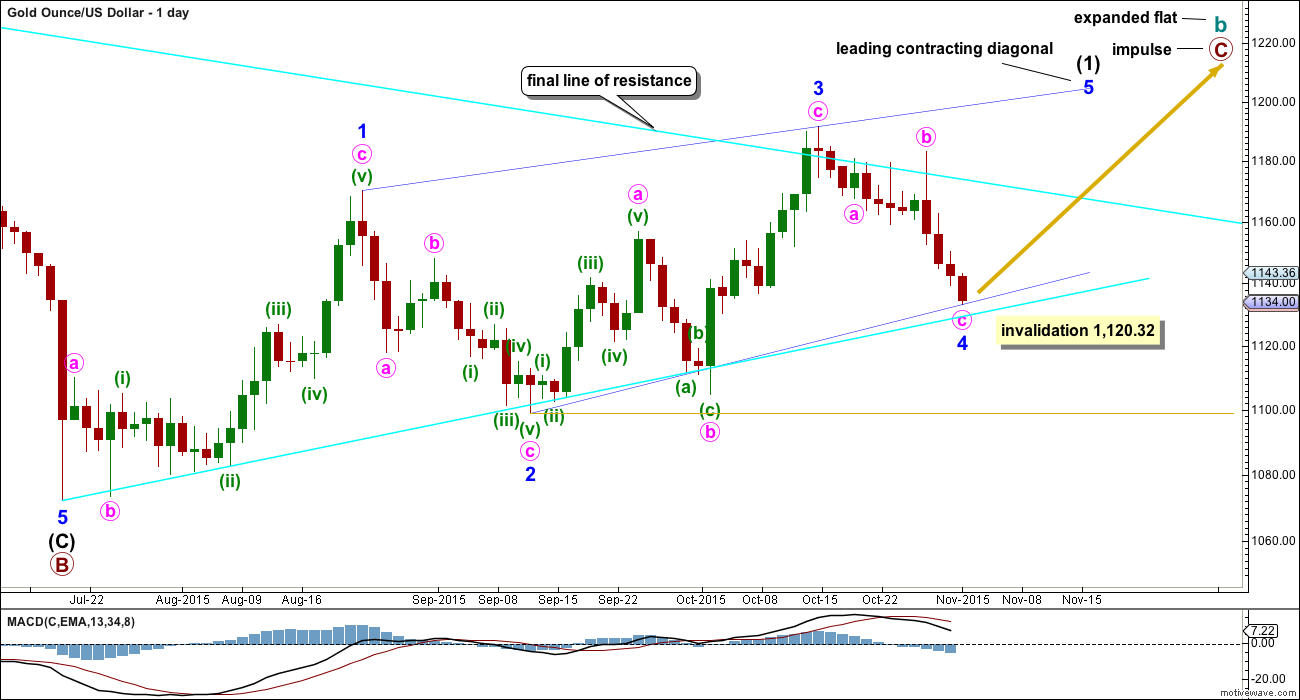
DAILY – EXPANDED FLAT
Cycle wave b may also be a flat.
If cycle wave b is an expanded flat, then primary wave C must be a five wave structure. The current upwards wave may be unfolding as a leading contracting diagonal, so this would be minor wave (1) within primary wave C.
There are two possible structures for a C wave within a flat correction: an impulse or an ending diagonal. If the first wave is a five and not a zigzag, then an ending diagonal may be ruled out because ending diagonals require all sub waves to be zigzags. Primary wave C may now only be an impulse.
A leading diagonal requires the second and fourth waves to subdivide as zigzags. The first, third and fifth waves are most commonly zigzags, but sometimes may appear to be impulses. So far minor waves 1 and 3 both fit well as zigzags.
Minor wave 2 is 0.73 the depth of minor wave 1, nicely within the normal range of between 0.66 to 0.81 for a second wave within a diagonal.
Minor wave 4 is now an almost complete zigzag. So far it is 0.63 the depth of minor wave 3, close to the normal range of 0.66 to 0.81.
The hourly chart below works for both these first two daily charts.
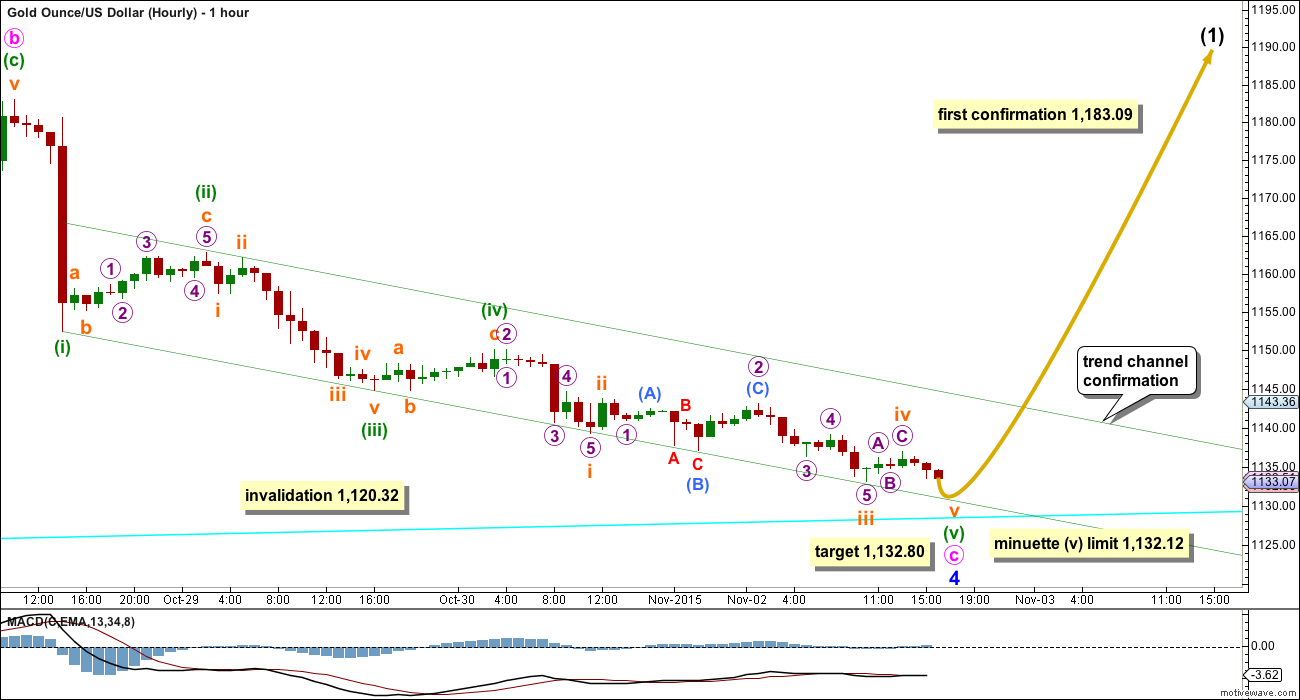
HOURLY CHART
Minute wave c is an almost complete five wave impulse.
The labelling of minuette waves (iii) and (iv) still looks to be correct. Minuette wave (iii) has the strongest downwards momentum, and the third wave within it for subminuette wave iii coincides with the strongest bars on the histogram within MACD.
Minuette wave (iii) was 0.92 short of 0.618 the length of minuette wave (i). Because minuette wave (iii) is shorter than minuette wave (i) and a third wave may not be the shortest, this limits minuette wave (v) to no longer than equality in length with minuette wave (iii) at 1,132.12.
Subminuette wave iii is 0.36 short of equality with subminuette wave i within minuette wave (v). At 1,132.80 subminuette wave v would reach 0.382 the length of subminuette wave i.
Draw a channel about minute wave c using Elliott’s technique: draw the first trend line from the ends of minuette waves (i) to (iii), then place a parallel copy on the end of minuette wave (ii). So far the lower edge is nicely showing where downwards movement is finding support.
When the upper edge of this channel is breached by upwards movement, then it shall confirm a trend change.
A new high above 1,183.09 would invalidate the bear wave count at the hourly chart level and provide first confirmation of this bull wave count.
The limit for minor wave 5 may again be calculated when the end of minor wave 4 is known. Minor wave 5 must move above the end of minor wave 3 at 1,191.66 because the fifth wave of a leading diagonal may not be truncated. Minor wave 5 may begin within the next 24 hours most likely and should last a Fibonacci 13 days in total. It may not be longer than 92.81.
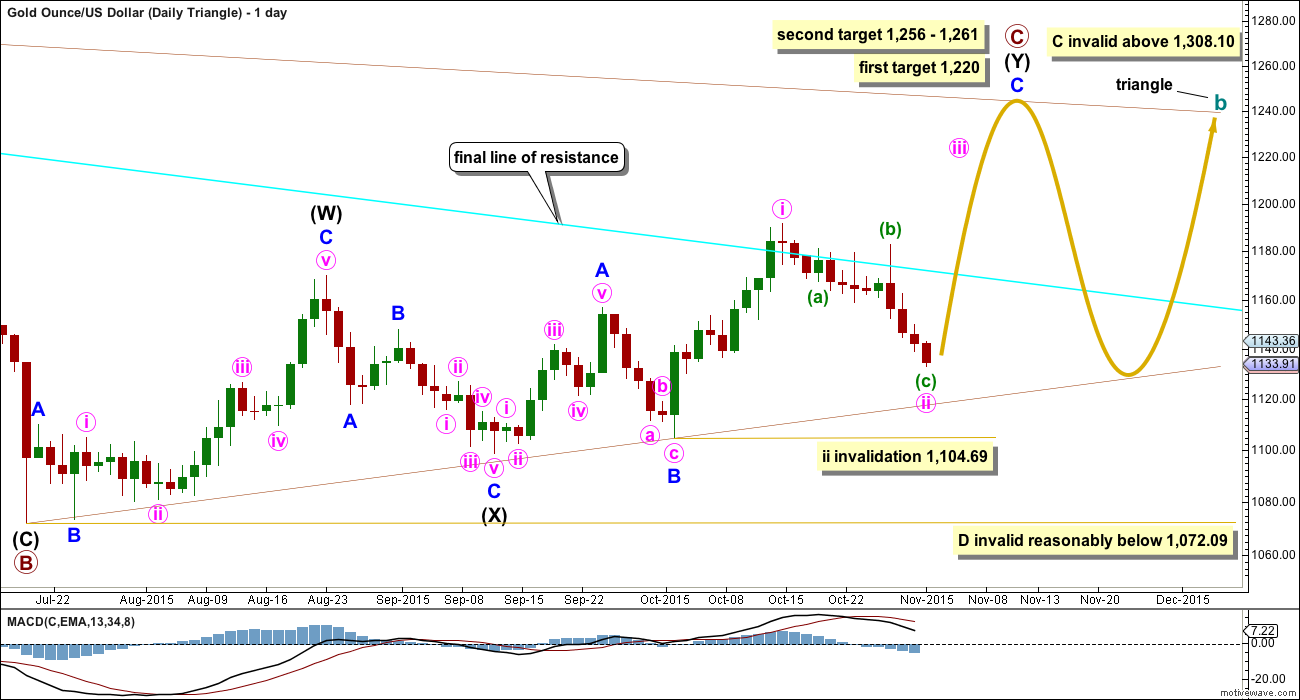
DAILY – TRIANGLE
This daily chart looks at what a triangle would look like for cycle wave b. The triangle would be a running contracting or barrier triangle. Within the triangle, primary wave C up must be a single or multiple zigzag. Primary wave C may not move beyond the end of primary wave A above 1,308.10.
Primary wave C may also be a single zigzag with a leading contracting diagonal unfolding for intermediate wave (A). That idea would look exactly the same as the daily combination chart. If a leading contracting diagonal completes in the next week or two, then that is how this triangle idea would be labelled also. For now I will consider the double zigzag idea to consider all possibilities.
This idea slightly diverges from the other two ideas for cycle wave b as an expanded flat or combination.
If a triangle is unfolding, then at the weekly chart level primary wave C looks unlikely to be complete and should move higher for the triangle to have the right look. This wave count sees upwards movement as incomplete for minor wave C. At 1,220 primary wave C end close to 0.618 the length of primary wave B. One of the five sub waves of a triangle is commonly about 0.618 the length of its predecessor.
The second target at 1,256 is where minor wave C would reach 2.618 the length of minor wave A, and at 1,261 primary wave C would reach 0.8 the length of primary wave A.
For the triangle idea, for cycle wave b, a five wave impulsive structure only needs to complete upwards. The next wave down for primary wave D should be fairly time consuming, lasting about 2 to 6 months. Primary wave D may not move beyond the end of primary wave B at 1,072.09 for a contracting triangle. Alternatively, primary wave D may end about the same level as primary wave B at 1,072.09 for a barrier triangle, as long as the B-D trend line remains essentially flat. In practice this means primary wave D can end slightly below 1,072.09 and this wave count remains valid. This is the only Elliott wave rule which is not black and white.
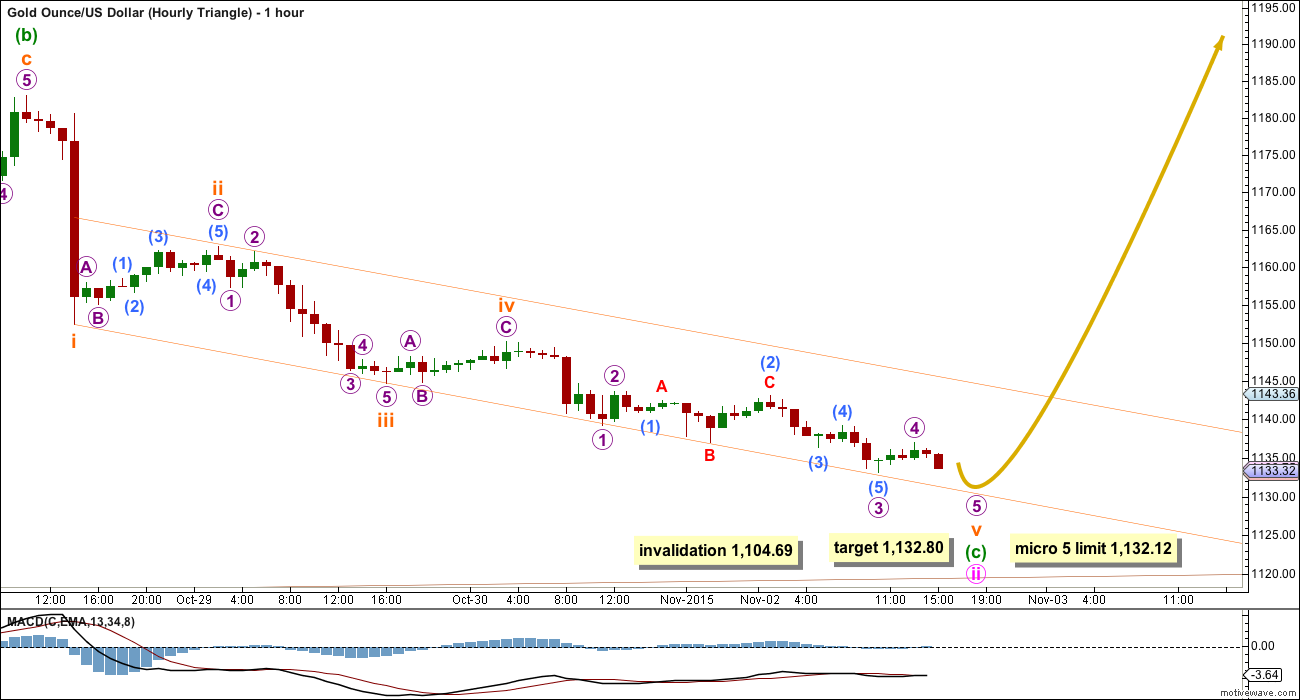
HOURLY – TRIANGLE
The subdivisions within this zigzag are still exactly the same as the first hourly wave count. The degree of labelling is one lower.
As for the first hourly wave count, this idea too also requires a breach of the channel before any confidence may be had that downwards movement is over for now.
If the next wave up is a third wave and not a fifth wave of a leading diagonal, then it should show an increase in upwards momentum and it must subdivide as an impulse.
The structure of the next wave up, momentum, and how high it goes may indicate which wave count is correct.
BEAR ELLIOTT WAVE COUNT
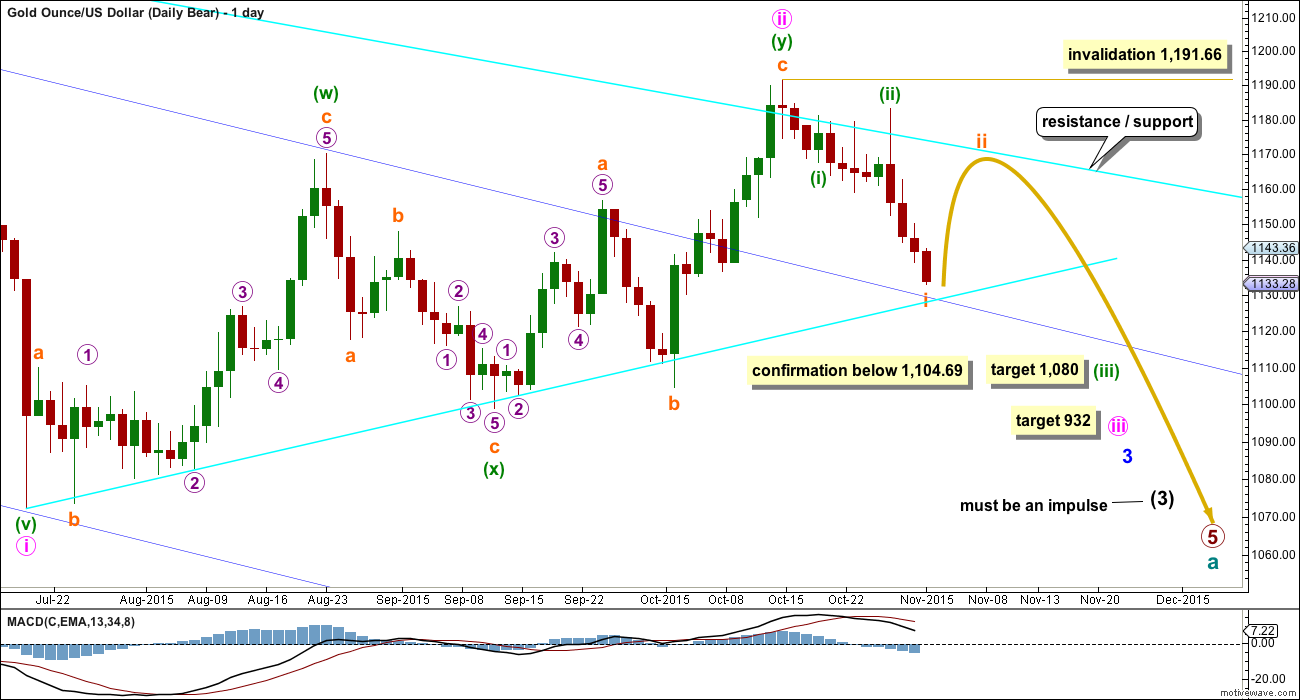
The final line of resistance (bright aqua blue line copied over from weekly charts) is only overshot and not so far properly breached. While this line is not breached the bear wave count will remain possible. Simple is best, and the simplest method to confirm a trend change is a trend line. While price remains below this line, it must be accepted that Gold has been in a bear market since 2011 and we don’t have technical confirmation that the bear market has ended.
The most likely possibility is that minute wave ii is a complete double zigzag and deep at 0.75 the length of minute wave i for the bear wave count. It has breached the dark blue base channel drawn about minor waves 1 and 2, one degree higher. When a lower degree second wave correction does this it reduces the probability of the wave count but does not invalidate it. Base channels most often work to show where following corrections find support or resistance, but not always.
At 932 minute wave iii would reach 1.618 the length of minute wave i.
A new high above 1,191.66 would necessarily come with a clear breach of the bear market trend line, and so at that stage a bear wave count should be discarded. Within minute wave iii, no second wave correction may move beyond its start above 1,191.66.
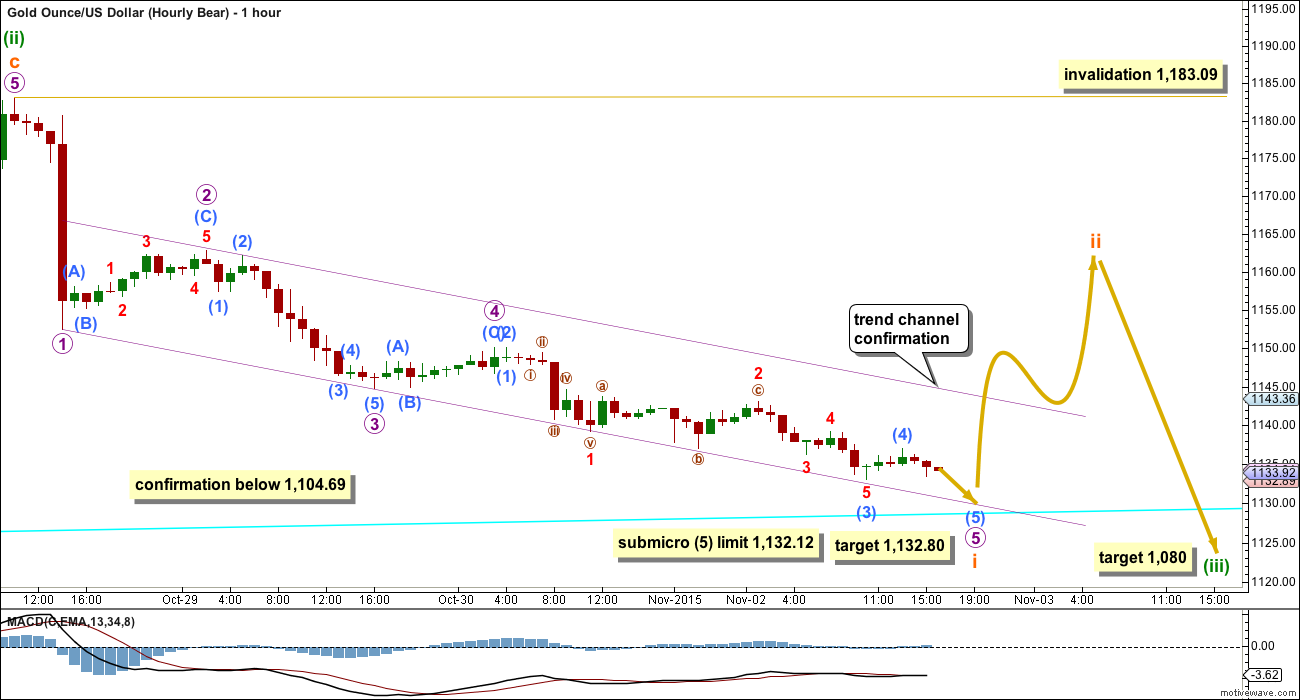
Although the subdivisions at the hourly chart level are the same for all wave counts, I will provide a separate hourly chart for this bear wave count to avoid any confusion. At this stage, it does not mean I consider this wave count to have a higher probability because I do not, but I do wish to stress it is entirely technically possible and we do not have technical confirmation that Gold has changed from bear to bull. All wave counts should be considered while the situation remains unclear for Gold.
Gold often exhibits swift strong fifth waves, particularly its fifth waves within its third waves. When price moves towards subminuette wave v of minuette wave (iii) it may be explosive. For this wave count look out for surprises to be to the downside.
At 1,080 minuette wave (iii) would reach 4.236 the length of minuette wave (i).
HOURLY CHART
The target for downwards movement is the same as is the limit for this fifth wave. The channel is also the same and should be used in the same way.
When subminuette wave i is a complete five wave impulse, then subminuette wave ii should unfold over one to three days with choppy overlapping upwards movement. It may find resistance again at the final line of resistance shown on the daily chart. It may not move beyond the start of subminuette wave i above 1,183.09.
When subminuette wave i is complete, then a Fibonacci retracement may be drawn on its length. Subminuette wave ii may correct to either the 0.382 or 0.618 Fibonacci ratios of subminuette wave i.
TECHNICAL ANALYSIS
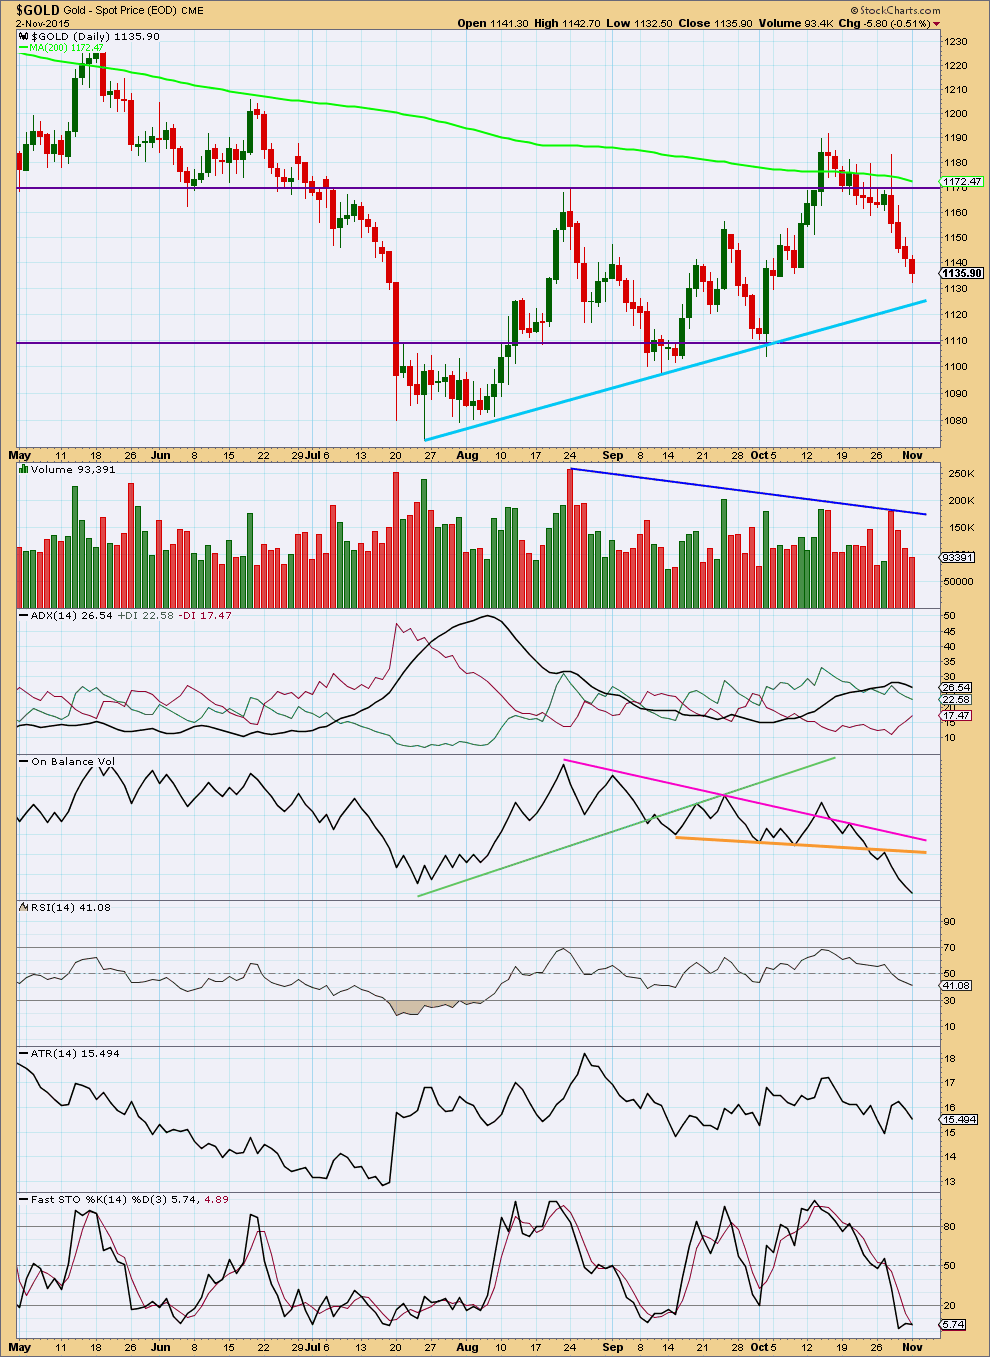
Click chart to enlarge. Chart courtesy of StockCharts.com.
Daily: Downwards movement for four days in a row comes with clearly declining volume. The fall in price is not supported by volume, so is suspicious. This looks like a correction within a trend, not a new downwards trend. However, price can fall of its own weight: an absence of buyers will push price lower and does not need an increase in sellers.
Today ADX no longer indicates an upwards trend is in place, the black ADX line is pointing downwards. This may be indication of a correction within a trend.
ATR is also pointing lower. Both ATR and ADX today indicate there is no clear trend at this time.
With a narrowing range, lack of volume, and declining momentum for this downwards movement, it does look like it should end here or very soon. This move down is weak.
On Balance Volume is bearish. The break below the short orange trend line is bearish, and the downwards trend of OBV while price made the last swing high is also bearish.
The potential upwards breakout of 14th October still looks false. Price has returned to within the consolidation zone. A range bound trading system may expect price to keep moving lower from here until it finds support. That approach conflicts with the Elliott wave counts today, and conflicts with volume and momentum analysis. But range bound price movements rarely move in straight lines; price tends to whipsaw about a mean and moves in choppy overlapping waves. Some upwards movement could certainly unfold about here and a range bound system needs to encompass that.
The last big move down for price from 1,232 in May 2015, to 1,072 in July 2015, began with downwards movement of price on declining volume. It was not until the end of the movement that volume supported price. The current decline in volume is a warning to be cautious about the bear wave count, but because price can and does fall of its own weight it most certainly does not indicate the bear wave count is wrong. The bear wave count may still be correct, and we may not see volume support price until price breaks out of this consolidation zone, below the lower horizontal support line.
This analysis is published about 05:22 p.m. EST.

At this rate, should Gold price begin to coast below 1114 opens up downside 1106… Upside already looks limiting to under 1120-22 and a hard to seek 1130….A break below 1101 looks imminent.
$ASTROLOGY$
GOLD CRUTIAL SUPPORT IS BROKEN,BUT SELLING IS NOT ADVISED
sushil
What time frame is the Astrology?
Daily, hourly, live or what?
Richard
They have their own astro indicators..its mainly on planetory movement and some technicals i guess…
Do you use a telescope, or software or a Quiji board?
The only option for the bull wave count now is the triangle.
The bear wave count is still valid.
With price now below the aqua blue trend line if this has happened with a volume spike then it would look like a downwards breakout out of consolidation. And that would strongly favour the bear wave count.
I will have to get this analysis out early today, and it will necessarily be done before StockCharts volume data is finalised (usually about 6:30pm EST). So I’ll update the volume analysis when I am able to late in the evening EST. Will give guidance to either event; low or high volume for today.
The leading contracting diagonal is invalidated.
For the bear, expect surprises to be to the downside. Its getting near the middle of a third wave. It still needs a second wave bounce for subminuette ii, and that should last about 3 days, but it won’t be indicated until that trend channel on the hourly chart is breached.
Gold does tend to usually work with trend channels pretty well. So use that channel to indicate when this downwards move is over.
As soon as I’ve had enough time on the 5 minute and hourly charts to look at the structure of this impulse I’ll post a target / expectation for it. For now, while price is in that channel and the bear is very much alive expect it to keep going for a bit at least.
Lara: I know that you’re busy now, so no need for an immediate reply. Alternatively, perhaps my question here could be addressed somehow in today’s analysis.
My question is why the bear count would not be expecting a shallow 4th wave at this time (or soon)? Instead you keep going with the 1-2, 1-2 idea.
Thanks!
Because the middle of the third wave has not yet passed. It’s not ready to move into fourth waves yet. The middle of the third wave hasn’t passed because it hasn’t moved below the end of minute wave i at 1,072.09.
On the hourly chart I can again see a completed five wave impulse downwards, and subminuette wave i still needs to end then subminuette ii has not yet shown up.
It looks like Gold has done it’s typical thing of a swift strong fifth wave to end an impulse.
The bear needs subminuette i to end and subminuette ii to unfold up / sideways.
Because the aqua blue trend line has been breached it may now provide resistance. That would make subminuette ii really shallow, about .236
Actually, your idea may be correct. I do think it’s got a low probability though.
We know that minute iii can’t be over yet, it hasn’t moved below the end of minute i.
Minuette (iii) could be over though, and it may be that minuette (v) will be very swift, strong and extended. That could be a really long fifth wave to complete the impulse for minute iii, long and deep enough to take price low enough to allow room for subsequent movement for minute iv which can’t move back into minute i price territory above 1,072.
If the bear gets confirmation with a new low below 1,104 then I’ll have two wave counts for it; the first a series of overlapping 1-2 waves, the second with minuette (iii) complete.
Really only because of the short length of this downwards move so far I think that minuette (iii) is incomplete.
Indicated volume is showing a modest increase. True volume we’ll have to wait for stockcharts I suppose…
Gold just crashed to 1118.07 at 12:06 pm EST and dropping already below 1120.32 invalidation point.
Bull – combination and expanded flat are both invalidated only leaving 2 wave counts the bull triangle and the bear wave counts are still valid.
Gold is close to, or at, the trendline supporting the run up from the July low. No matter what your longer term views are, this is a reasonable point for a bounce.
Instead of the word point, I should probably say zone or area. Gold can certainly trickle down a little further.
Glad to hear it! Haven’t been in any trades for quite some time now while watching the craziness. Went long a little early w/ GG yesterday, rather small position. Hope to have a decent bounce and will add with confirmation 🙂
http://www.pmbull.com
daily time frame shows gold right now just hit at the support trendline for uptrend since July 20th.
This is what you are speaking about.
Fed’s Jawboning Hammers Gold, Flattens Miners
Bullion breakout broken?
Nov 2, 2015 Brad Zigler | The Market’s Measure
http://wealthmanagement.com/etfs/fed-s-jawboning-hammers-gold-flattens-miners
Gold price is dropping nicely towards the 1120 low that I mentioned yesterday. Bought DUST yesterday at 15.40 and is now slowly bailing out. Made some good profits along the way. Preparing to go in long soon.
The low reached 1117.63, not far from the value of 1117.38 that I proposed yesterday.
The drop should now be over. I counted five waves down. Moreover, my DUST target was 17.11 which was nearly reached.
I’m off to the longs, NUGT in particular.
Targets : 38.73 (most probable), 46.73 (if 1191.64 is breached), followed by 51.79.
The drop is not over yet. The 5th wave extended. It is now eyeing my secondary target of 1114.61.
Again an update…i hope gold rally
$ASTROLOGY$
We are witnessing an opposite trend..Macho mars and mysterious rahu playing ther game..We are not happy to say that these conjucntion is expecting a bad geopolitical news,Stops are mandatory in these market,place your stops below 1120,In any case we are positive on gold
I sold the little GDX I had today. I’m not sure how gold will behave now. Gold is much weaker than Monday. I’m not confident in GDX or gold now.
Would you say Bear count wins out now. That’s it gold continues in bear trend.
It did not reverse and going down.
May be ADX will confirm the bear count soon.
Once gold goes below 1120.32 then combination bull and regular bull is gone however triangle bull is valid until 1104.69 and so is the bear wave count.
you R correct. All are alive and well currently. Thanks.
What is the significance, if any, of the break below the lower bright aqua blue trend line?
Lara wrote above: “A final low to 1,132.80 (but not below 1,132.12) may complete this downwards movement. The trend channel on the hourly chart needs to be breached before any confidence that downwards movement is over may be had.”
Gold is at 1131 below 1132.80. What does this mean in terms of EW count???
All wave counts expecting gold to go higher. GDX to GLD ratio almost calling for gold to go higher.
I think Lara is correct to write that once gold goes higher than 1191 bear is over.
I think the 1132.80 problem is fixable on the hourly chart if, instead of ending on Oct-29, minuette (iii) ended on Oct-30 (where the current hourly chart shows subminuette i ending).
Gold Made Low $1131 Again
Now Can We go Long
Now is 1114?????
GDX bounced today at 14.63, right before hitting $14.62, the 62% retracement from its move from the 9/11 low to 10/15 high.
GDX – MACD was very bullish Monday.
Got an update
$ASTROLOGY$
Mars is entering in virgo in about 2hrs from now,than it will conjuct rahu.this period of 7days may bring heavy buying in precious metals,and stock traders be cautious,venus getting debilitated today,a turnaround day for stocks.
Sushil
Keep us updated. Thanks.
Gold low 1131.6..??
Is it correct..
Now wht lara
Now it should go up. But that channel must be breached before any confidence may be had in a trend change.
Ok.thnk u
$USD