
Last week’s analysis had three wave counts. All expected downwards movement, which is what happened.
At this time it looks like in the short term the picture may be clearer for Silver than Gold, so maybe Silver can point the way despite having a greater variety of wave counts.
Summary: This week all wave counts are expecting a correction to turn up. A green daily candlestick would signal the start of a small correction which should last three days minimum. Thereafter, all wave counts will expect more downwards movement. For all wave counts, at least short term, the trend is down.
There are still at least three possible wave counts for Silver at the weekly chart level, and at the daily chart level multiple possibilities remain viable. Regular technical analysis should be used to determine which wave count is most likely.
New updates to this analysis are in bold.
WAVE COUNT #1
Click chart to enlarge.
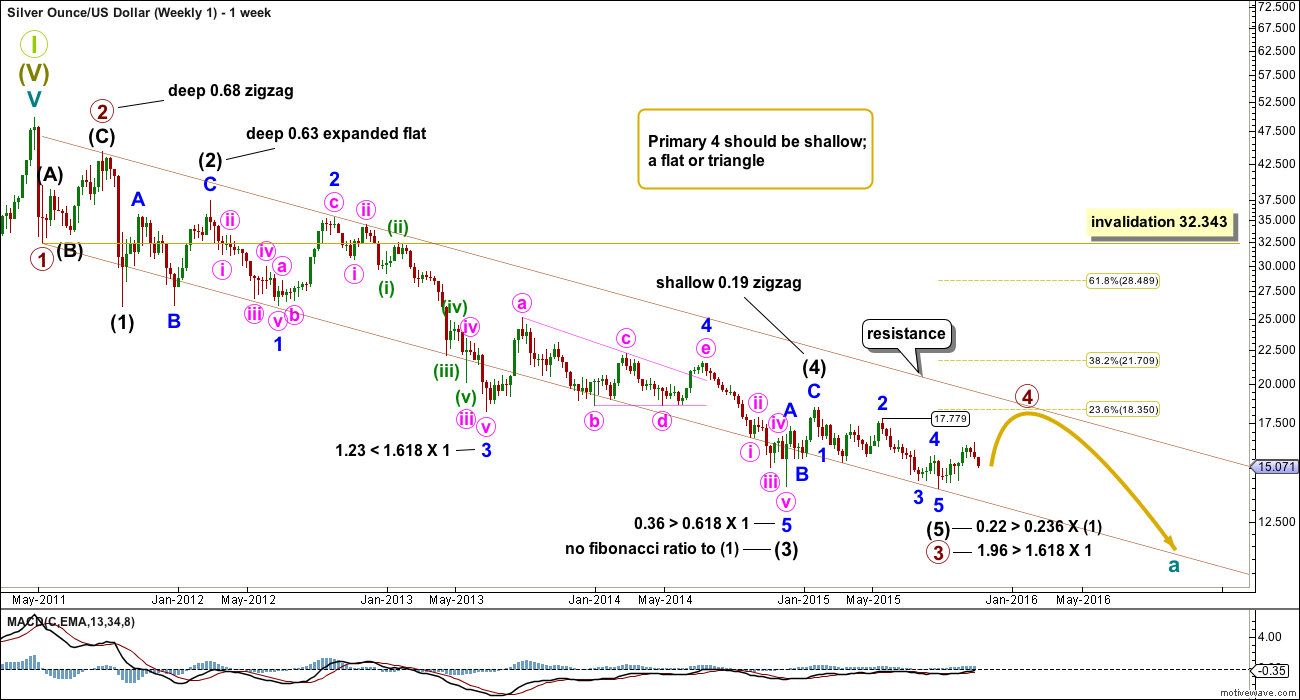
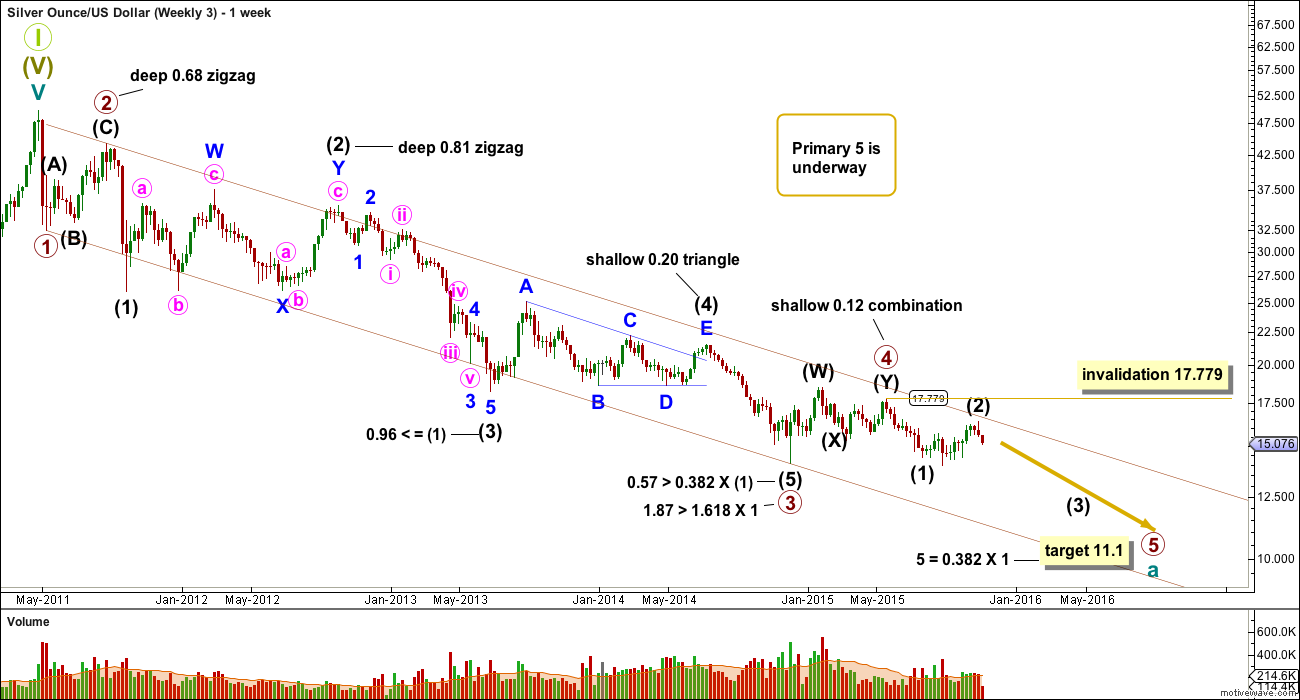
This first wave count sees a 5-3-5 complete downwards for primary waves 1, 2 and 3.
The channel (maroon) drawn about this downwards movement is drawn using Elliott’s first technique. Draw the first trend line from the lows labelled primary waves 1 to 3, then place a parallel copy on the high of primary wave 2. Primary wave 4 may find resistance at the upper edge of the channel.
Primary wave 2 was a deep single zigzag. Given the guideline of alternation expect primary wave 4 to be shallow and a flat, combination or triangle.
There are multiple structural possibilities for primary wave 4. It is impossible to tell which structure will unfold, only that it is most unlikely to be a zigzag or zigzag multiple. If it is an expanded flat, running triangle or combination, it may include a new price extreme beyond its start, so it may include a new low below 13.983.
At this stage, the idea of a combination may be eliminated at the daily chart level. The reasoning for this is explained underneath the daily chart.
Intermediate wave (1) lasted a Fibonacci 5 weeks; intermediate wave (2) was 22 weeks, just one more than a Fibonacci 21; intermediate wave (3) was exactly a Fibonacci 144 weeks; and, intermediate wave (5) was 31 weeks, three short of Fibonacci 34.
Primary wave 2 lasted 15 weeks. Primary wave 4 is expected to be longer lasting because zigzags are quicker than combinations, triangles and even flats. Primary wave 4 may total a Fibonacci 21 or 34 weeks, give or take up to three weeks either side of these expectations.
Primary wave 4 may not move into primary wave 1 price territory above 32.343.
Click chart to enlarge.
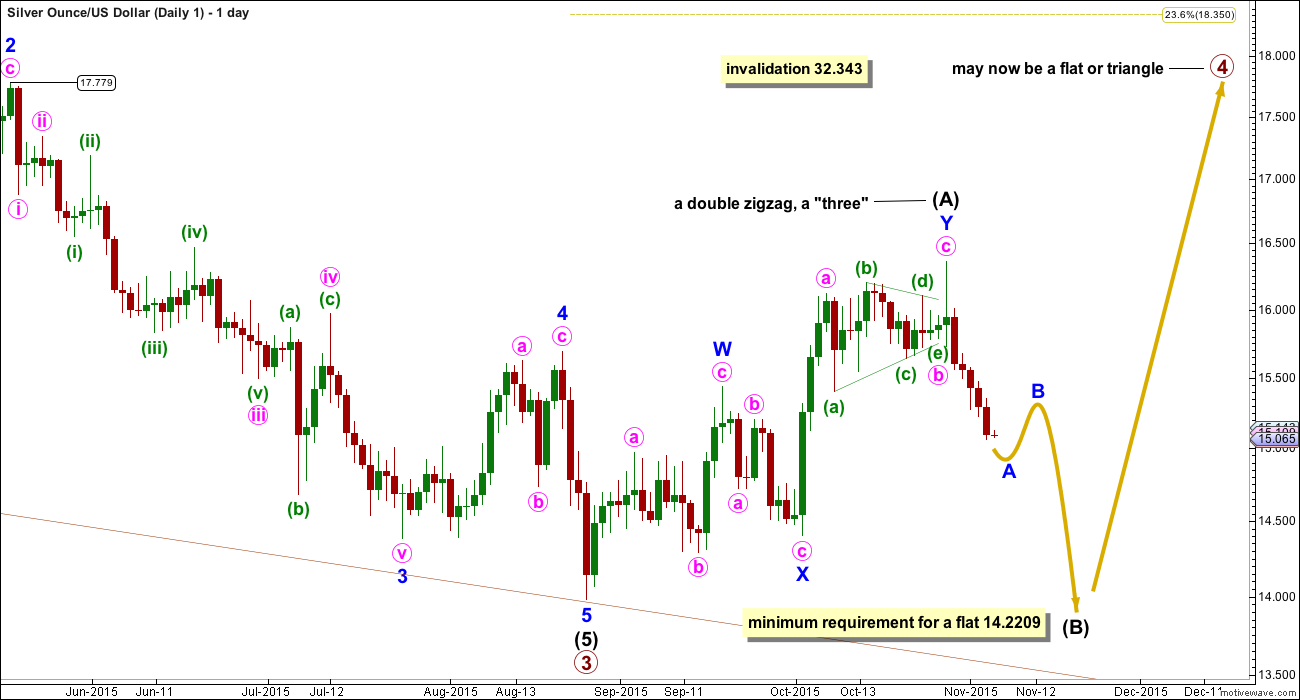
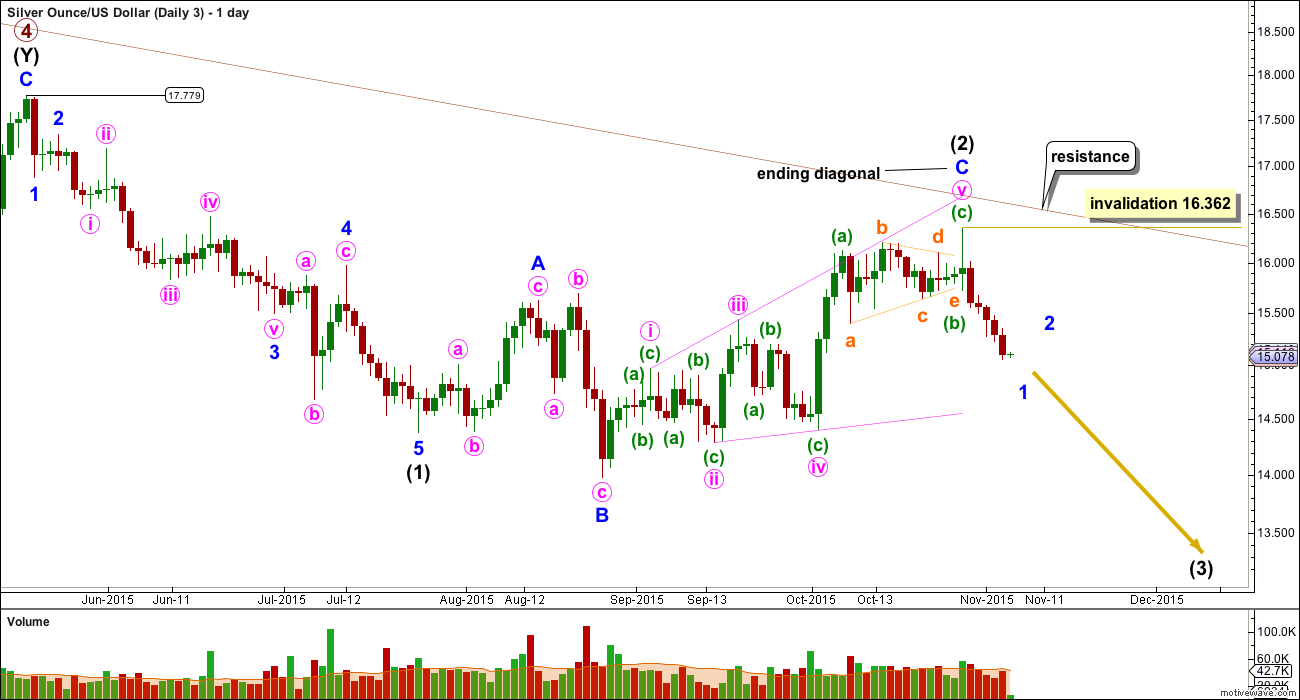
All wave counts will show daily charts from the price point marked at 17.779 which was 18th May, 2015.
Upwards movement for intermediate wave (A) is a completed double zigzag. This is termed a “three”, a corrective structure.
If primary wave 4 is a triangle, then one of the five sub waves may be a double zigzag. This may have been intermediate wave (A) of a triangle.
If primary wave 4 is a flat correction, then intermediate wave (A) must be a corrective structure and may have been a double zigzag.
Primary wave 4 may not be a combination, if the first structure is a double zigzag. Within multiples each corrective structure of W and Y (and Z if there is one) may only themselves subdivide as simple corrective structures (labelled A-B-C, or A-B-C-D-E in the case of a triangle). The maximum number of corrective structures within a multiple (excluding the joining X waves) is three. And so to label multiples within multiples extends the maximum beyond three violating an Elliott wave rule.
If primary wave 4 is unfolding as a flat correction, then within it intermediate wave (B) must reach a minimum 90% length of intermediate wave (A) at 14.2209. Intermediate wave (B) must be a corrective structure and may make a new low below the start of intermediate wave (A) as in an expanded flat. There is no lower invalidation point for this wave count at this stage for that reason.
If primary wave 4 is unfolding as a triangle, then intermediate wave (B) within it has no minimum requirement, must be a corrective structure, and may also make a new low below the start of intermediate wave (A) as in a running triangle.
So far intermediate wave (B) looks to be incomplete. It must look like a complete three wave structure before an end to it may be expected. Within the three down, minor wave B must yet unfold. It should be choppy and overlapping, lasting a few days. A green daily candlestick would confirm the arrival of minor wave B.
Intermediate wave (B) may be any corrective structure, including a triangle, combination or expanded flat which could include a new high above its start at 16.362. This is the only one of the three wave counts which allows for a new high above 16.362.
WAVE COUNT #2
Click chart to enlarge.
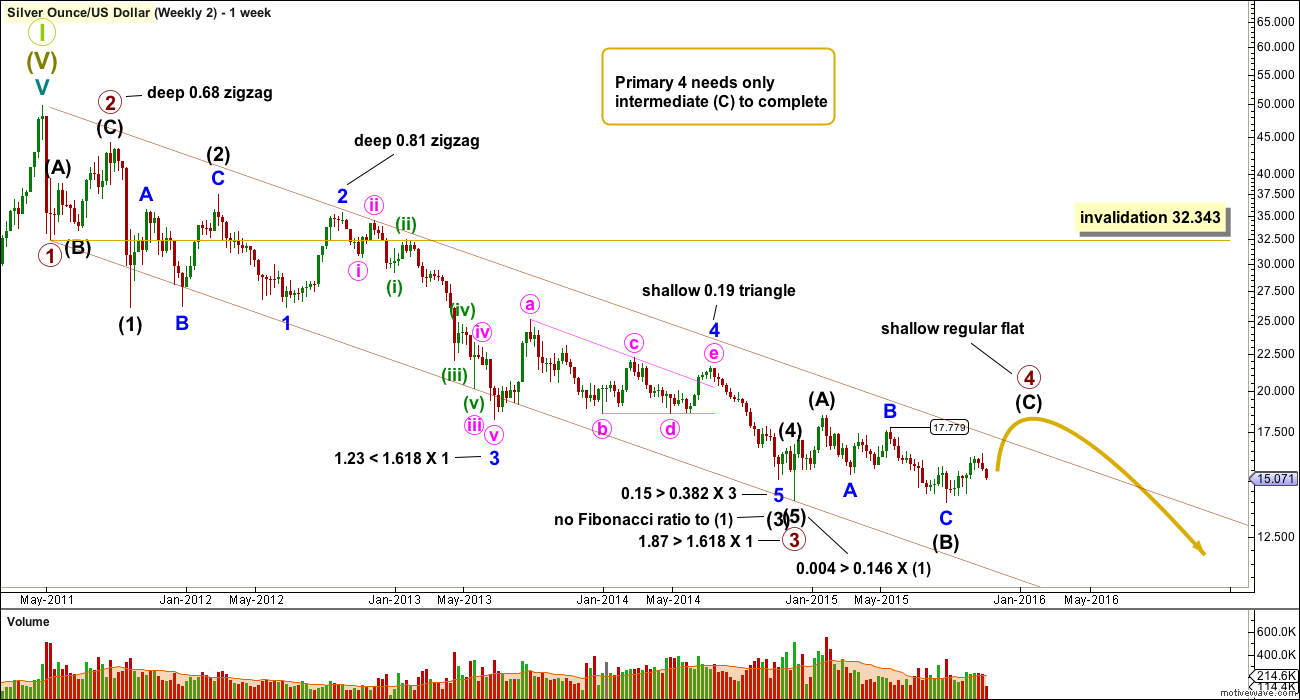
Primary wave 4 may already be underway. Primary wave 3 still has a close Fibonacci ratio to primary wave 1. This wave count and the first wave count both have similar Fibonacci ratios, so there is no advantage nor disadvantage between them in this regard.
Within primary wave 3, intermediate wave (1) lasted a Fibonacci 5 weeks; intermediate wave (2) lasted 22 weeks, one longer than a Fibonacci 21; intermediate wave (3) lasted 40 weeks with no Fibonacci duration; intermediate wave (4) lasted a Fibonacci two weeks; and, intermediate wave (5) lasted a Fibonacci one week.
Primary wave 4 may be over halfway complete as a regular flat correction. Within the flat correction, intermediate waves (A) and (B) both subdivide as three wave structures and intermediate wave (C) is incomplete.
The channel here is a little different, a best fit, so not drawn using Elliott’s technique.
Click chart to enlarge.
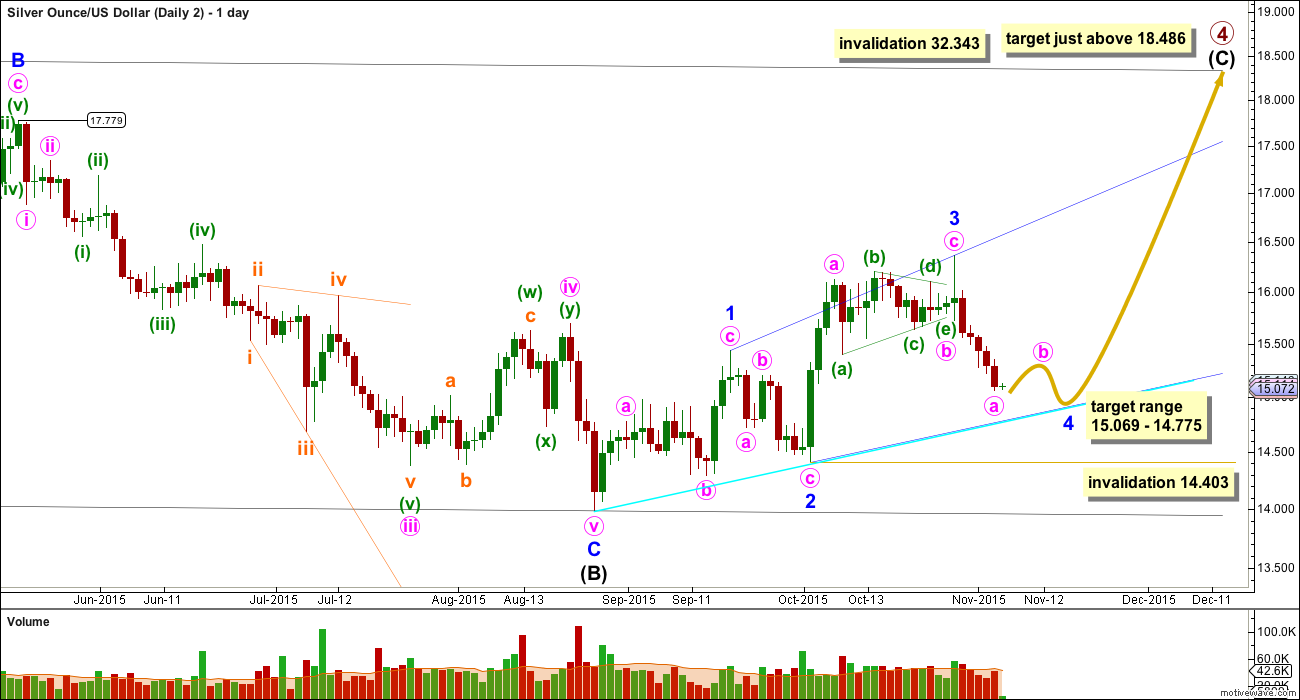
Intermediate wave (C) may be unfolding as an ending expanding diagonal.
Within an ending diagonal, all the sub waves must subdivide as zigzags.
The diagonal is expanding because minor wave 3 is longer than minor wave 1. Minor wave 4 must overlap back into minor wave 1 price territory. Minor wave 4 must be longer than minor wave 2 and must end below 15.331. This minimum requirement has been met. The normal depth for a fourth wave of a diagonal is between 0.66 to 0.81 the third wave, so this gives a target range between 15.069 to 14.775. Minor wave 4 may not move beyond the end of minor wave 2 below 14.403. Minor wave 4 must subdivide as a zigzag.
Minor wave 4 should look like a clear three wave structure; it must be a zigzag. Within minor wave 4 minute wave b has yet to begin. This wave count expects the same movement next as the first wave count, a zigzag to complete downwards.
A green daily candlestick would signal the end of minute wave a and the start of minute wave b. Minute wave b may last several days, with three days minimum to give the wave count the right look at the daily chart level. It should be choppy and overlapping. It may not move beyond the start of minute wave a above 16.362.
WAVE COUNT #3
Click chart to enlarge.
Primary wave 4 may be complete and primary wave 5 may be underway.
Primary waves 2 and 4 exhibit perfect alternation and good proportion: primary wave 2 was a deep zigzag lasting 15 weeks and primary wave 4 was a shallow combination lasting 24 weeks, 1.618 the duration of primary wave 2.
At 11.1 primary wave 5 would reach 0.382 the length of primary wave 1.
Although this wave count is labelled #3 it is my preferred wave count. I am presenting them in the order in which I developed each, not in order of preference. This wave count is preferred primarily for the reason that there has been no technical confirmation of a trend change from bear to bull for Silver.
Intermediate wave (2) may not move beyond the start of intermediate wave (1) above 17.779. A breach of this invalidation point would now also require a strong breach of the bear market channel, so this invalidation point should not be moved any higher. When that channel is breached that should indicate a trend change for Silver from bear to bull. At that stage, only bullish wave counts should be seriously considered.
Click chart to enlarge.
The upper edge of the maroon channel is copied over here from the weekly chart. It should provide resistance if Silver is still within a bear market. If that trend line is clearly breached, then this wave count should be discarded.
Intermediate wave (2) may be complete as an expanded flat correction. Within intermediate wave (2), minor wave B was a 1.32 length of minor wave A, nicely within the normal range of 1 to 1.38.
Minor wave C may be an ending expanding diagonal. There is no Fibonacci ratio between minor waves A and C.
Ending diagonals require all sub waves to subdivide as zigzags.
Intermediate wave (3) should now be underway. This wave count for Silver is the equivalent of the bear wave count for Gold. If Gold confirms its bear wave count, then the probability of this wave count for Silver would increase. For Gold the confirmation point is very close at 1,104.69.
A green daily candlestick would indicate the start of a second wave correction for minor wave 2. At that stage, a Fibonacci retracement should be drawn on the completed length of minor wave 1. The 0.382 and 0.618 Fibonacci ratios would be targets, with the 0.618 Fibonacci ratio favoured. Minor wave 2 may last a minimum three days, and possibly several more. It may not move beyond the start of minor wave 1 above 16.362.
TECHNICAL ANALYSIS
WEEKLY CHART
Click chart to enlarge. Chart courtesy of StockCharts.com.
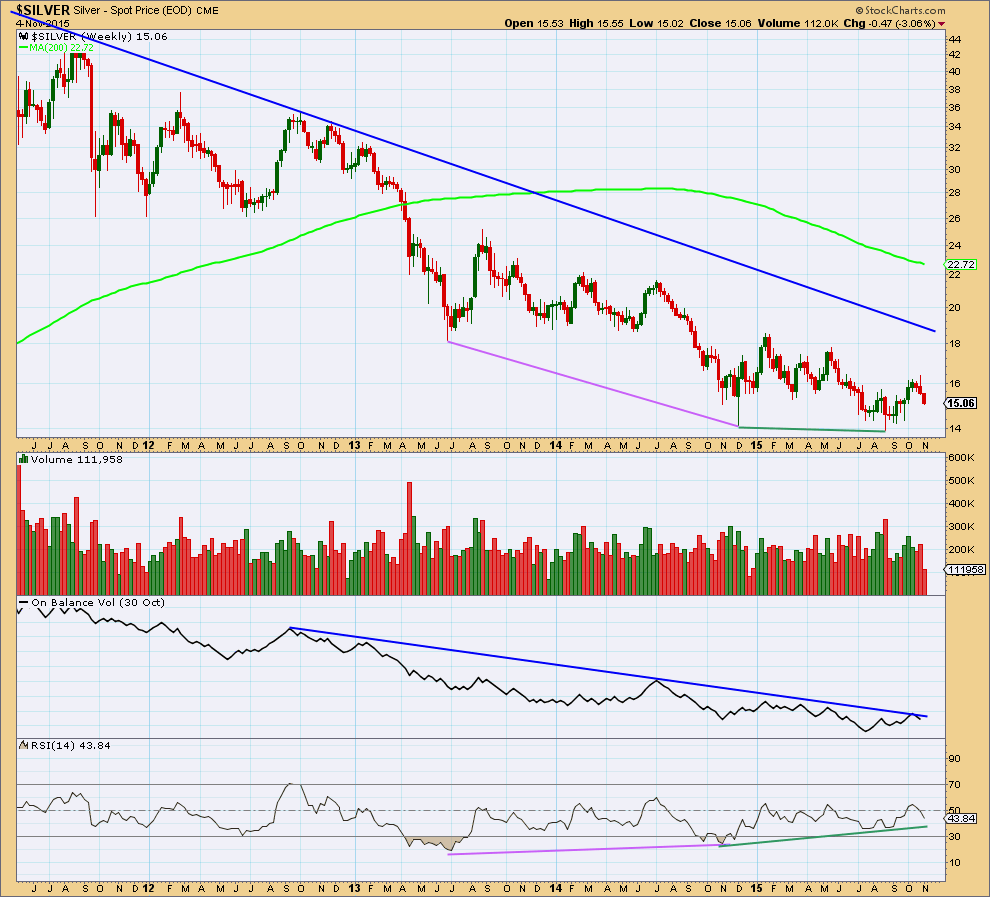
Silver has been in a bear market since April 2011. I am adjusting the length of the weekly moving average, so that it shows where this bear market has been finding resistance. The 89 week (a Fibonacci number) Simple Moving Average works well for this bear market. If that is breached by a weekly candlestick, it would be strong indication that Silver has changed from bear to bull.
Overall, while Silver has been in a bear market, volume is declining which indicates the bear trend is maturing, a change to a bull market is closer. Volume will not tell us exactly when that change comes though. It is a warning sign only.
Of recent weeks, strongest volume is for a downwards week. This is bearish.
On Balance Volume remains below a long held trend line. This trend line is somewhat shallow, repeatedly tested, and reasonably technically significant. While OBV remains below that trend line it will remain bearish. Last week OBV again found resistance at that line, turning downwards. The strength of the line is reinforced, a further bearish signal.
RSI shows strong double divergence with price over a long time period (pink and green lines on price and RSI). While price made new lows RSI failed to make new lows. This indicates weakness in downwards movement and is bullish. Because this divergence is double and over such a long time period it is highly technically significant. This indicator is often leading (anticipates a trend change). The first two bull wave counts must be seriously considered for this reason.
The regular technical analysis picture is unclear at the weekly chart level. A trend change will come and RSI is indicating it may come sooner or have arrived already. It needs to be confirmed by price, and a break above the blue bear market trend line would be full and final confirmation of a trend change.
DAILY CHART
Click chart to enlarge. Chart courtesy of StockCharts.com.
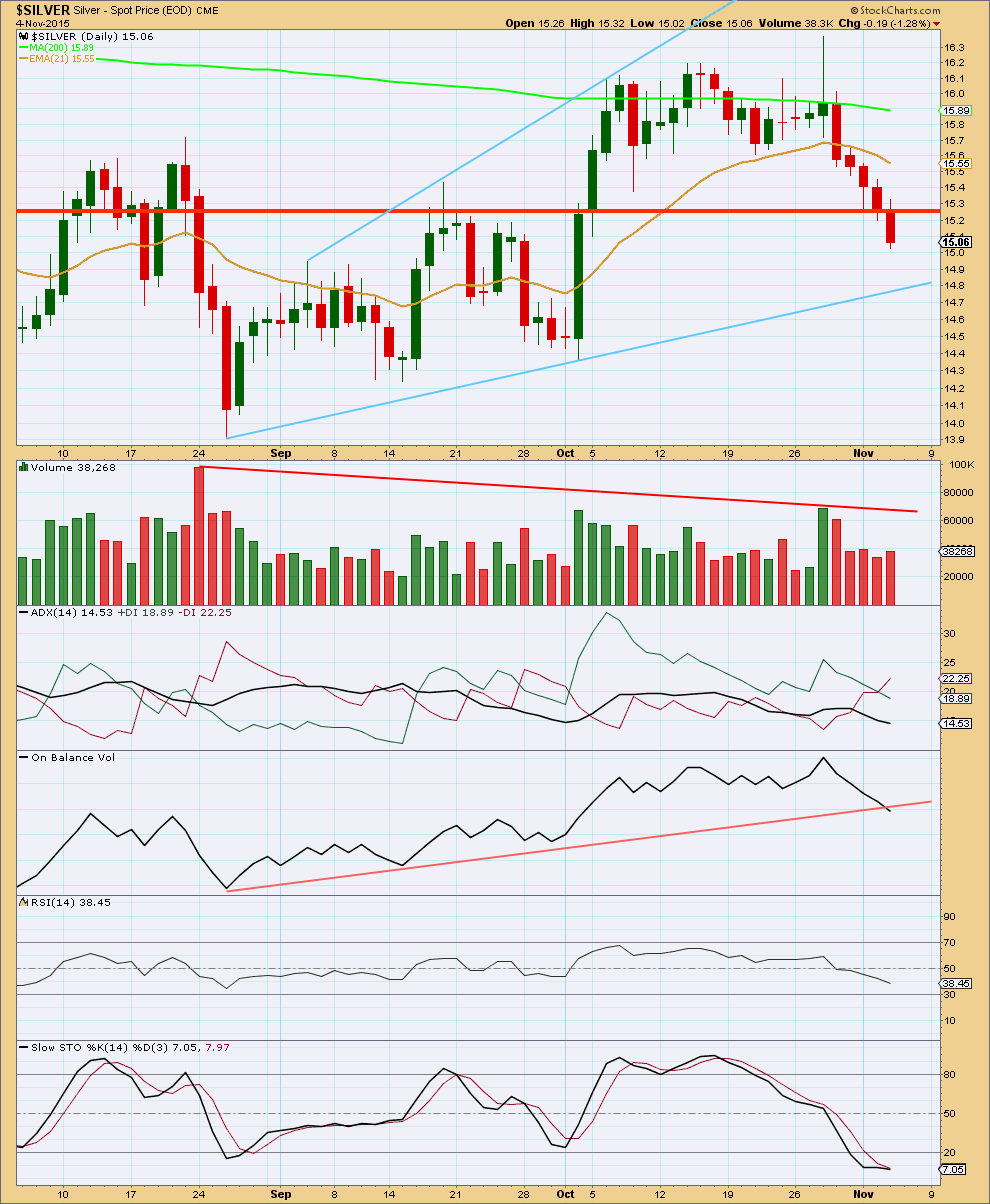
Price has been falling of its own weight. During the last bear wave down for Silver from 19th May to 26th August, downwards movements were accompanied by declining volume yet price continued lower in a clear trend. To the downside, volume does not need to show an increase to indicate a downwards trend for Silver.
Price has broken below the horizontal trend line which has previously provided support and resistance. This is a further bearish indicator.
The red -DX line has crossed the green +DX line indicating a potential trend change. The ADX line does not yet indicate a trend. If it turns upwards and moves above 15, a new trend may be indicated.
On Balance Volume has broken a reasonably long held and shallow trend line. OBV can be a leading indicator. This is a bearish signal.
RSI is neither oversold nor overbought and exhibits no divergence.
Stochastics is oversold. If a downwards trend is developing, then Stochastics may remain extreme for some time. Stochastics was flat for the last three days as price made new lows. This is a short term bullish indicator. It supports the Elliott wave counts indicating a bounce may happen sooner rather than later.
At this stage, upwards movement may find resistance at the horizontal trend line for a throwback.
This analysis is published about 01:41 a.m. EST.