
I have only one bullish Elliott wave count for the USD Index.
New updates to this analysis are in bold.
Click chart to enlarge.
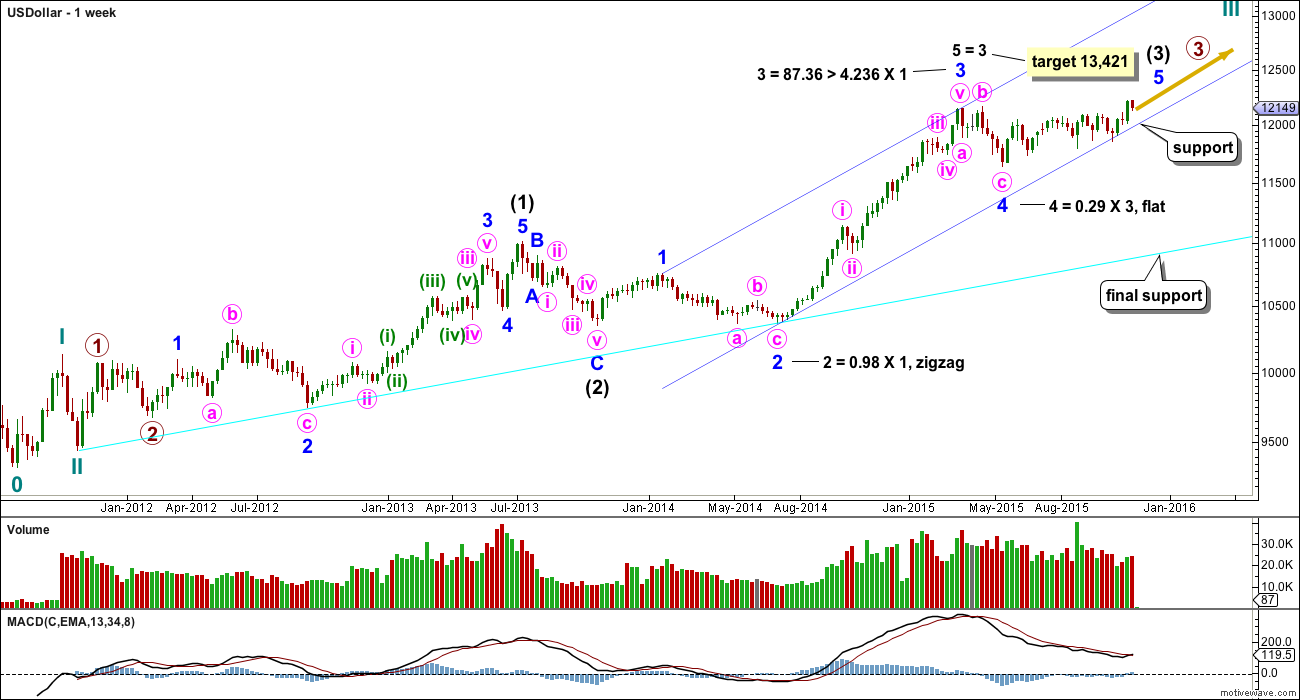
The US Dollar has been in a bull market since July 2011. So far there is no confirmation of a trend change. The bull market should be assumed to remain intact until proven otherwise.
Ratios within intermediate wave (1) are: minor wave 3 is 24.98 longer than 2.618 the length of minor wave 1, and minor wave 5 has no Fibonacci ratio to either of minor waves 3 or 1.
Within minor wave 3, there are no Fibonacci ratios between minute waves i, iii and v.
Ratios within minute wave iii are: minuette wave (iii) has no Fibonacci ratio to minuette wave (i), and minuette wave (v) is 8.46 short of 0.382 the length of minuette wave (iii).
Within intermediate wave (3), minor wave 3 is 87.36 longer than 4.236 the length of minor wave 1.
Minor wave 3, within intermediate wave (3), shows strongest upwards momentum. MACD supports the Elliott wave count.
Within intermediate wave (3), minor wave 2 was a very deep 0.98 zigzag. Minor wave 4 is now complete as a shallow flat correction.
Draw a channel about intermediate wave (3) using Elliott’s first technique: draw the first trend line from the highs labelled minor waves 1 to 3, then place a parallel copy on the low labelled minor wave 2. So far this contains all of intermediate wave (3). The lower edge of this channel is again proving useful in showing where downwards movement is finding support.
The US Dollar was in a sideways consolidation since mid March. During this sideways movement it is an upwards week which has strongest volume. This indicates that when the consolidation is complete an upwards breakout is more likely than downwards. So far, at this stage, it looks like price has now broken out of this consolidation upwards as expected.
A final support line is shown in bright aqua blue.
Click chart to enlarge.
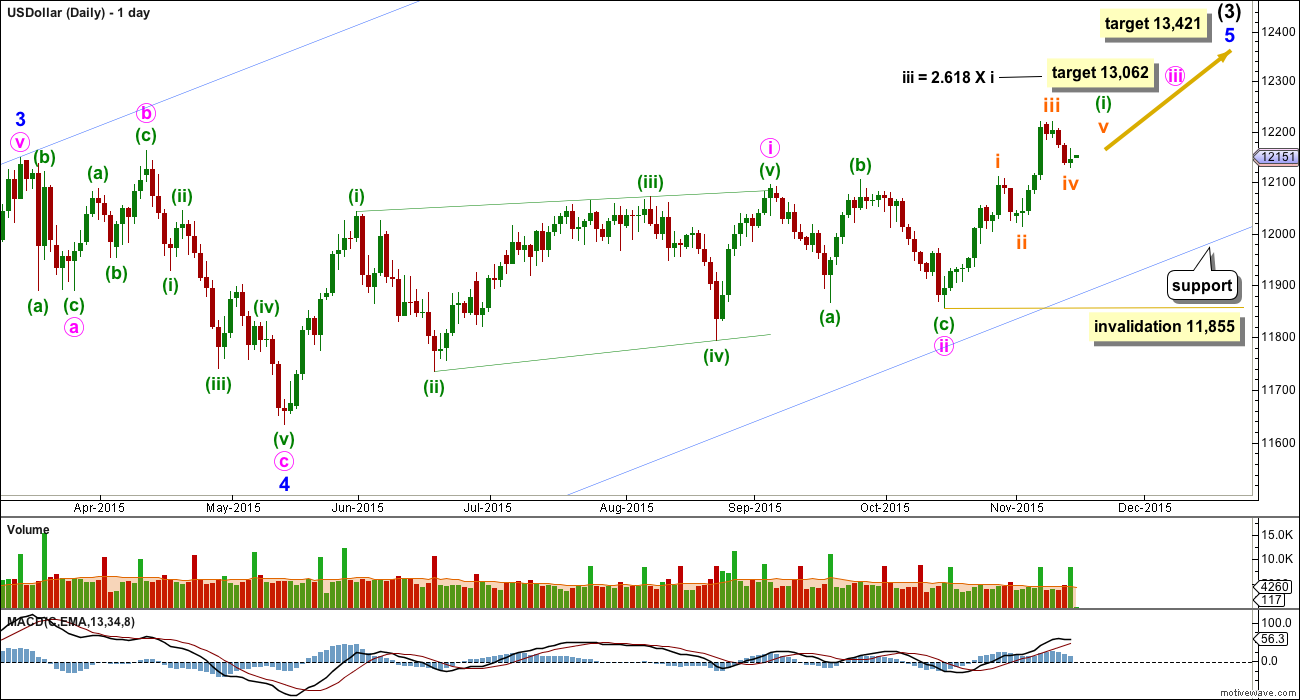
Minor wave 4 did not complete as a triangle, as last analysis expected, but was over sooner as a flat correction. Minute wave b is a 105% correction of minute wave a, so this is a regular flat. Minute wave c is longer than normal for a C wave within a regular flat. There is no Fibonacci ratio between minute waves a and c.
The sideways consolidation was not a fourth wave triangle, which was what I had expected. Instead, the sideways consolidation turned out to be a leading contracting diagonal for minute wave i. This was followed by a relatively deep 0.52 flat correction for minute wave ii.
At 13,062 minute wave iii would reach 2.618 the length of minute wave i.
This wave count expects a long extension for minor wave 5.
No second wave correction may move beyond the start of its first wave below 11,855 within minute wave iii. Minuette wave (ii) should find strong support again about the lower edge of the blue channel copied over here from the weekly chart.