The main Elliott wave count expected overall downwards movement to end within a range of 1,076.7 – 1,068.64.
Price is now within that range.
Summary: Both wave counts expect this downwards move to end soon and be followed by a upwards movement to new highs. The bear / main wave count expects the next wave up to be a fifth wave of an ending diagonal. The bull / alternate wave count expects the next wave up to be the middle of a big third wave. We still do not have any technical confirmation of a market change from bear to bull, so any bull wave count comes with the strong caveat that it is unconfirmed.
New updates to this analysis are in bold.
Last published weekly charts with the bigger picture are here.
MAIN BEAR ELLIOTT WAVE COUNT
Gold has been in a bear market since September 2011. There has not yet been confirmation of a change from bear to bull, so at this stage any bull wave count would be trying to pick a low which is not advised. Price remains below the 200 day moving average and below the cyan trend line. The bear market should be expected to be intact until we have technical confirmation of a big trend change.
That technical confirmation would come with a breach of the upper cyan trend line by at least one full daily candlestick above and not touching the line. A new high above 1,191.37 would provide full and final price confirmation.
The final line of resistance (cyan line copied over from weekly charts) is only overshot and not so far properly breached. Simple is best, and the simplest method to confirm a trend change is a trend line.
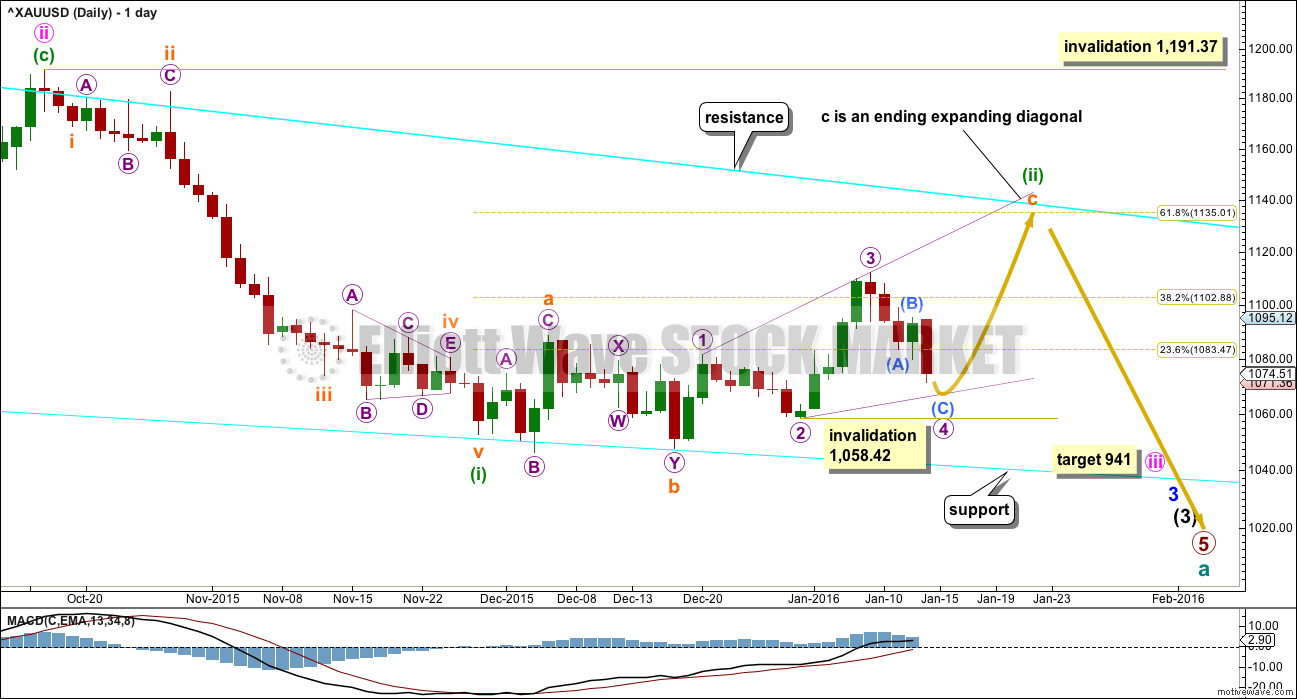
Minute wave ii is a complete zigzag and deep at 0.73 the length of minute wave i.
At 941 minute wave iii would reach 1.618 the length of minute wave i.
Minuette wave (i) is complete.
Minuette wave (ii) looks like a fairly typical expanded flat correction which may end about the 0.618 Fibonacci ratio at 1,135.
There are two structural possibilities for a C wave within a flat correction: either an impulse or an ending diagonal. Because the impulse is now invalidated with the fourth wave overlap into first wave price territory, that leaves only one possible structure for subminuette wave c, an ending expanding diagonal.
All the subwaves must subdivide as zigzags within an ending diagonal. I have checked subdivisions on the hourly chart and both micro waves 1 and 3 can be seen as zigzags. The fourth wave must overlap back into first wave price territory within a diagonal. The rule for the end of the fourth wave is it may not move beyond the end of the second wave. Micro wave 4 may not move below 1,058.42.
The diagonal must be expanding because micro wave 3 is longer than micro wave 1, and micro wave 4 is longer than micro wave 2. The trend lines must diverge.
There is still the possibility that minuette wave (ii) could be labelled as complete at the last high. If it was over, then the only structure I can see which would fit is a double combination. But double combinations are sideways structures; they should not have a slope against the trend one degree higher. This correction has a clear slope. For that reason I still do not want to publish this idea because the probability is too low. I will only publish it if price breaks below 1,058.42.
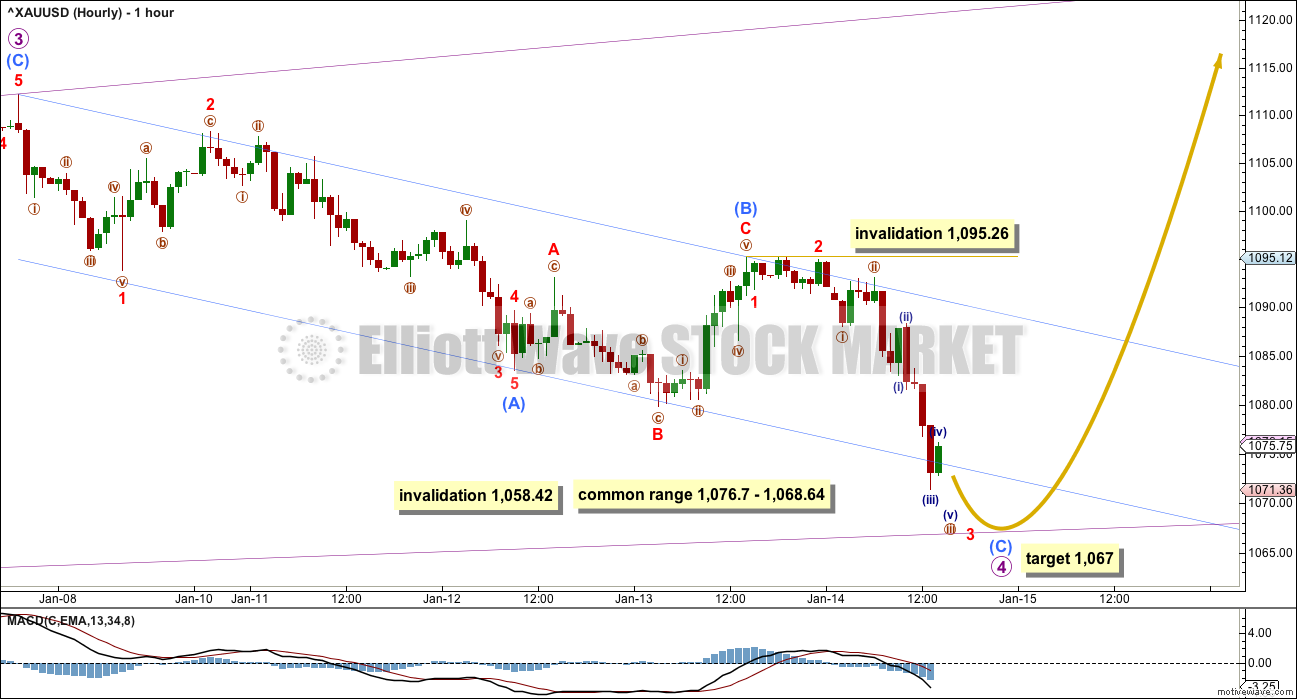
The fourth wave must subdivide as a zigzag within an ending diagonal. The diagonal trend lines now diverge with this fourth wave moving lower. All rules so far are met.
The common depth for fourth and second waves within diagonals is between 0.66 to 0.81 the prior wave. This gives a target range for micro wave 4 between 1,076.7 and 1,068.64.
Micro wave 4 is now within the common range. At 1,067 submicro wave (C) would reach equality in length with submicro wave (A).
A trend channel may now be drawn about the zigzag of micro wave 4. Downwards movement is finding some support about the lower edge. Sometimes C waves overshoot these channels. When the channel is breached by upwards movement (above the upper light blue trend line), that shall provide trend channel confirmation that the downwards wave of micro wave 4 is over and the next wave up for micro wave 5 is underway. Then the invalidation point may be moved up to the end of micro wave 4.
ALTERNATE BULL WAVE COUNT
This was published here as a second alternate wave count. I will use it as the only regular alternate bull wave count because it is the only bull wave count to meet all Elliott wave rules.
I want to remind members that last time Gold saw a reasonable upwards movement from 24th July, 2015, to 15th October, 2015, there were many who expected that rise meant the bear market had ended and a new bull market had begun. It turned out that idea was premature: price turned around and made new lows. On 21st August I developed three bullish wave counts, partly in response to a demand from members, and one by one they have all been eliminated.
Now, again, price rises and there is a demand for bullish wave counts.
It is my strong view that this is premature. I will publish this wave count with that strong caveat.
Eventually the market will change from bear to bull, and when that change is confirmed that is the time to have confidence in a bull wave count. That time is not now.
Price remains below the 200 day moving average. Price has made a series of lower highs and lower lows down to the last recent low. There is not a clear five up on the daily chart. Price remains below the bear market trend line. While price remains below that line this wave count will be an alternate and comes with a strong warning that it is premature.
Downwards movement from the all time high for this bull wave count is seen as a big double zigzag which would most likely be complete at super cycle degree for an A wave.
When an A wave subdivides as a three, then the larger structure may be either a flat or triangle. The B wave may make a new price extreme beyond the start of the A wave within flats and triangles. Here, super cycle wave (b) may move above 1,920.18 as in an expanded flat or running triangle.
When the first move of a larger correction subdivides as a multiple (w-x-y), then a combination may be eliminated. Combinations may not have multiples within multiples, because that would increase the number of corrective structures within a multiple beyond three and violate the rule.
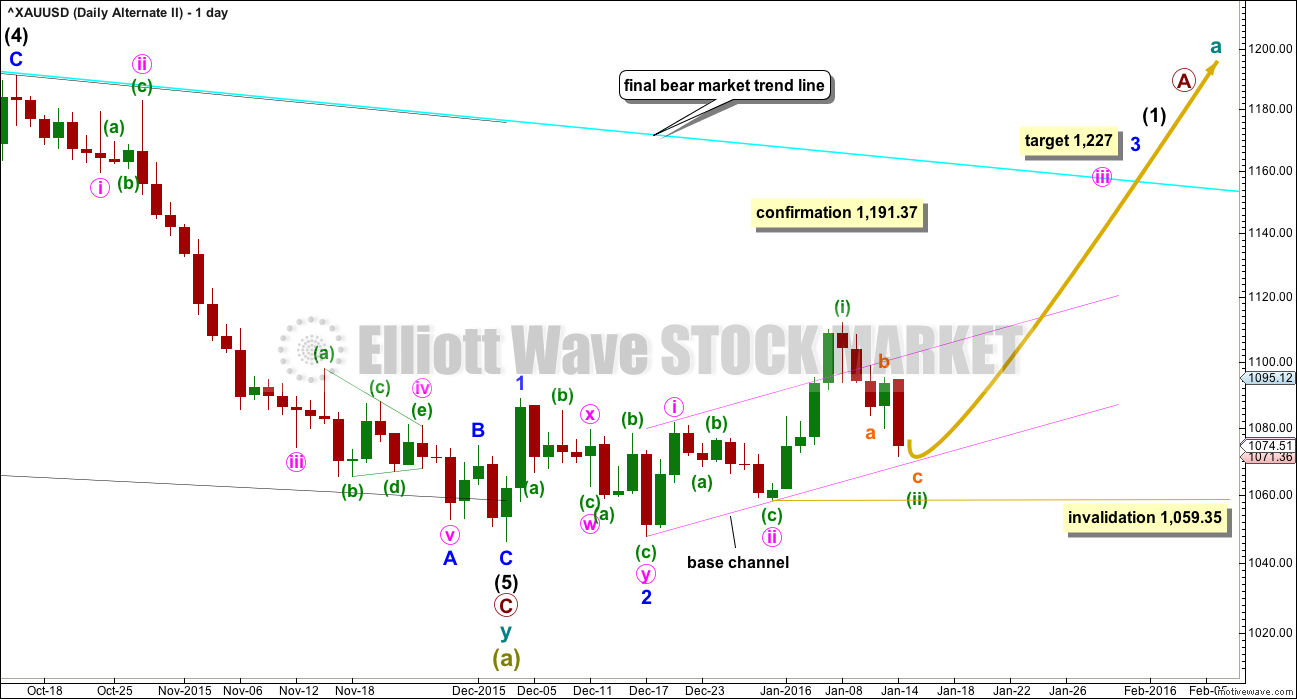
A new wave up at super cycle degree must begin with a clear five up on the daily chart (and probably the weekly as well). So far only minor waves 1 and 2 are complete. At 1,227 minor wave 3 would reach 4.236 the length of minor wave 1.
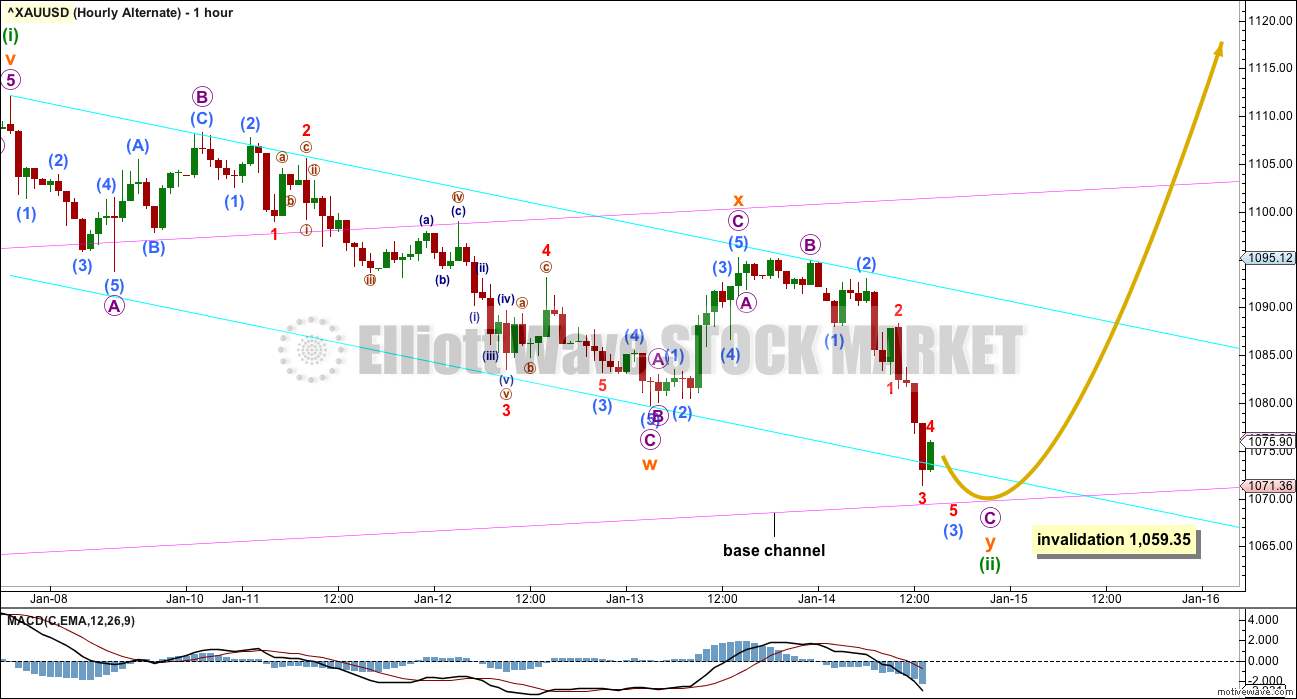
Minute waves i and ii are complete within minor wave 3. The acceleration channel is not working, so a more conservative base channel is drawn about these two waves. Copy it over to the hourly chart. A lower degree second wave correction for minuette wave (ii) should not breach a base channel drawn about a first and second wave one or more degrees higher. The lower pink line should provide support, if this wave count is correct.
Minuette wave (ii) may not move beyond the start of minuette wave (i) below 1,059.35.
Downwards movement so far will subdivide either as a single zigzag (labelling on main wave count hourly chart) or as a double zigzag (as per labelling here).
This move is ambiguous. Both ideas should be considered.
If this movement down is a double zigzag, then within the second zigzag micro wave A is very short. This reduces the probability of this idea. The labelling on the first hourly chart has a slightly better look overall.
Both ideas still require more downwards movement. For this idea, only one more fourth wave correction for submicro wave (4) and two fifth waves down are required to complete the structure. For the first idea, two more fourth wave corrections and three more fifth waves down are required.
The safest approach to this correction is to wait for the channel drawn about the downwards movement to be breached before expecting that it is over. The channel is slightly different here. It is drawn as a best fit and so far contains all movement with the exception of two very small overshoots. When this cyan trend channel is breached by upwards movement above the upper cyan line, that shall provide strong indication that the correction is over and the next wave up is underway.
This wave count expects the next wave up to be a swift strong middle of a third wave.
TECHNICAL ANALYSIS
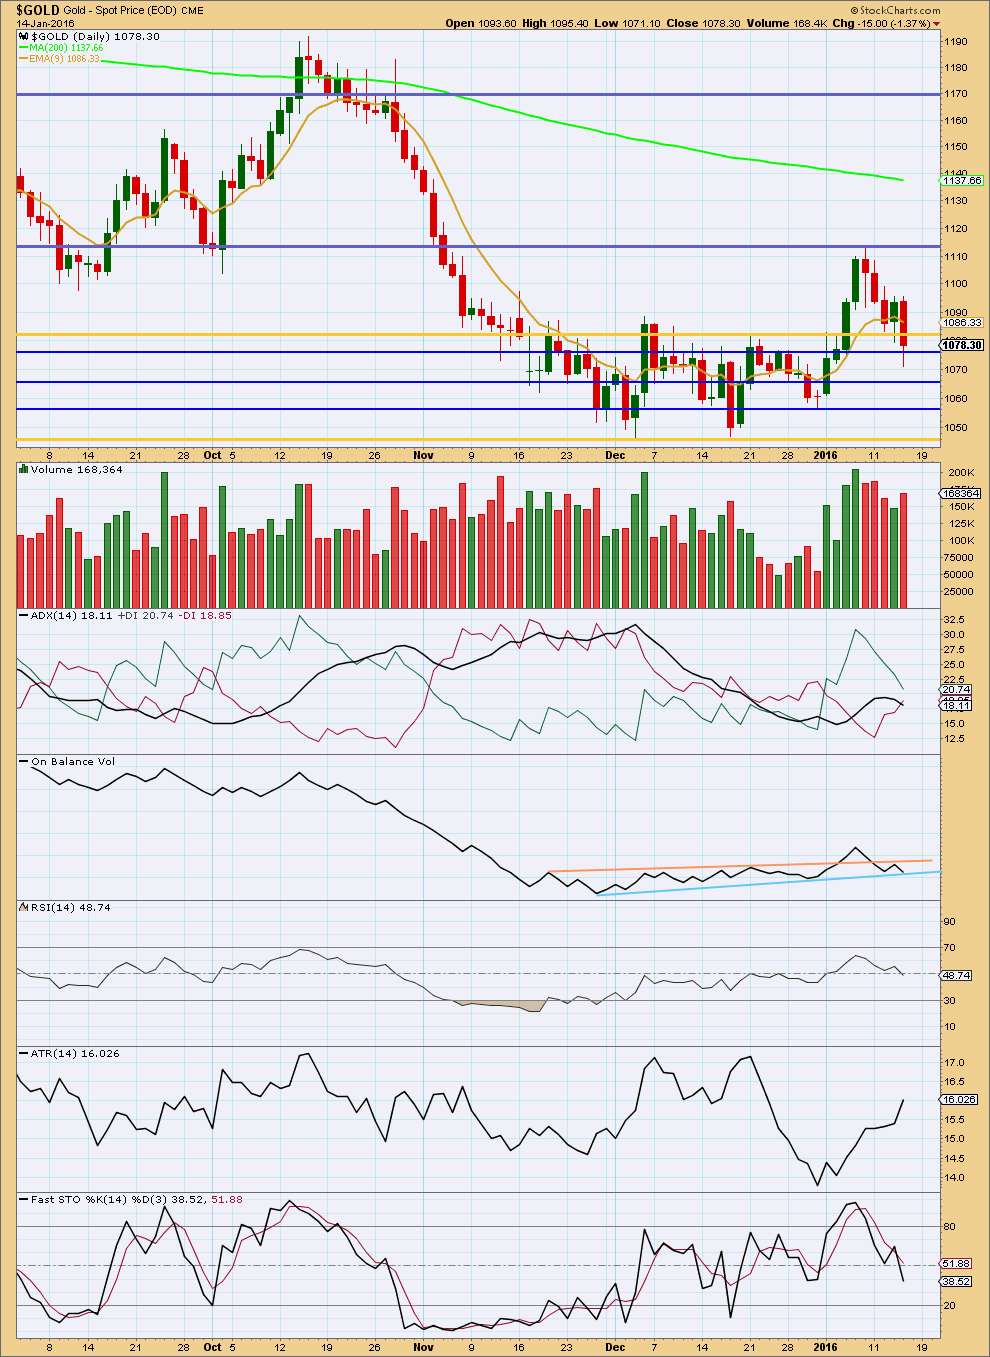
Click chart to enlarge. Chart courtesy of StockCharts.com.
Note: This section of the analysis is updated 11:59 p.m. EST.
Some increase in volume while price declined today supports the decline in price. Overall, during this consolidation volume is still declining. It is still two upwards days, 4th December and 7th January, which have strongest volume suggesting an upwards breakout is more likely than downwards.
ADX is declining indicating the market is consolidating. ATR disagrees, it is increasing.
Price may be expected to swing from resistance to support and only end the downwards swing when price finds support and Stochastics is oversold at the same time. So far Stochastics is not oversold, so more downwards movement may be expected to end about either of the next two blue lines or possibly even the lower gold line.
If On Balance Volume breaks above the peach line or below the blue line, it may indicate the breakout direction prior to price.
This analysis is published @ 03:41 p.m. EST.

Gold has fallen for 3 straight years, but many don’t see a bottom
Published: Jan 15, 2016 3:37 p.m. ET
http://www.marketwatch.com/story/gold-down-3-years-in-a-row-and-hasnt-hit-bottom-yet-2016-01-15
Lara any possibility minuette wave (ii) of the bear count could aready be over at 1113 if gold does not hold above trendline and given current relative weakness of miners? Just looking for alternatives to downside in miners.
Yes, as noted in the analysis above, last paragraph underneath main / first daily chart:
“There is still the possibility that minuette wave (ii) could be labelled as complete at the last high. If it was over, then the only structure I can see which would fit is a double combination. But double combinations are sideways structures; they should not have a slope against the trend one degree higher. This correction has a clear slope. For that reason I still do not want to publish this idea because the probability is too low. I will only publish it if price breaks below 1,058.42.”
Yesterdays analysis expected a little more downwards movement before this upwards wave. That was wrong. That is not what happened.
The prior correction is over because price broke above 1,095.26 and out of the channel on the hourly charts.
This upwards wave is either micro wave 5 for an ending diagonal, so that must be a zigzag.
Or it may be the start of a big strong third wave up as per the bull wave count.
As I post this comment it looks like we are forming a small triangle. This looks like a fourth wave. And so the first five up of this new move is incomplete.
When the first five up is complete then a three down should not move below the start of it at 1,071.37. The invalidation point for both hourly charts today will be the same.
Both wave counts expect overall upwards movement now for next week which must break above 1,112.19. Target for the bear 1,158. Target for the bull 1,158 or 1,212
Lara will have a have a new main hourly wave count.
The ending contracting diagonal wave count got confirmed above 1095.
It will be interesting to gold COT data today.
Lara, are you able to make comment at this time as to the hourly count(s)? Not expecting full explanations, but your help with current confusion would be much appreciated.
Done.
I Saw ! 🙂 Thank you.
I just bought some GDX at 13.12, which I sold at open for 13.60.
We may be forming a wave 4 triangle for the 1st 5 up on the hourly
MIners into new lows today right now.
I just noticed on TOS trading platform it says US Equity Markets closed Monday
Martin Luther King, Jr. Day – January 18
NYSE website says it is closed on Monday.
That is another reason not to hold a 3x ETF over a long weekend
Based on current movement if we stay above trendline and don’t breakdown further
should have strong wave up to new highs. However if we breakdown again and this proves to be headfake then we are likely in next wave down having completed subminuette 2 assuming minuette (2) was over at 1113. That would have represented an expanded flat to end submin 2 at 1197 which was also about 61.8 retracement from move from 1113-1071. All IMHO.
Personally and financially I am hoping for upside breakout with weekly stochastic nicely pointing up.
GOING WITH WEEKLY STOCHASTICS AND INVALIDATION BREAKTHROUGH. This means pullback to 1087 was 38.2 retrace of move from 1071 to 1097. This would indicate we are now in small wave 3 of fifth wave up to 1138 target. IMHO
If the main count is in play, wave 5 of the diagonal must be a zigzag. We could be in wave 4 of the 1st 5 up,
Makes sense. If we can make a new high today, we will have a 5 up from the bottom. That will mean more up is coming after a pullback and both main and alternate counts will still be in play.
Miners filled the gap and have turned back up. A good sign. They are going up again because gold is holding its gains. Miners may close strong.
Any more retrace targets for today’s gold low for buying miners?
Both hourly counts look invalid. The low may be in.
i am buying more on a pullback to 1088. gold miners can stay weak even if gold is rising(for a time ) as traders sell gold stocks to meet margin calls in a declining stockmarket IMHO.
1088 great guess so far.
Lara’s comment:”There is still the possibility that minuette wave II could be labelled as complete at the last high.”+ remarks she makes.(doubts)
So high micro 3 on 8 january at 1112,19 was maybe high minuette II ?
If so,the bearcount is wright.
The hourly alternate is not invalid.
I just sold my GDX at 13.60 at 9:30:26 that I bought at 13.13 Thursday at 3:59:55 as GDX and gold may have near term peaked I believe and may drop to 1067 target as per Lara’s analysis and maybe today?
Not based on existing hourly wave counts.
Did subminuette wave iv peak at 1097.44 at 8:50 am?
Was that a full count yet for that wave?
Was 1097.43 at 9:29 2nd wave on the way down?
Subminuette wave v target is at 1067.
I can buy GDX or NUGT again when gold hits 1067 target area today or next week.
“Lara January 14, 2016 at 1:44 pm
…For both bull and bear on the hourly chart this downwards move is not done yet. The middle of a small third wave has just passed. Now a series of two or three fourth wave corrections followed by fifth waves down must unfold to complete the structure downwards.”
Richard, check for invalidation points on the hourly. I think that is what Daniel is getting at.
Yes I see the upper invalidation point 1095.26 was passed on main hourly count as gold already hit 1097.44 at 8:50 am that means the near term bottom was completed at 1071.45 yesterday so gold is no longer heading to 1067 and just may retrace down some then will be heading towards upper targets. Thanks for your clarification.
How low might gold go down to today? 1081.38?
1097.44 at 8:50 am – 1071.45 at 1:45 pm = 25.99 x .618 = 16.06 -1097.44 = 1081.38 lower retrace target?
Anyone have any other retrace targets for today’s low?
A weekly chart of Gold to XAU ratio indicates miners are still in brutal bear market.
This ratio is telling gold has not bottom????
AVOID it if possible.
The ratio just broke above a consolidation triangle on weekly chart.
I am long some select gold producing juniors.
GDX and GDXJ are dangerously close to a breakdown. A full breach of support, not just an overshoot, would be very bearish for Gold. Critical point.
http://thedailygold.com/silver-gold-stocks-dangerously-close-to-breakdown/
Gold bottomed on a wave iii today and going up in a wave iv right now at 1084 and then will go down to 1067 in wave v before going way up.
If gold is still up at open I may sell GDX and wait for it to drop towards 1067
If already dropped to 1067 at open then I’ll buy some more GDX or maybe NUGT for the way up.
Expecting a pullback (drop) from under 1090 to target a break below 1062, lets see (needs to break below 1071 first!)….
Today there is divergence between gold price and miners. Miner indices broke to downside. HMMMMM
Lara: is alternate ii in today’s report is a daily wave count of weekly ending contracting diagonal count from Jan 13 2016 report?
AND alt i appears to be discarded.
Exactly.
Because it does not violate any EW rules.
Off topic a little, but I respect your opinions and knowledge. I have to refund my Tallinex account because the broker said I was stopped out. The daily summary showed I had a balance at the days closing @5:00EST. But the next days summary showed I had oo balance. I admit I was pressing to not have to add to the balance but with what I had I had gotten away with it before. But my broker said that the banks increased the margin there at the closing of the days session and even though the account was hedged, my margin dropped below 100%. So do any of you think I need to find another broker or do I lick my wounds and continue?
I thought I heard of increased requirements last year to cover margins.
If that is your only issue and a rare one then stay.
If multiple problems with broker then find a better one before you leave
My advice would be don’t try to trade with an underfunded account.
Even with margin requirements your account is most likely allowing you to trade on leverage.
So fund it properly. And apply good risk management to every single trade in terms of how much of your account you risk. No more than 5%, preferably no more than 3%.
Risk management is the single biggest difference between professional traders who make a living from trading, and everyone else. Good risk management can turn a poor strategy into a profitable strategy.
But you can’t do it with an underfunded account.