
Elliott wave and traditional technical analysis of NZDUSD.
New updates to this analysis are in bold.
ELLIOTT WAVE COUNT
Click chart to enlarge.
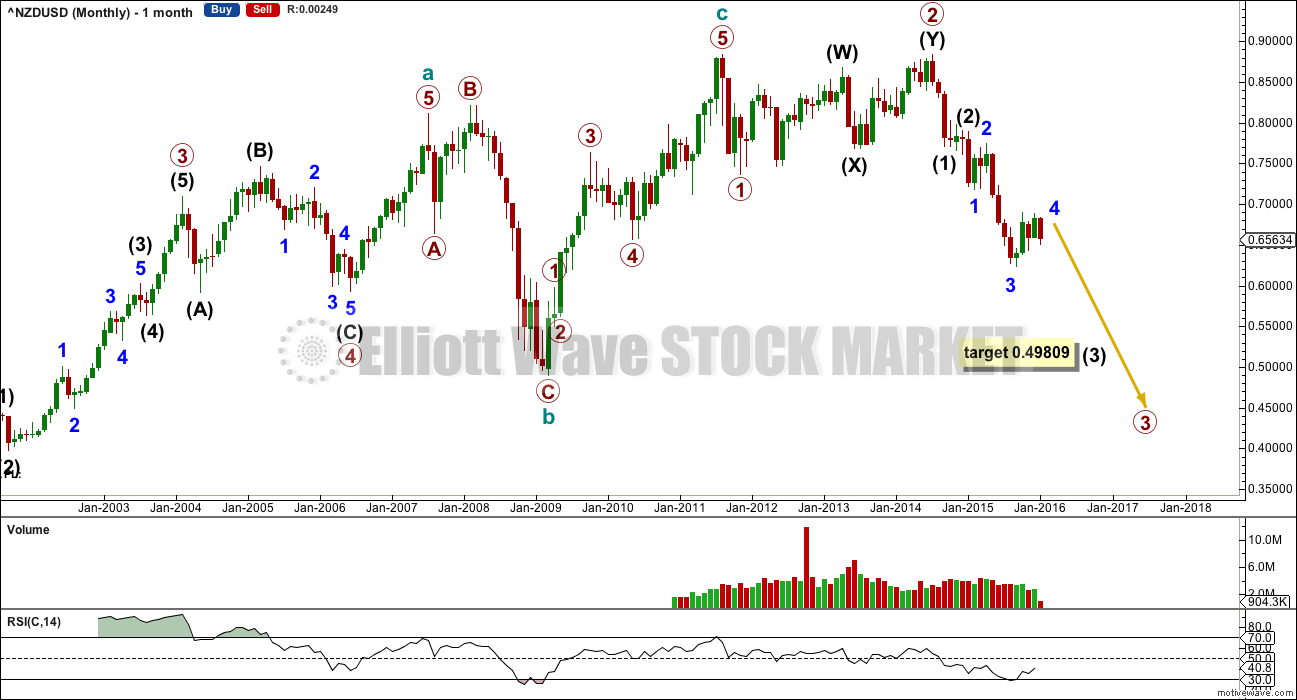
Primary 3 should end when RSI indicates oversold and most likely not before. Currently RSI has returned just above oversold.
Primary 3 would reach 2.618 the length of primary 1 at 0.49809. The structure of primary 3 is incomplete.
Click chart to enlarge.
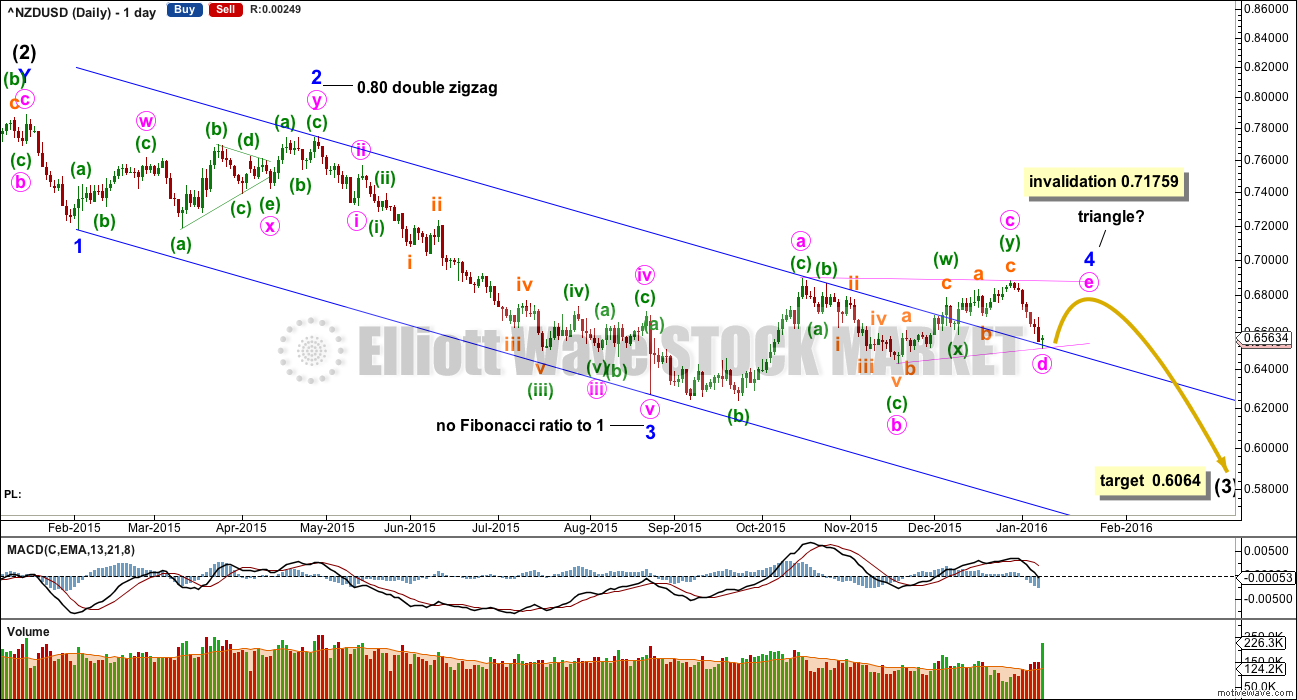
Within intermediate wave (3), minor waves 1, 2, and 3 are most likely complete. Minor wave 4 is now seen as an incomplete triangle.
There is no Fibonacci ratio between minor waves 3 and 1.
At 0.60604 intermediate wave (3) would reach 1.618 the length of intermediate wave (1).
Minor waves 2 and 4 exhibit alternation: minor wave 2 was a deeper double zigzag and minor wave 4 is a more shallow triangle.
Minor wave 4 is breaching a channel drawn about this movement using Elliott’s first technique. The channel may be redrawn when the triangle is complete.
The triangle will only remain valid if price remains below the high of minute wave c within it. Minute wave e is most likely to end short of the a-c trend line, and it may not move above the end of minute wave c at 0.68824. If price breaks above this point, then minor wave 4 is morphing into a combination.
The structure of minor wave 4 is incomplete.
To the downside, if minute wave d of the triangle moves lower, then it may not move substantially below the end of minute wave b below 0.64292. A new low below that point would indicate that minor wave 4 is most likely over and the downwards trend has resumed.
TECHNICAL ANALYSIS
Click chart to enlarge.
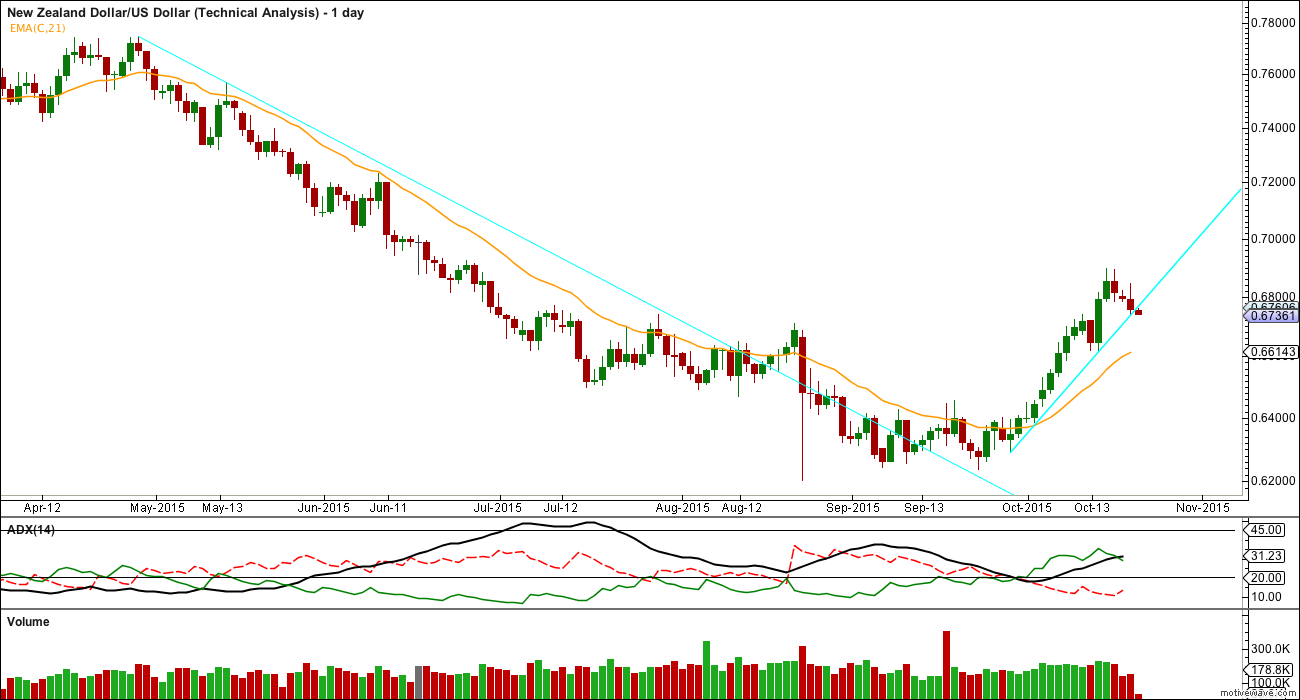
ADX is flattening off in recent days indicating the market is range bound not trending. This supports the Elliott wave count.
ATR agrees. It is flat to declining. This indicator at this time is clearer than ADX. The market is not currently trending.
As price rises, it comes on a decline in volume. As price falls, it comes on a rise in volume. This volume profile is bearish and supports the Elliott wave count in terms of overall expected direction.
When NZDUSD trends it tends to find resistance at the 21 day EMA. Currently, it is whipsawing about this EMA, typical of a consolidating market.
My only concern with the volume profile is volume is not overall declining as price moves sideways. An overall decline in volume would be expected, if a fourth wave triangle is unfolding. I expect surprises may be to the downside for this market at this time because the last fall in price came on an increase in volume.
At the daily chart level, RSI is not oversold.
This analysis is published @ 10:17 p.m. EST.