
Elliott wave and traditional technical analysis of NZDUSD.
New updates to this analysis are in bold.
ELLIOTT WAVE COUNT
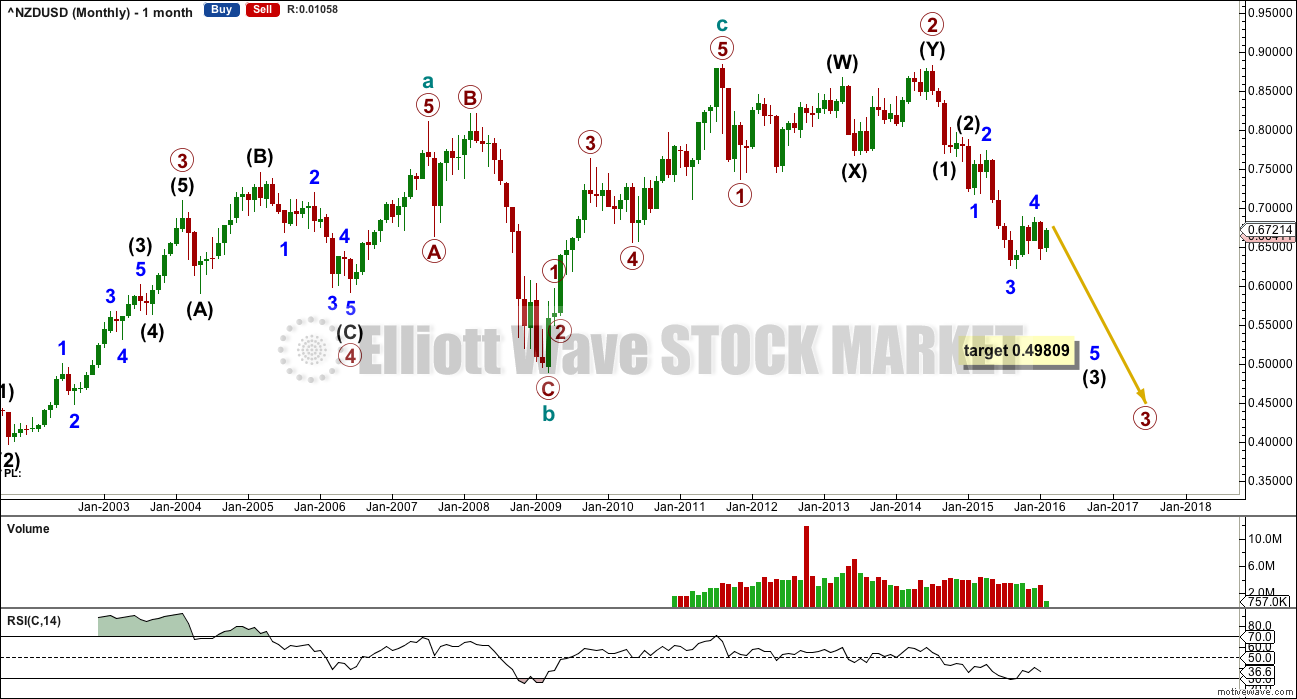
Click chart to enlarge.
Primary 3 should end when RSI indicates oversold and most likely not before. Currently RSI has returned just above oversold.
Primary 3 would reach 2.618 the length of primary 1 at 0.49809. The structure of primary 3 is incomplete.
The bigger picture indicates the trend should still be down. The structure is incomplete. So far within primary wave 3 each time price falls volume rises. January again saw a fall in price on increased volume. While the volume profile at the daily chart level is less clear, the monthly chart volume profile is more clear which gives confidence that the larger trend should still be down.
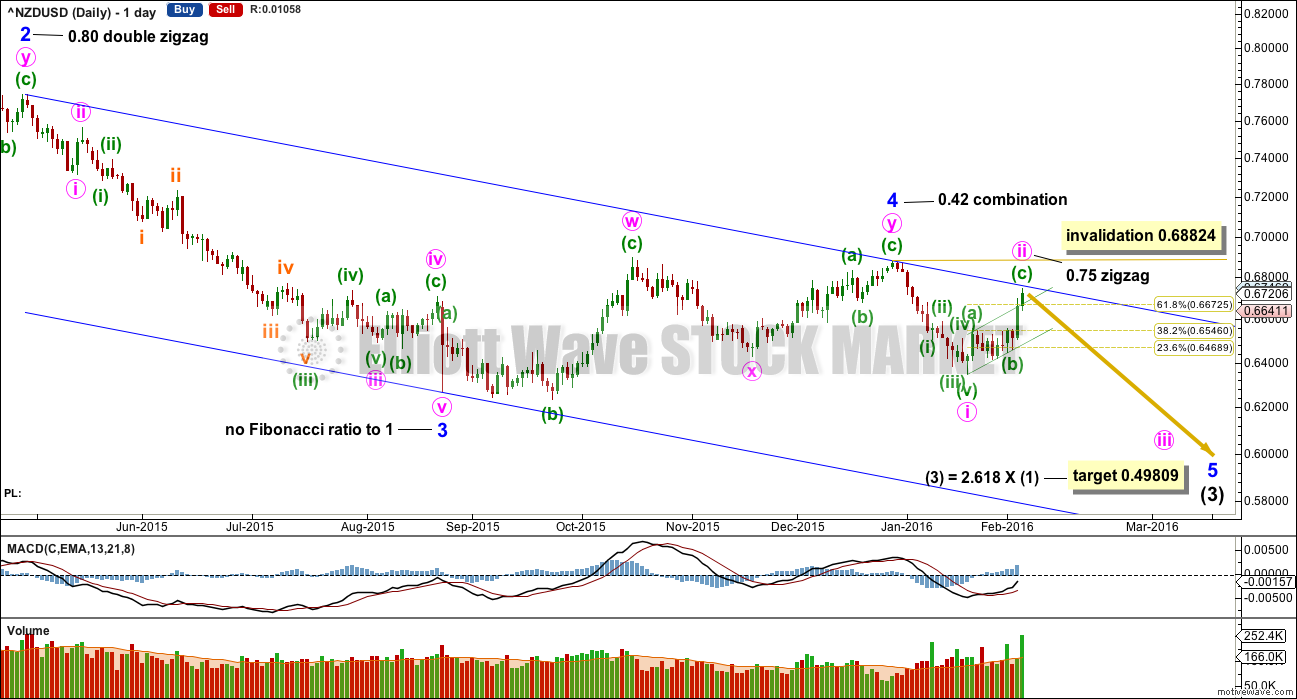
Click chart to enlarge.
Minor waves 1, 2, 3 and now 4 are complete within intermediate (3). Minor 4 did not complete as a triangle and morphed into a combination. There is perfect alternation with minor waves 2 and 4.
Minute ii has come up to touch the 2-4 trend line. This may present a good opportunity to join the trend at a good price with low risk.
Sometimes the Kiwi exhibits volume spikes at the end of its movements. It did this several times in this chart. This may be because the New Zealand economy is heavily reliant upon dairy which is a commodity, so the currency may have some commodity like behaviours (this is my theory only).
The volume spike today may indicate an end to this upwards movement as price finds strong resistance at the trend line.
With minute ii such a deep time consuming correction, it looks like minor 5 may be extending (another commodity like behaviour). The target for it to complete intermediate wave (3) will remain the same at 0.49809 which would expect a long extension.
TECHNICAL ANALYSIS
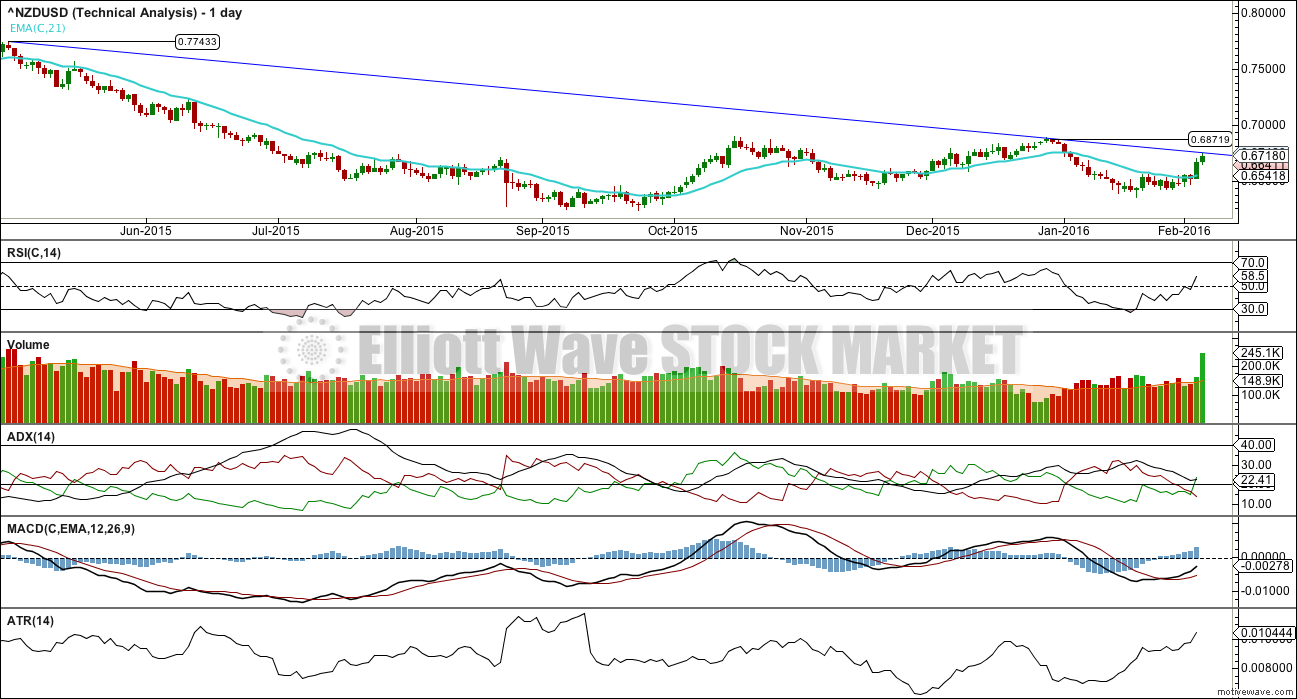
Click chart to enlarge.
ADX today has turned up to indicate a new upwards trend. This does not support the Elliott wave count.
ATR is increasing, indicating a new trend.
This upwards movement has resolved RSI being oversold. It is not yet overbought. There is room for the market to rise.
As price rises for the last two days volume increases supporting the rise in price. Yet, sometimes the Kiwi exhibits a rise in volume with a rise in price for short term corrections and a volume spike at the end of a correction. This could be happening again (the session for the last daily candlestick may also not have finalised volume data; this spike may not be relied upon as it may disappear when the sessions data is final).
Overall, the regular technical analysis picture does not support the Elliott wave count as much as I would like for confidence. If the dark blue trend line is clearly breached, that would be a warning that the Elliott wave count may be wrong.
The strongest piece of analysis on this chart is the dark blue trend line. It is reasonably shallow and long held. It should offer strong resistance.
This analysis is published @ 05:20 p.m. EST.