
Last week’s analysis expected downwards movement for Silver for a correction.
This is what has happened over the last few days.
Summary: The trend is up. Silver may end a correction soon. If Silver finds support at the lower trend line on the daily chart, then look for the correction to be over.
New updates to this analysis are in bold.
WEEKLY WAVE COUNT
Click chart to enlarge.
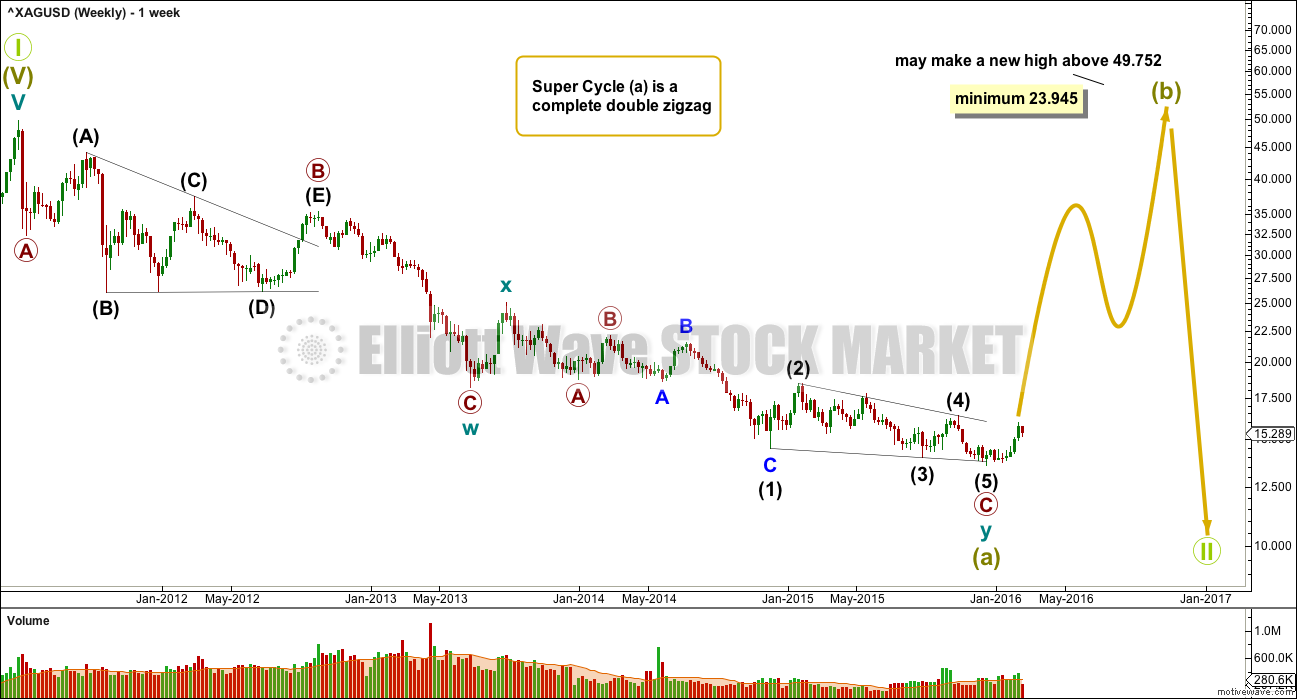
If super cycle wave (a) is a double zigzag, then within the second zigzag of the double labelled cycle wave y the structure may be complete.
Primary wave C is an ending contracting diagonal within the zigzag of cycle wave y. All subwaves subdivide as zigzags. The third wave is shorter than the first, the fifth wave is shorter than the third, and the fourth wave is shorter than the second. The trend lines converge.
There is a small overshoot of the (1)-(3) trend line at the end. This indicates the contracting diagonal structure is very likely to be complete.
If this wave count is correct, then super cycle wave (a) has subdivided as a three wave structure. That indicates Grand Super Cycle wave II may be a flat correction.
If this correction at Grand Super Cycle is a second wave (as opposed to a fourth wave), then a triangle may be eliminated.
A combination may also be eliminated because the first wave is a multiple. Combinations may only consist of a maximum of three corrective structures, so within each of W, Y and Z they may only subdivide into simple A-B-C structures (or A-B-C-D-E in the case of triangles). To label multiples within multiples increases the maximum beyond three, violating the rule.
Super Cycle wave (b) must retrace a minimum 90% of super cycle wave (a) at 23.945. Super cycle wave (b) may make a new price extreme beyond that seen for super cycle wave (a) above 49.752 as in an expanded flat.
Super cycle wave (b) may be any one of 23 possible corrective structures. It is impossible to predict at this early stage which one it will be, only to say it is unlikely to be a rare structure such as a running flat, expanding triangle or triple combination. That still leaves multiple structural possibilities. The most likely structure which would be able to meet the minimum price requirement at 23.945 is a zigzag.
The first movement up for a wave of this large degree must subdivide as a clear five at the daily chart level, and probably at the weekly chart level also.
DAILY WAVE COUNT
Click chart to enlarge.
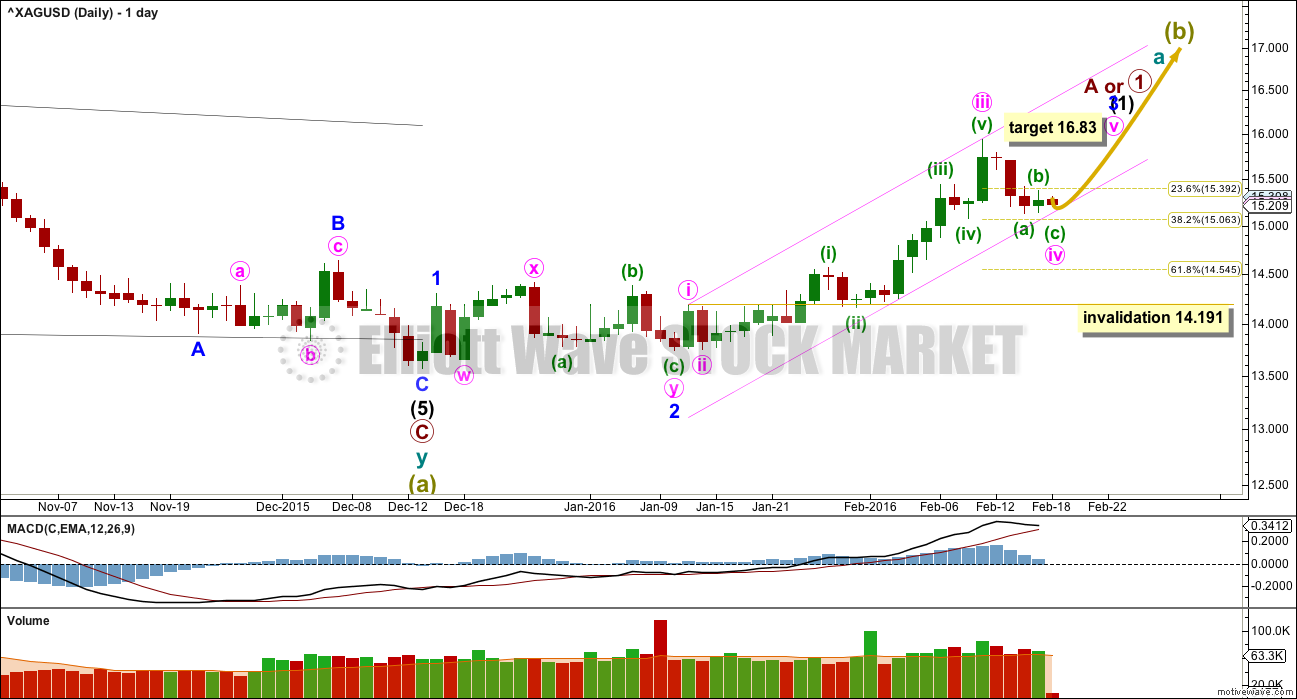
If there has been a trend change at super cycle degree, then a clear five wave structure upwards must develop. This would still be incomplete.
The fist five up may be unfolding as an impulse. The third wave for minor wave 3 is still incomplete. At 16.83 minor wave 3 would reach 4.236 the length of minor wave 1. When minute wave iv within minor wave 3 is complete, then the target may also be calculated at minute degree. At that stage, it may widen to a zone or it may change.
Minute wave iv may look like a clear three wave structure at the daily chart level to have the most typical look. So far minuette wave (a) within it may be complete. Minuette wave (b) may or may not be complete. If minute wave iv completes in one more day with a red candlestick, then it would have a most typical look. Minute wave iv may find support at the lower edge of the best fit pink channel.
Minute wave iv may not move into minute wave i price territory below 14.191.
Silver tends to have swift strong fifth waves which force the prior fourth wave to be quick and shallow. Minute wave v to end minor wave 3 may be very strong. Look out for surprises in this market to the upside at this stage.
TECHNICAL ANALYSIS
WEEKLY CHART
Click chart to enlarge. Chart courtesy of StockCharts.com.
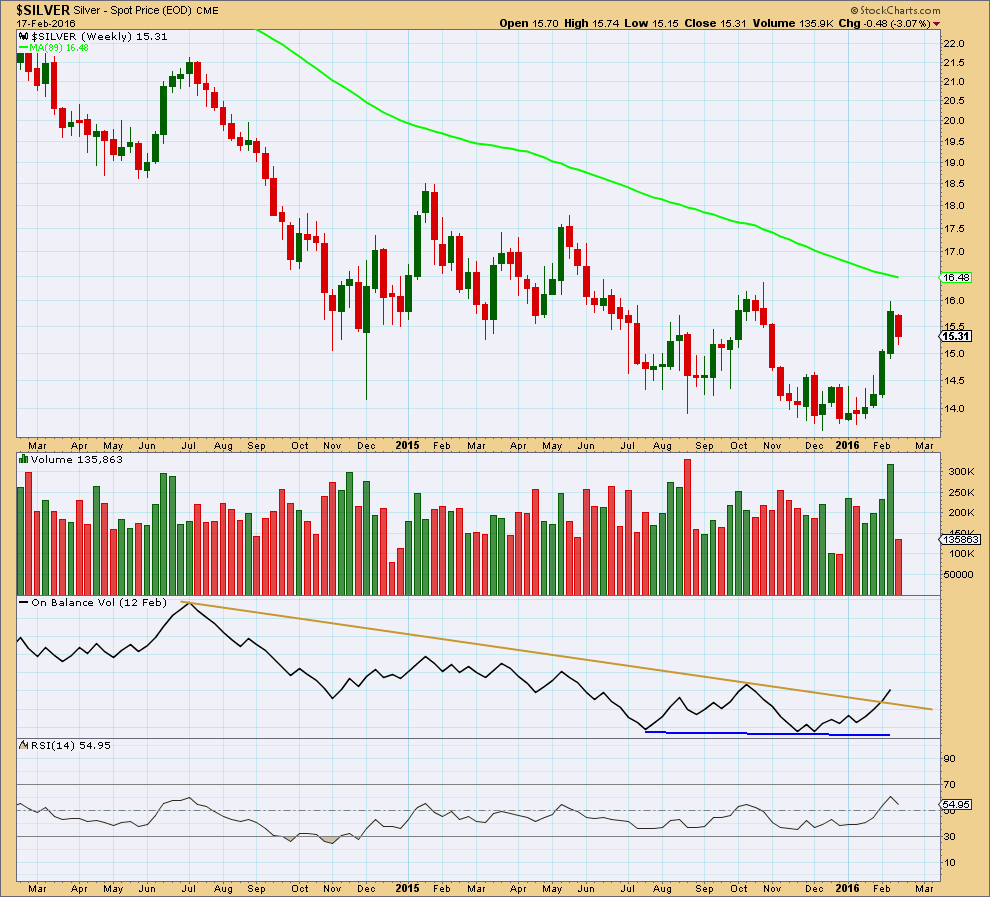
The last three upwards weeks came with clearly and strongly increasing volume. This strongly supports the Elliott wave count. However, the weekly data shown here has seen this happen before yet Silver turned about to make new lows. It appears that volume data is not as reliable for Silver as it may be for other markets.
At the weekly chart level, On Balance Volume may be more reliable for Silver. This week OBV has breached the reasonably long held brown trend line. This is a fairly strong bullish indicator.
RSI is not yet overbought, so there is still room for price to rise.
DAILY CHART
Click chart to enlarge. Chart courtesy of StockCharts.com.
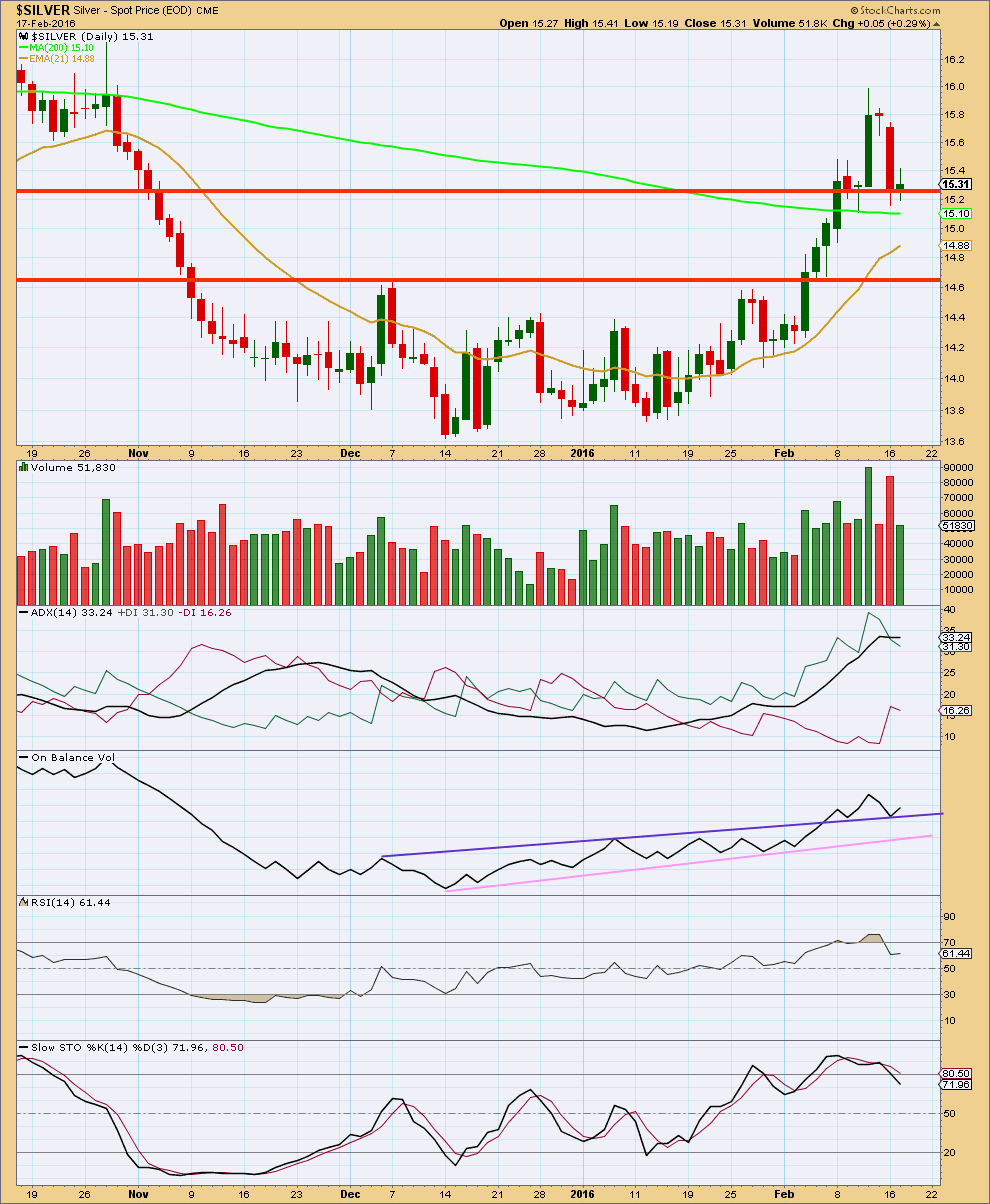
Silver had a typical blow off top and is now correcting. Price is finding some support about the red horizontal trend line and at the 200 day moving average.
This correction has resolved RSI being overbought. Stochastics is returning from overbought.
ADX is flat indicating the market is not currently trending; it is consolidating. ADX does not indicate a trend change. If the trend resumes, it should still be up.
On Balance Volume is finding support at the purple trend line. This may assist to hold up price and keep this correction from moving much if any lower. If the purple trend line on OBV is breached, then the pink trend line is very close by. This suggests that the correction for Silver may be shallow and may be close to its low.
This analysis supports the Elliott wave count. The correction should be expected to end soon.
An upwards day with an increase in volume would provide confidence that the upwards trend has very likely resumed.
This analysis is published @ 03:24 a.m. EST on 18th February, 2016.