
Last week expected a correction to end soon.
The correction has continued for the entire week.
Summary: The trend is up. Silver should end a correction very soon, a further four daily candlesticks at the most. With the Elliott channel breached, a simple trend line is added for support. Volume is of concern though because it is indicating a downwards breakout from this consolidation.
New updates to this analysis are in bold.
WEEKLY WAVE COUNT
Click chart to enlarge.
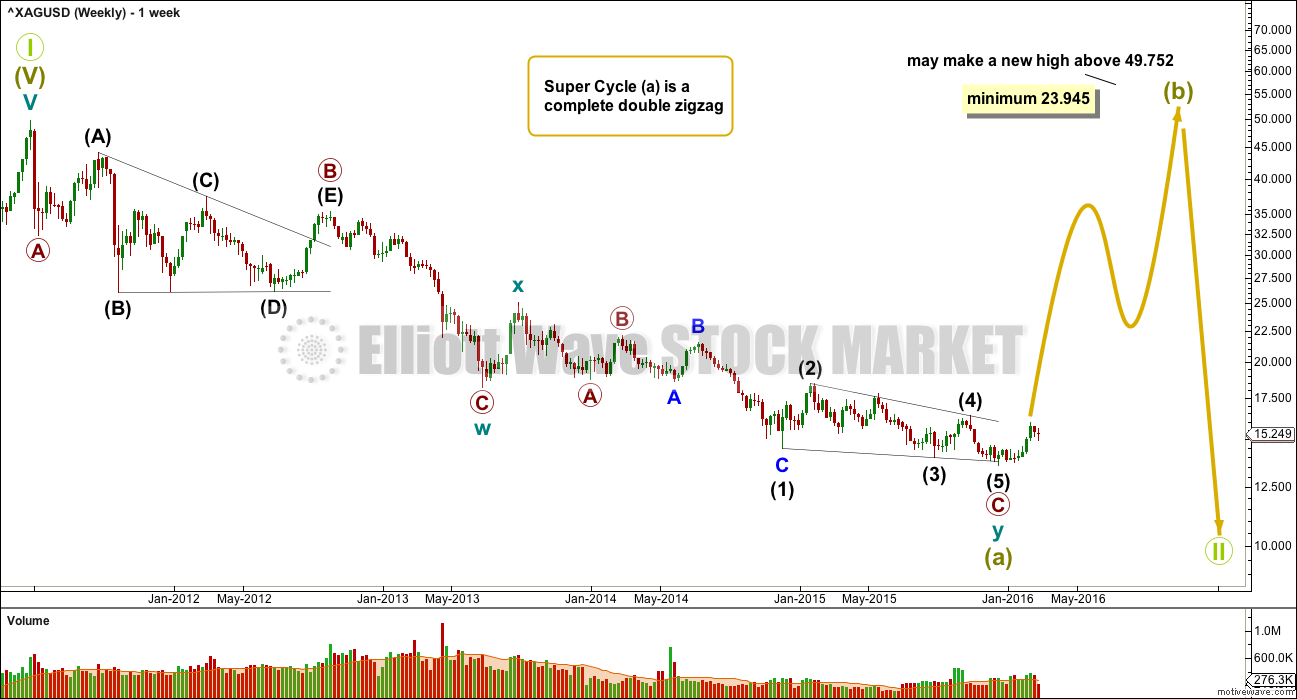
If super cycle wave (a) is a double zigzag, then within the second zigzag of the double labelled cycle wave y the structure may be complete.
Primary wave C is an ending contracting diagonal within the zigzag of cycle wave y. All subwaves subdivide as zigzags. The third wave is shorter than the first, the fifth wave is shorter than the third, and the fourth wave is shorter than the second. The trend lines converge.
There is a small overshoot of the (1)-(3) trend line at the end. This indicates the contracting diagonal structure is very likely to be complete.
If this wave count is correct, then super cycle wave (a) has subdivided as a three wave structure. That indicates Grand Super Cycle wave II may be a flat correction.
If this correction at Grand Super Cycle is a second wave (as opposed to a fourth wave), then a triangle may be eliminated.
A combination may also be eliminated because the first wave is a multiple. Combinations may only consist of a maximum of three corrective structures, so within each of W, Y and Z they may only subdivide into simple A-B-C structures (or A-B-C-D-E in the case of triangles). To label multiples within multiples increases the maximum beyond three, violating the rule.
Super Cycle wave (b) must retrace a minimum 90% of super cycle wave (a) at 23.945. Super cycle wave (b) may make a new price extreme beyond that seen for super cycle wave (a) above 49.752 as in an expanded flat.
Super cycle wave (b) may be any one of 23 possible corrective structures. It is impossible to predict at this early stage which one it will be, only to say it is unlikely to be a rare structure such as a running flat, expanding triangle or triple combination. That still leaves multiple structural possibilities. The most likely structure which would be able to meet the minimum price requirement at 23.945 is a zigzag.
The first movement up for a wave of this large degree must subdivide as a clear five at the daily chart level, and probably at the weekly chart level also.
DAILY WAVE COUNT
Click chart to enlarge.
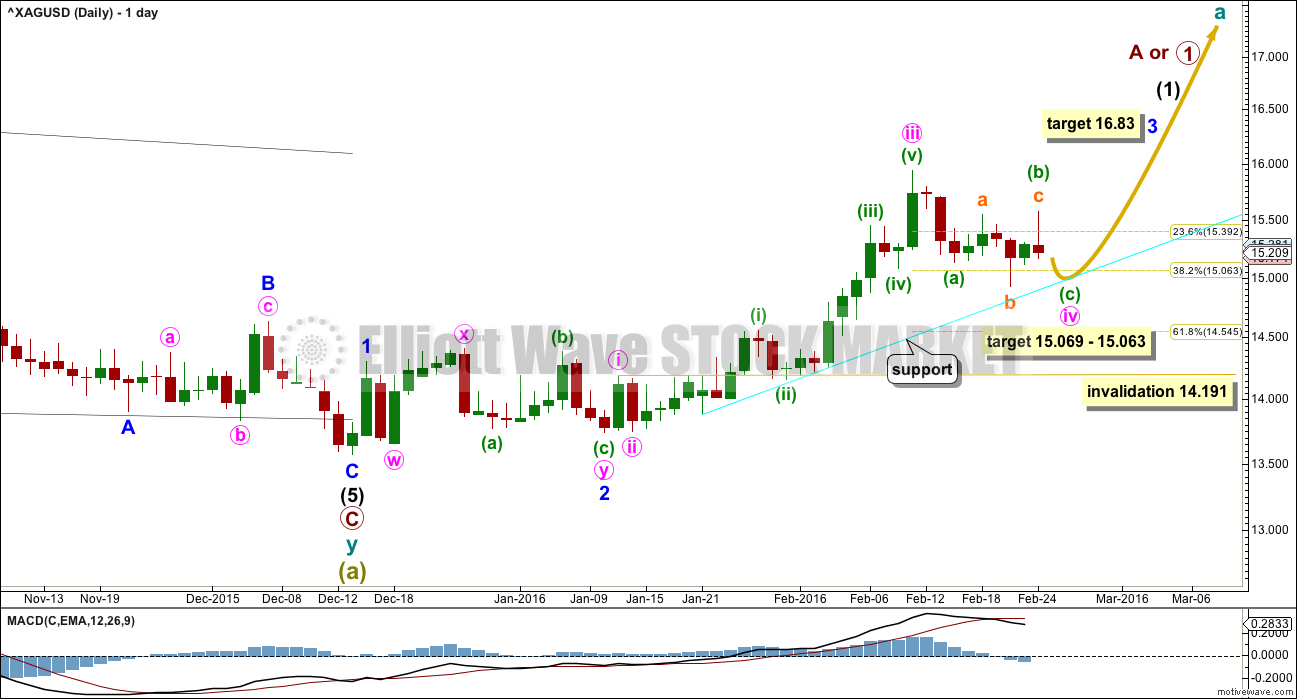
If there has been a trend change at super cycle degree, then a clear five wave structure upwards must develop. This would still be incomplete.
At this stage, due to the duration, this sideways consolidation looks like it may need to be labelled one degree higher. For now it makes no difference to the expected direction of price, so I will leave it as is. Silver just does not always have nice proportions; I will let Gold lead the way.
So far this correction looks like it may be an almost complete zigzag. Within the zigzag, minuette wave (b) is typically complicated and fits as an expanded flat.
At 15.069 minuette wave (c) would reach 0.618 The length of minuette wave (a). This is very close to the 0.382 Fibonacci ratio at 15.063 giving a small 0.006 target zone.
This correction broke out of the pink channel drawn in last week’s analysis. Silver does not always sit nicely within channels, and sometimes fourth waves breach channels. The cyan trend line is drawn to touch several daily candlesticks, so it is repeatedly tested. It has reasonable technical significance. If price comes to touch it again, it is very likely to bounce up from there.
Minute wave iv may not move into minute wave i price territory below 14.191.
TECHNICAL ANALYSIS
DAILY CHART
Click chart to enlarge. Chart courtesy of StockCharts.com.
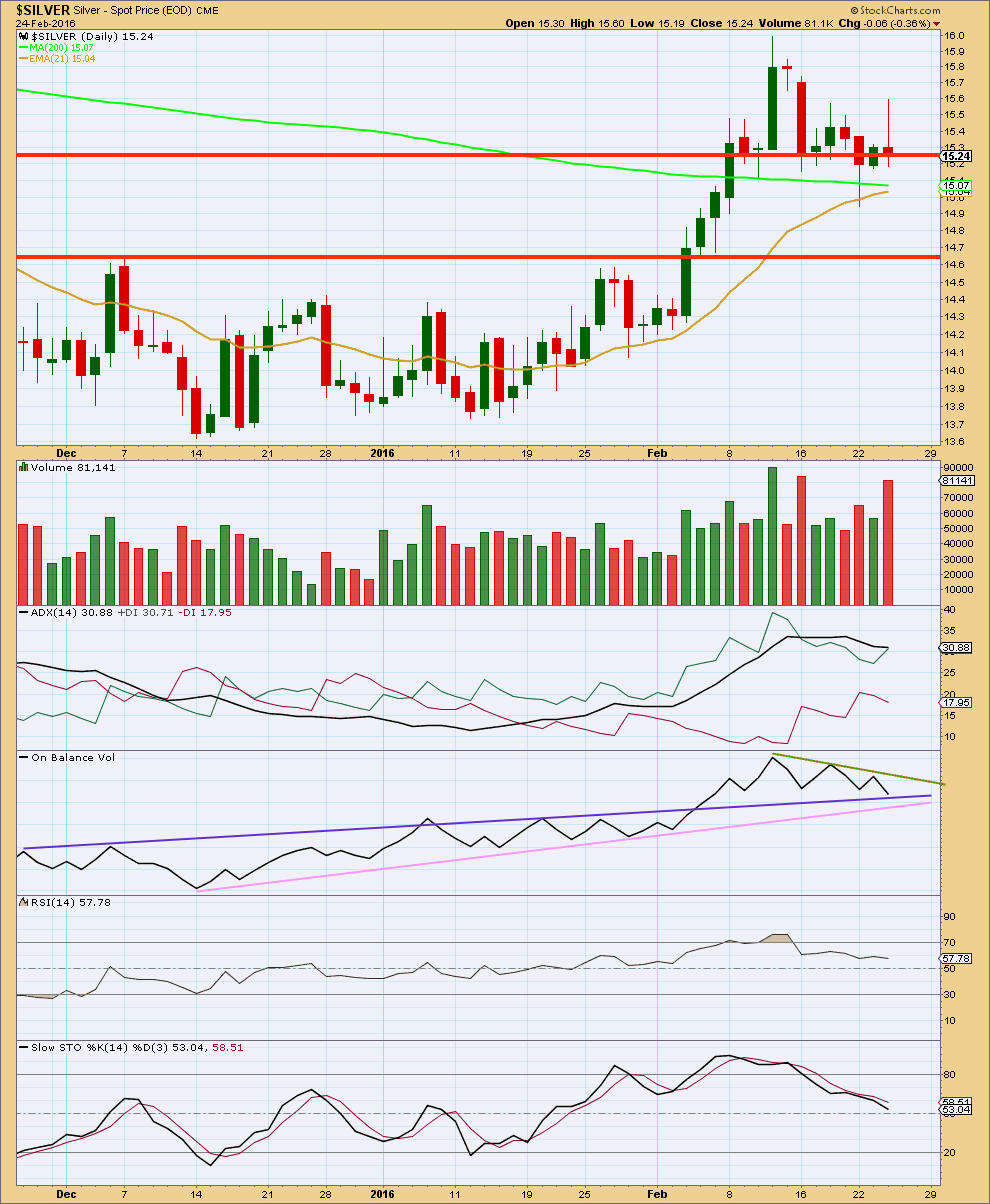
During this sideways consolidation, it is now two downwards days which have clearly stronger volume. This indicates a downwards breakout is more likely than upwards. However, in looking back over the last years price action volume is not a reliable indicator of breakout direction for Silver. It sometimes works, but almost as often it does not. In this case, because the volume is for two days and is very strong, it should be taken notice of. This does not support the Elliott wave count. Caution is advised with any long positions. Manage risk carefully.
On Balance Volume has not yet indicated a possible breakout direction and remains bound within trend lines. A break above or below any of the lines would indicate the direction of price breakout.
ADX is flat indicating no clear trend. The +DX line remains above the -DX line, so if the trend returns it should be up.
This correction has returned RSI from overbought. There is room for the market to rise or fall.
Stochastics has returned from overbought. It is not yet oversold, so some more downwards movement should be expected to continue until it is, and until price finds support at the same time. Price is finding support about the 21 day moving average.
This analysis is published @ 11:18 a.m. EST.