Last week’s analysis expected to see 8 sessions of overall upwards movement to a target at 31.47 or 34.16.
Price moved higher for 7 sessions to reach 34.82.
Summary: The correction for minor wave 4 is very likely to be over. This would be confirmed with a clear breach of the small channel that contains it. The target for the next wave down is 26.87 – 26.1. If this target is wrong, it may not be low enough.
New updates to this analysis are in bold.
MONTHLY ELLIOTT WAVE COUNT
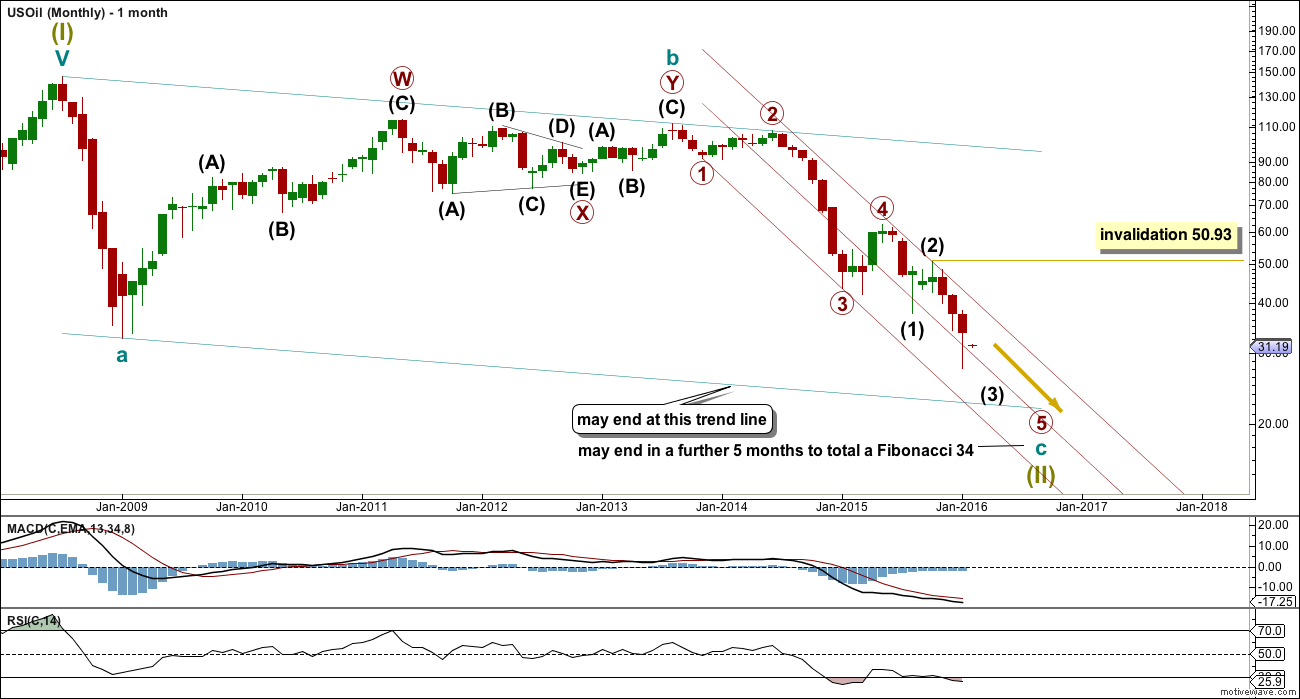
US Oil has been in a bear market since August 2013. While price remains below the upper edge of the maroon channel drawn here and below the 200 day simple moving average it must be accepted that the bear market most likely remains intact.
The structure of cycle wave c is incomplete.
This wave count sees US Oil as within a big super cycle wave (II) zigzag. Cycle wave c has moved below cycle wave a at 32.70 avoiding a truncation. At this stage, as soon as the structure for cycle c could be seen as complete an alternate wave count expecting an end to the Oil bear market would be published. That cannot be done yet because the structure is incomplete. Primary wave 5 has to unfold lower.
When the structure is complete and an alternate bull wave count is published, then it would come with the strong caveat that it is an alternate until there is technical confirmation of a trend change. That confirmation would be a breach of the maroon channel or a break above the 200 day moving average, or both.
Within cycle wave c, primary wave 5 is expected to be extended which is common for commodities.
No second wave correction may move beyond the start of its first wave above 50.93 within intermediate wave (3).
Draw a channel about this unfolding impulse downwards. Draw the first trend line from the lows labelled primary waves 1 to 3, then place a parallel copy up not the high labelled intermediate wave (2), so that all movement is contained. Add a mid line. Copy the channel over to the daily chart.
The wider teal green channel is drawn about this whole correction. Cycle wave c may end when price finds support at the lower edge of this channel. But sometimes these channels are breached by C waves, particularly if the C wave has a swift strong extended fifth wave to end it. How price behaves when it gets to the lower teal trend line, and how complete the structure is at that stage, will indicate if price may stop there or if it would continue.
DAILY ELLIOTT WAVE COUNT
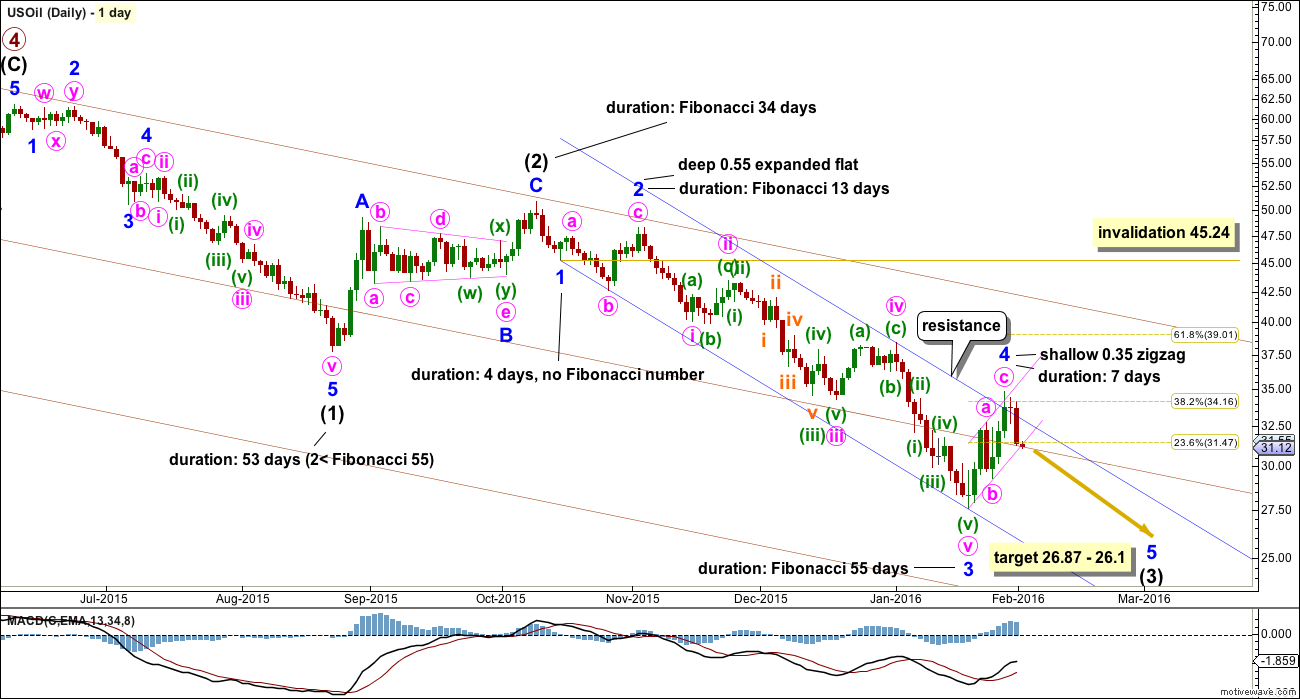
Within intermediate wave (3), minor wave 3 shows an increase in downwards momentum beyond that seen for minor wave 1. But intermediate wave (3) has not yet seen an increase in momentum beyond that seen for intermediate wave (1). A further increase in downwards momentum should be expected.
Minor wave 2 was a deep expanded flat which lasted a Fibonacci 13 days. Alternation between minor waves 2 and 4 should be expected. If minor wave 4 is over now, then it would be a shallow zigzag lasting 7 days, one short of a Fibonacci 8. This gives the wave count the right look and provides perfect alternation in both structure and depth.
Within minor wave 4, minute wave c is just 0.38 longer than equality in length with minute wave a.
Minor wave 4 has slightly overshot the channel which is drawn using Elliott’s first technique. This is another indicator that it is likely to be over.
Draw a channel about the zigzag of minor wave 4 (pink lines). When this channel is clearly breached by a full daily candlestick below and not touching the lower edge, that shall provide trend channel confirmation that minor wave 4 is very likely to be over. When that channel is breached price may throwback to the lower line. If price behaves like that, then it may offer a perfect entry at a good price with low risk.
When the channel is breached, then the invalidation point may be moved down to the end of minor wave 4. For now the risk will remain that minor wave 4 may not be over and may continue higher. It may not move into minor wave 1 price territory above 45.24.
Typical of commodities, US Oil often will exhibit very swift strong fifth waves. That means that the strongest part of downwards movement may be ahead, and this tendency is particularly strong for fifth waves to end third waves. My targets may be too high; minor wave 5 to end intermediate wave (3) may be a strong extension.
At 26.87 minor wave 5 would reach 0.382 the length of minor wave 3. At 26.1 intermediate wave (3) would reach equality in length with intermediate wave (1). This gives a 0.77 target zone calculated at two wave degrees. If this target is wrong, it may not be too high. For this reason I also provide lower calculated targets.
At 14.02 minor wave 5 would reach equality in length with minor wave 3. At 11.98 intermediate wave (3) would reach 1.618 the length of intermediate wave (1). If the first target zone of 26.87 – 26.1 is met and passed, then the next target would be 14.02. If that target is met and passed, then the next target would be 11.98.
Minor wave 1 lasted 4 days (not a Fibonacci number). Minor wave 3 lasted exactly a Fibonacci 55 days. If the first target zone is met, then minor wave 5 may last a Fibonacci 21 days. If the lower targets are met, then minor wave 5 may last a total Fibonacci 55 days. (Note: I am counting only trading days and not calendar days).
TECHNICAL ANALYSIS
DAILY CHART

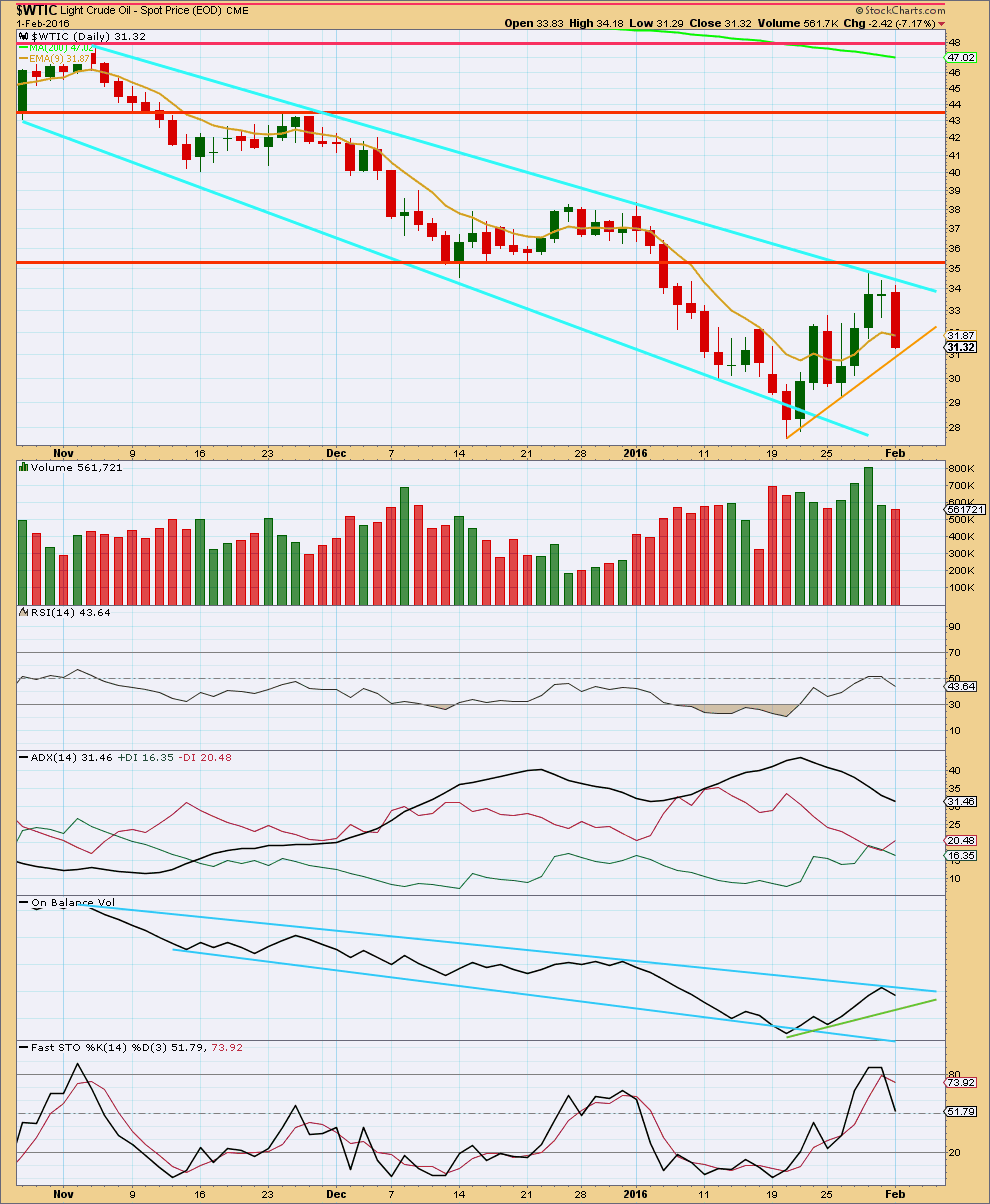
Click chart to enlarge. Chart courtesy of StockCharts.com.
As price rose to the last high, it came on increasing volume. This does not look corrective but looks impulsive. For this reason it is essential that confirmation of a change by a channel breach is used before any confidence may be had that the correction is over.
The gold trend line along the lower edge of this correction must be clearly breached by a full daily candlestick before any confidence may be had that this upwards movement is over. This line is the same as the lower edge of the pink channel on the daily Elliott wave count.
RSI has not reached an extreme. It is neutral and shows no divergence with price.
ADX is declining from an extreme. This indicates the market is not trending. Importantly, the -DX line remains above the +DX line, so ADX has not indicated a trend change.
On Balance Volume often leads the way with trend lines. It has found resistance at the upper blue line and moved lower from there. The strength of that line is reinforced. The short term green line is added this week. If OBV breaks below that line, it shall provide some confidence in the Elliott wave count.
Stochastics has reached overbought and is returning. This supports the idea of at least some downward movement for a downwards swing to continue until price finds support and Stochastics reaches oversold.
This analysis is published @ 12:49 a.m. EST on 2nd February, 2016.


Hi Lara
Is triangle option gaining in probability?
I just saw your comment on gold thread. So if its a triangle expecting maybe a day of up movement before downward break. And if I remember you say breakouts from triangles are short and fast?
Your questions will be answered in the analysis. I’m writing it now.
I’m charting it. It just does not look right.
Head and Shoulders pattern supports EW count.
At right shoulder32.68 in 4 hour period chart of WTIC added short position and plan to add short once alert from Lara to go short today!!!!
In short: the oil price war is about to enter its far more vicious, and far more lethal phase, and while it is unclear who ultimately wins, whether it is Shale or the Saudis, the loser is clear: anyone who bought into bets of an imminent oil bounce.
By Zerohedge
http://oilprice.com/Energy/Crude-Oil/Why-US-Shale-Is-Not-Capitulating-Yet.html
At the high of minor 4 there is an evening doji star reversal pattern.
Price has again come up to touch the parallel copy of the dark blue line which is drawn on this chart. And price has moved strongly lower from there.
I will be looking to try another short entry for Oil about here.
Thanks Lara. I appreciate these short updates!
Lara: Once again Stockcharts .com chart for WTIC is showing a gap and close at 33.38.
In Pmbull oil is still trading at 31.63 at 5.30 PM EST.
I can’t see a close at 33.38?
3rd Feb closed at 32.75
4th Feb closed at 31.69
WTIC on StockCharts
The move from 34.8 to 29.41 is a five wave structure in fib 3 days…is it possible that it might be minor 5..???
Minor Wave 5=Minor Wave 1..???
No. The truncation would be huge.
Ohhkkk
US oil will have a reversal candle pattern. May be??? Currently it is below the blue line.
Hi..
Yes this could be an opportunity to go short…
I find technical wave counts targets for ending this bear market are pretty unrealistic in fundamemtal sense as crude being a major commodity for world economy apart from any other commodity…
I personally feel that this minor 5 will be a contracting diagonal…a failed 5th wave…
Because theres still intermediate (5) to go…
Just a thought to share…
Takecare all
hi i am new in trading plz tell me trade price stoploss and target
This is an analysis service not a signal service.
You will not find instructions for trading here.
I cannot legally offer investment advice, I am not a registered investment advisor.
I am a CMT. I offer analysis.
Use it as one more tool in your decision making tool kit.
If you are new to trading I strongly suggest that this service may not be right for you. It will not teach you trading skills. This is better suited for more experienced traders.
Thanks Lara all your update.
US oil at critical point of reversal. Once a reversal candle is formed around RS 32.60 time to take small position below the blue line.
When I look today at Oil on the daily chart I notice that the pink channel didn’t provide resistance. The blue channel is now touched. Will that provide resistance?
My daily charts are on a semi-log scale, hourly charts should be on an arithmetic scale.
When the same channel is drawn on an hourly chart on an arithmetic scale the lower edge of the channel is not yet reached. At the hourly chart level this upwards movement looks like a typical throwback to a trend line… and that is my favourite entry set up.
Scale makes a difference.
And so… this so far is my conclusion for Oil today.
I can see a five down and now a three up on the hourly chart. I think this best fits as a first and second wave.
I am considering trying another short entry here or very soon… And if I do my stop will be set just above the end of minor 4 at 34.82. I will risk less than 5% of my equity only.
Next I want to spend a little time on the 5 minute chart. If I can see a completed impulse for the last C wave and if I see any indication of weakness (strong divergence, exhaustion gaps) then I may look for my entry then.
For now I have to do the Gold and S&P analysis. So back to Oil in another few hours. That’s okay, I don’t think it’s going to move much further in the next few hours. I’ll wait.
Thanks Lara for your comment.
Would you let us know the entry point??? Will appreciate.
Post below:
US Oil is forming top HnS in 4 hour period.
Right shoulder comes in at/around 32.30. Head at 34.8 and NL 29.20 across.
US Oil is trading at RS. 32.30. Watch for backtest per Lara and then I plan to short again.
A 4 hour reversal candle pattern will be nice clue here.
Well, my short was stopped out (no loss, I had moved my stop to break even).
Now I’ll wait for the next opportunity.
This strong upwards day has not found resistance at the lower edge of the small pink channel about minor wave 4. And that is a concern. Because of that I am not going to try and enter short again here.
Price may be going to find resistance now at the upper edge of the blue channel, or maybe at a parallel copy which should be placed on the high of minor wave 4 (because that overshot the channel slightly). I’ll watch the next couple of days to see how high this goes.
For now the wave count remains the same. Minor 4 is still most likely over. This upwards movement is most likely a second wave correction, invalidation would be the end of minor 4 / start of the first wave down which is at 34.82.
US Oil is forming top HnS in 4 hour period.
Right shoulder comes in at/around 32.30. Head at 34.8 and NL 29.20 across.
Looks like a great spot to go short.
I Dont know abt the head and shoulder papudi…was asking what wave count is to be labelled to this upmove
Oil bounced from 29.41…
Minnutte 2 or Minutte 4..??
Hi Lara, Could you please post an hourly chart of Minute wave c of Minor 4 for my learning? Having trouble seeing that as an impulse or diagonal. Thanks,
I would like Dreamer’s request too.
Sure. Here it is.
The fourth and second waves are disproportionate giving it an odd look.
But the important thing is at the daily chart level it has the right look.
I can’t see that movement fitting as a diagonal, but it will fit as an impulse.
And I really want to stress this: it is important to not get bogged down in too much detail. You could keep a wave count right down to the one minute chart level (I’ve done that before, no longer) and think that improves your analysis, but in my experience it does not.
I publish Oil once a week only. And I’m doing that for two reasons:
1. Time.
2. It fits my trading style and so I’m presenting this to fit that style. Enter and hold for weeks or months. To get the bigger movements. Not day trading.
When I publish hourly charts it attracts day traders and scalpers. Then I get requests for smaller and smaller time frames.
I’m not going to do that with Oil.
Focus on the overall look at the daily chart level and use trend lines. Keep it simple. Don’t worry too much about all the detail at lower time frames. Use that to check from time to time when necessary, but I’m not going to be keeping a wave count of all the detail at lower time frames. I don’t do that for my own trading, and I’m not going to be doing that for Oil.
Lara, your hourly chart and even more so your advice are greatly appreciated.
OK, thanks for the advice and the chart. Your hourly chart shows the entire movement as an impulse. So to get the hourly to match the ABC pattern on the daily for Minor 4 in its entirety, I took parts of your detail and reworked it. Now I think this would be a valid hourly chart for Minor 4. Thanks again!
PS – I’ll try to stay out of the mud, i.e. too much detail
Nice work.
Now that looks much better.
and has a better fit.
thank you
why oh why did I give you all a chart that saw it as an impulse? what was I thinking?
I have no answer
Hi Lara
Would a triangle for minor 4 mean alteration is achieved? Just trying to be prepared in case it doesnt head down.
Yes, it would.
A sideways meander in an ever decreasing range.
The only problem is it would take minor 4 well out of that channel. That is possible. But less likely.
Most awaited analysis…
THANKS for all your efforts LARA.. 🙂
As price rose to the last high, it came on increasing volume. This does not look corrective but looks impulsive. For this reason it is essential that confirmation of a change by a channel breach is used before any confidence may be had that the correction is over.
LARA can you please update us at any time when you personally feel confident that minor 4 is over..by just stating that
MINOR 4 MAY BE OVER..
It will be helpfull for new learners like me to understand the LIVE market trend…
Just a humble request…
Thanks again.. 🙂
Sure.
I’ve entered my own short position already for US Oil, about half an hour ago. My stop is just above the last pivot high.
I did that because there is a small breach of the lower trend line about the zigzag.
If the fourth wave continues sideways as a triangle I’ll just hold on.
Hey LARA thank u