Both Elliott wave counts remain valid.
Price should indicate which one is correct in the next one or two sessions.
Summary: It is most likely price will continue sideways for one to two sessions before resuming a downwards trend. If price breaks below 1,212.72 at any stage, then more confidence may be had in a downwards trend. A break above 1,240.65 would reduce the probability of a downwards trend and increase the probability of an upwards trend. A new high above 1,270.85 would confirm an upwards trend.
New updates to this analysis are in bold.
Last published weekly chart is here.
MAIN DAILY ELLIOTT WAVE COUNT
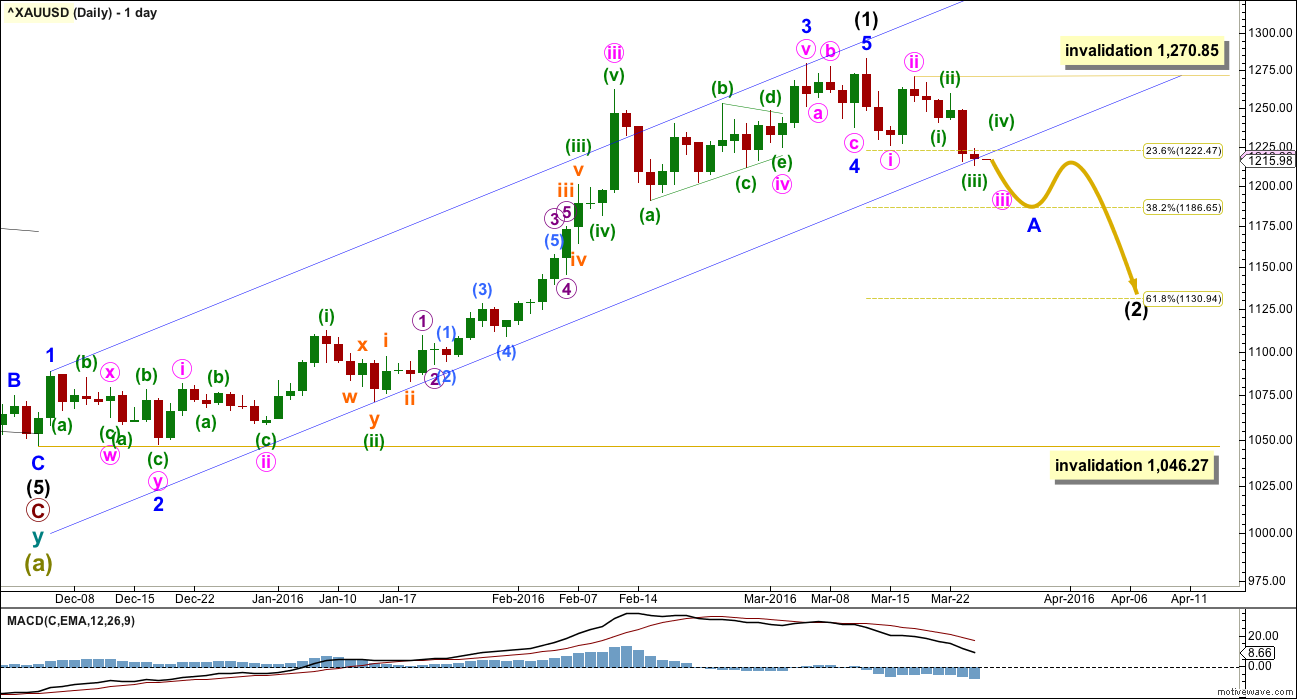
Intermediate wave (1) may be a complete impulse. Intermediate wave (2) may have begun. COT supports this wave count; the majority of commercial traders are currently short. While this does not pinpoint when price should turn, it does support a larger downwards trend about here.
This wave count is identical to the alternate wave count up to the end of minor wave 3 . Thereafter, this main wave count sees minor wave 4 over earlier as a regular flat correction. There is still alternation between minor waves 2 and 4: minor wave 2 is a deep 0.97 double zigzag and minor wave 4 is a shallow 0.18 regular flat. The proportions are not as good though: minor wave 2 lasted nine days and minor wave 4 only four days. This slightly reduces the probability of this wave count; the alternate will be published until it no longer has the right look.
Ratios within intermediate wave (1) are: there is no Fibonacci ratio between minor waves 1 and 3, and minor wave 5 is 2.95 points longer than equality with minor wave 1. This good Fibonacci ratio adds a little support for this wave count.
A movement at intermediate wave degree should begin with a five down on the daily chart. That is incomplete. Within minute wave iii, no second wave correction may move beyond the start of its first wave above 1,270.85.
It is extremely unlikely that intermediate wave (2) is over already, although the structure could be seen as complete. It has not breached the channel containing intermediate wave (1) and it should be expected to. It is far too shallow for the normal depth of a second wave, particularly the first second wave of a new trend. And finally, it is far too brief for an intermediate degree wave.
MAIN HOURLY ELLIOTT WAVE COUNT
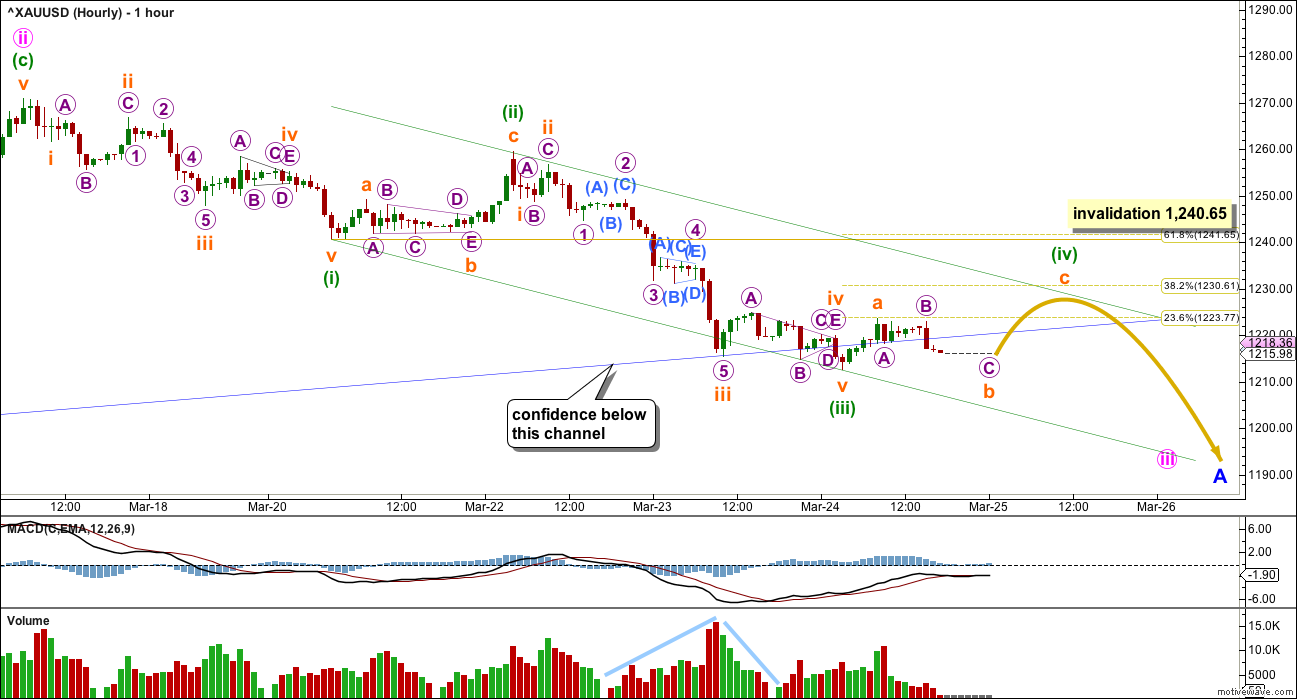
Minute wave iii should be unfolding as an impulse which is the only allowable structure for this third wave. Within the impulse, minuette wave (iii) is complete and 2.04 short of 1.618 the length of minuette wave (i).
Minuette wave (ii) was a deep 0.625 zigzag. Minuette wave (iv) may be expected to be shallow, most likely ending about the 0.382 Fibonacci ratio at 1,231. It is most likely to be a flat, combination or triangle. If it is an expanded flat (very common), combination or running triangle, then it may include a new low below 1,212.72 as part of the correction. A new low does not mean minuette wave (iv) is over.
The green channel is drawn using Elliott’s technique. Draw the first trend line from the ends of minuette waves (i) to (iii), then place a parallel copy on the end of minuette wave (ii). Expect minuette wave (iv) to most likely end if price comes up to touch the upper edge of the channel.
The following downwards movement for minuette wave (v) may end about the lower edge of the channel. However, sometimes Gold exhibits strong fifth waves which breach channels.
Minuette wave (ii) lasted one day. Minuette wave (iv) may be a little longer lasting as flats, combinations and triangles tend to be longer lasting structures than zigzags.
Minuette wave (iv) may not move into minuette wave (i) price territory above 1,240.65.
Although price is below the lower edge of the blue channel, it is not breached by convincing downwards movement; this movement is more sideways. The breach needs to be clearer for the alternate to be discarded.
ALTERNATE DAILY ELLIOTT WAVE COUNT
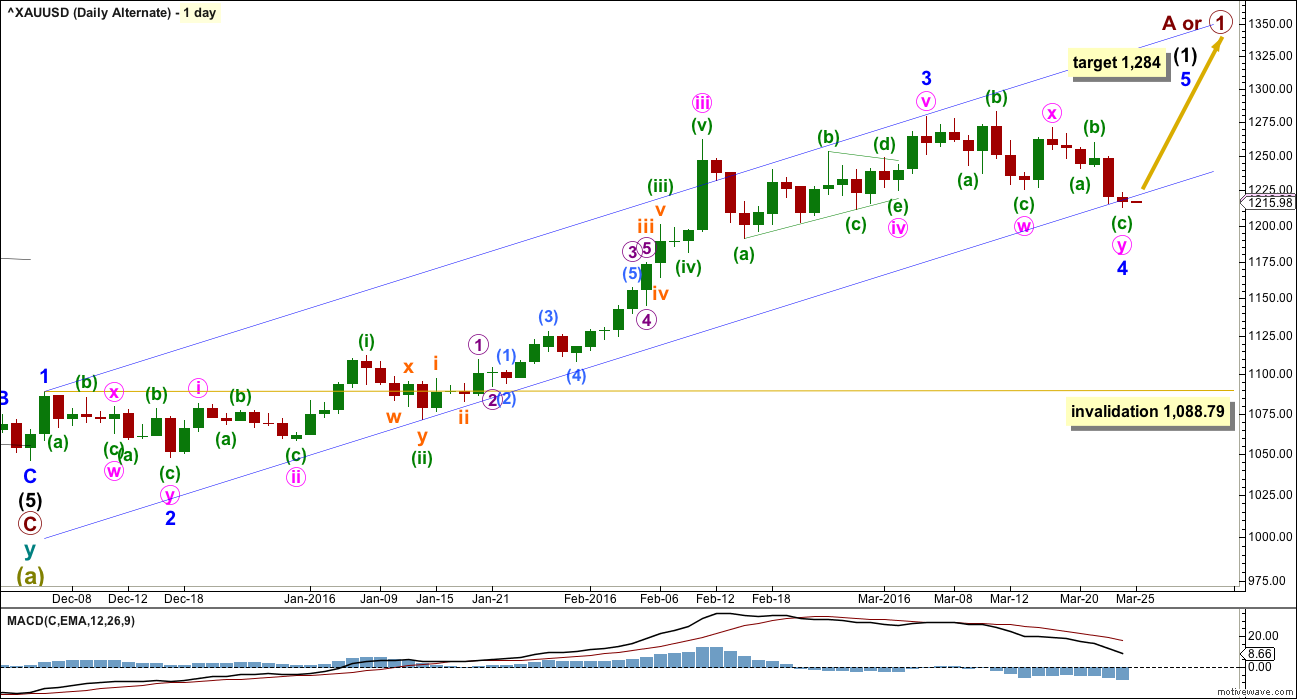
The strongest move may still be ahead. Gold often exhibits swift strong fifth waves typical of commodities.
Ratios within minor wave 3 are: there is no Fibonacci ratio between minute waves iii and i, and minute wave v is just 0.07 short of 1.618 the length of minute wave i.
Minor wave 4 may be complete as a double combination: expanded flat – X – zigzag. The structure is now complete and price has found support at the lower edge of the blue best fit channel. Downwards movement must end here for this wave count.
Minute wave y has ended slightly below minute wave w; the structure still has a mostly sideways look to it. But it must end here if it is to retain the right look.
At 1,284 minor wave 5 would reach 1.618 the length of minor wave 1.
Although the invalidation point must technically be placed at the high of minor wave 1, this wave count would be discarded if price breaches the lower edge of the blue channel at the daily chart level. Minor wave 4 may not move into minor wave 1 price territory below 1,088.79.
There is perfect alternation and good proportion between minor waves 2 and 4. Minor wave 2 is a deep double zigzag lasting nine days (one more than a Fibonacci eight), and minor wave 4 is a shallow combination lasting a Fibonacci thirteen days.
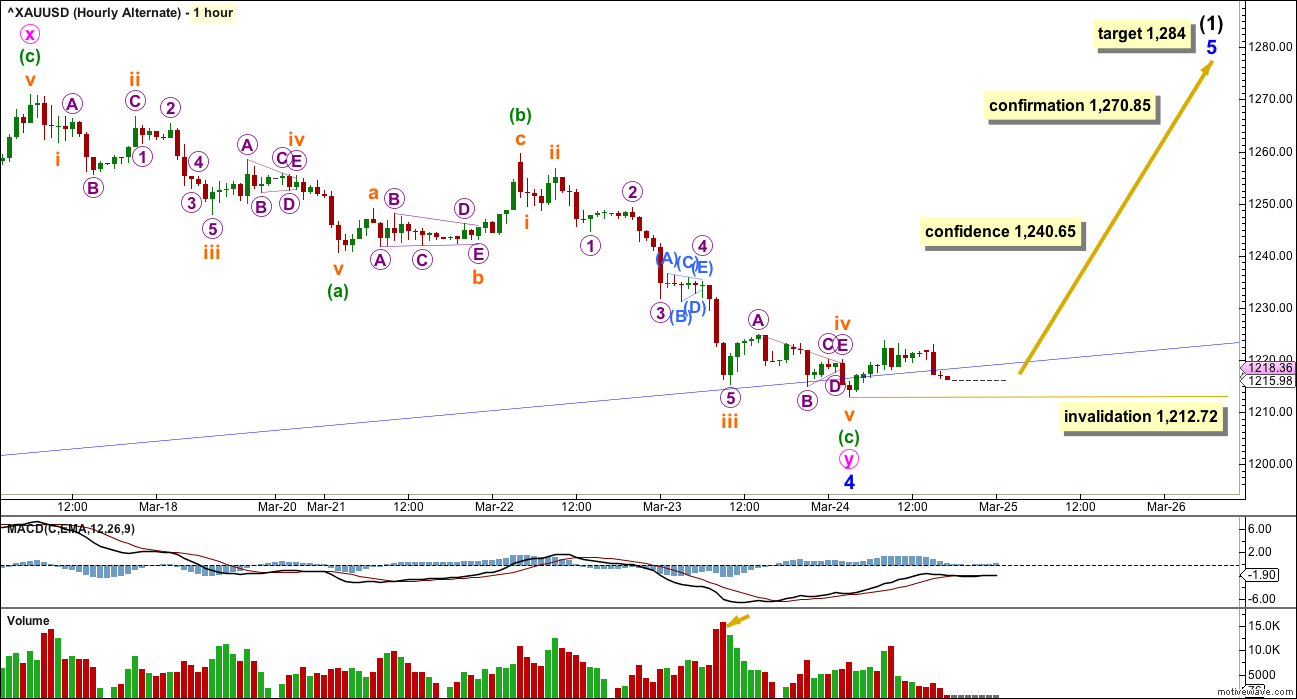
ALTERNATE HOURLY ELLIOTT WAVE COUNT
A-B-C of a zigzag and 1-2-3 of an impulse both subdivide exactly the same way: 5-3-5. For this alternate, minute wave y is a complete zigzag.
Within minor wave 5 upwards, no second wave correction may move beyond the start of its first wave below 1,212.72.
Some confidence may be had in this wave count if price breaks above 1,240.65. Confirmation would come with a new high above 1,270.85. At that stage, upwards movement could not be another second wave correction within a downwards trend, so the downwards trend must be over.
At 1,284 minor wave 5 would reach 1.618 the length of minor wave 1.
TECHNICAL ANALYSIS
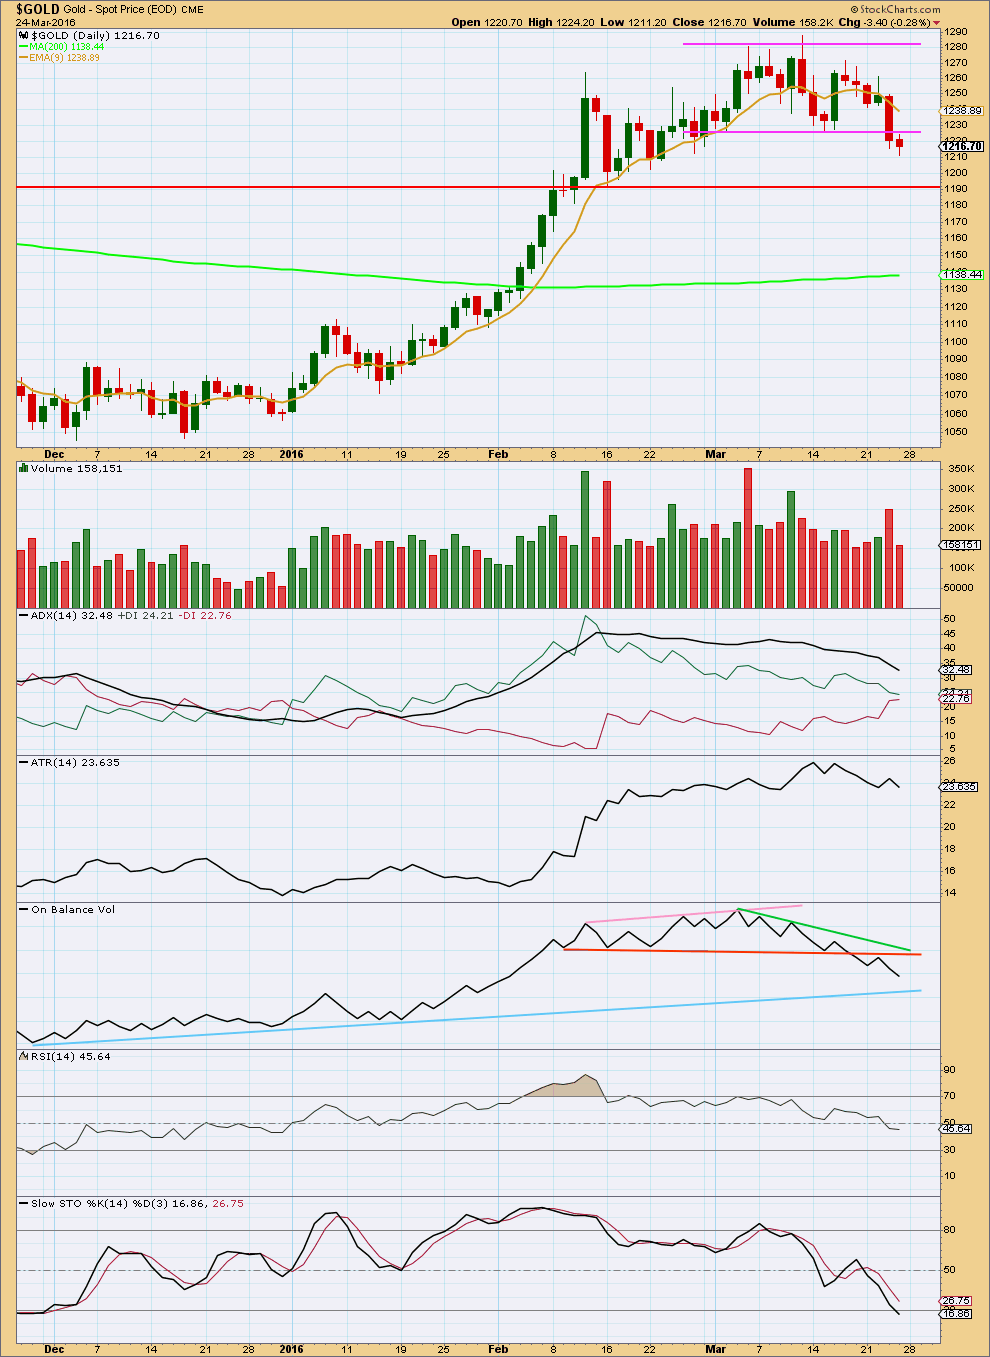
Click chart to enlarge. Chart courtesy of StockCharts.com.
Another downwards day is below the lower edge of the prior consolidation zone. This looks like there has been a downwards breakout and price may throw back to the trend line which previously provided support.
Downwards movement for Thursday came with a decline in volume; the fall in price was not supported by volume. However, the prior downwards day was well supported.
ADX is declining still indicating the market is not trending. The +DX line is close to but has not yet crossed below the -DX line, so ADX is not yet indicating a trend change. If these lines cross over, then a trend change would be indicated.
ATR is still declining indicating the market is not trending.
On Balance Volume is bearish. The break below the orange line was bearish and a throwback to find resistance was further bearishness. OBV may find support at the blue line. If it does, that may be where minor wave A for the main wave count ends and a bounce for minor wave B begins.
RSI is still close to neutral. There is room for price to fall or rise.
Stochastics is entering oversold. This is not yet clear enough to indicate an end to downwards movement here.
This analysis is published @ 02:26 a.m. EST on 25th March, 2016.

The new low looks like wave B within this correction.
It may be an expanded flat, running triangle or combination.
Upwards movement from that low so far looks like a zigzag. Which would fit a triangle or combination best.
Either way, this correction is incomplete. Sideways / upwards movement for at least a few more hours, and if this turns into a triangle maybe even another two days.
The alternate is invalidated. There is only one wave count now.
MCHUGH’S MARKET FORECASTING & TRADING REPORT March 23rd, 2016
Page 11
Today’s Market Comments
We got a new Sell signal in our HUI 30 day stochastic and our HUI Purchasing
Power Indicator Wednesday, March 23rd. When these two indicators are
in agreement, it is a directional signal, and when at odds with one another,
it is a combination neutral signal. On Wednesday, January 27th, the HUI Demand
Power / Supply Pressure Indicator triggered a new Buy signal. On
Wednesday, March 23rd, Demand Power fell 10 to 445 while Supply Pressure
rose 16 to 433, telling us Wednesday’s decline was strong. The decline
follows a Bearish divergence that has been growing over the past few
weeks.
Gold finished a sideways triangle for wave {iv} up. While wave {v} up may
be underway, the new Sell signals in our HUI 30 day stochastic and HUI
Purchasing Power Indicator, along with the Bearish Divergence between
prices and our HUI 10 day average Advance/Decline Line Indicator and HUI
Demand Power argues for the
****alternate possibility that wave 1-up has
topped, and that wave 2 down is underway, possibly taking Gold down toward
the 1,100 to 1,120 area, before it resumes its upward climb in wave 3-
up.****
http://static.safehaven.com/pdfs/mchugh_2016_03_25.pdf
HUI Purchasing Power Indic HUI Short Sell Mar 23rd, 2016 Sell Signal
HUI 30 Day Stochastic HUI Short Sell Mar 23rd, 2016 Sell Signal
HUI Purchasing Power Indic GOLD Short Sell Mar 23rd, 2016 Sell Signal
HUI 30 Day Stochastic GOLD Short Sell Mar 23rd, 2016 Sell Signal
Any wave counts?
Any comments where the current wave may retrace to today before moving back up?
1223.23 high Monday 9:40 am
-1208.28 low Sunday 8:18 pm
= 14.95 x .618= 9.24 – 1223.23 = 1,214.00 retrace .618
= 14.95 x .5= 7.475 – 1223.23 = 1,215.76 retrace .5
Gold and the miners are looking more and more bearish.
It was quite a surprise that gold and GDX went up since low Sunday at 1208.28 at 8:18 pm , maybe that was minuette (iii) and then the miners peaked the 1st minute of the open today then gold at 9:40 am.
I think we are still in the A wave of intermediate wave (2) down.
I have no miners and am on the fence waiting for more clarity or Lara’s comments.
Lara mentioned that minuette iv may make a new low below 1212. So I’m not sure if 1208 was end of minuette iii, or end of subminuette b of minuette iv. I personally think this upwards movement from 1208 is minuette iv… and we should be close heading into minuette v of minute (iii).
The miners action is also saying gold prices are prob heading lower, and so is the COT data…
That may be right thank you ari.
My guess is that we are now in a B wave up of this wave 2 correction. Having fallen to 1203 last night in overseas trading we are now back to 1220 or so and possibly higher . I continue to hold short April Gold positions waiting for a C wave down to complete this March-April correction. Whether it is shallow (say 1188) or deep 1130 we shall see. But this is an ideal time to get long into 1300, then 1500 then possible test of old highs at 1920 or close at 1800’s as Lara is currently speculating. It wont be straight up but might be a good buy and hold from the lows coming up. IMHO. Hope all had a good Easter , I visited my EX-Wife and two of my three grown up children (The third was in Utah picking up her first son from a camp. CIAO.
COT data has been bearish for some time now and has capped the gold’s advance.
Some thing funny is going to happen. Large commercials are staying heavely short.
==========================
The Last Time Producers Were This Short of Gold Futures Gold Crashed Two Months Later
Gold producers haven’t been this short of gold futures since a couple of months before the April 2013 gold crash:
http://energyandgold.com/2016/03/25/the-last-time-producers-were-this-short-of-gold-futures-gold-crashed-two-months-later/
It dosent matter at all in a long trend market papudi…
An intresting point to notice on the chart published in the article..
Gold is on 1400 levels and shorts are heavy…since than gold rocked to 1925.. levels
Gold’s seasonality- March April low around the corner and exceptional spring rally in gold stock ahead in May.
———————————————————————————————————–
Like gold itself, this sector tends to slump to a seasonal low in mid-March before embarking on a strong spring rally in April and May. With gold stocks back in a bull, their seasonality warrants consideration. ………….
http://www.321gold.com/editorials/hamilton/hamilton032516.html
EWI video with Tom Denham, Senior Metals Analyst. It appears that he thinks this correction may be shallow. It’s going to be tricky, because that is where Lara’s main count would expect the B wave up to start. If the correction is shallow, we won’t get as good of a buying opportunity. My bet is on Lara and a deeper correction, but you never know until it plays out. As always, Lara’s detail is so much better than EWI.
https://www.youtube.com/watch?v=AKt7fVMQkB8&list=TLpxr3Rd4O3dIyNjAzMjAxNg&index=1
PS posted this again since my Saturday post is still awaiting moderation.
Hi lara…
As Gold and dollar index is directly related to each other…couple of days back dollar index tested 94.6 levels now its back to 96.5 levels…
Can you please give your crucial time and have look on dollar index…as it will help us to determine the short term gold trend…
Thank you 🙂
With the break below 1212 and confirming the down trend, do we still expect an upward correction?
EWI video with Tom Denham, Senior Metals Analyst. It appears that he thinks this correction may be shallow. It’s going to be tricky, because that is where Lara’s main count would expect the B wave up to start. If the correction is shallow, we won’t get as good of a buying opportunity. My bet is on Lara and a deeper correction, but you never know until it plays out. As always, Lara’s detail is so much better than EWI.
https://www.youtube.com/watch?v=AKt7fVMQkB8&list=TLpxr3Rd4O3dIyNjAzMjAxNg&index=1
Weekend read:
It’s all over 1790???
http://www.plata.com.mx/Mplata/articulos/articlesFilt.asp?fiidarticulo=284
The year 1790 all over again. NO.
I just ignore manipulation, conspiracy, world end and financial collapse doomsday theories as they tend to go on for years and may cause some to avoid doing profitable trading in the meantime.
Did Alt invalidated?????
No. All I can see on my COMEX data is price flatlining.
Which is why I’ve not done another analysis. It would be a complete copy and paste, nothing has changed.
A quick look at pmbull.com clearly shows the Gold Alternate did not invalidate.
I hope everybody is having a wonderful Easter break. I see there are some more hourly bars for Gold, but it’s flatlined. I expect it will resuscitate when markets open next week.
As it’s quiet here I thought I’d share what I’m up to (I have shared over at EWSM, don’t want EWG members to miss out).
We’re on a family trip this Easter to Muruwai beach. I live on the east coast of the North Island (yeah, really original right). Muruwai is on the west coast.
Muruwai is a long straight sweep of wide black sand beach with huge surf, extensive sand dunes, in places majestic sheer cliffs (north and south of this pic). AKA the movie “The Piano”.
The east coast where I live has horseshoe shaped bays, white sand and Pohutukawa tree fringed beaches. Very pretty and quite different.
This is my office for the next few days.
I love the view of the ocean and the waves. Mother Nature at her finest in so many ways.
Thanks for sharing the picture. This is ideal for YOGA on a sunrise. WOW!!!
Have a good weekend.
Awesome view of the ocean. Looks very serene. Thanks for sharing.
Lara, I think i should move to New Zealand, but I need to find a beautiful lady to come with me . Or do you you suppose I might find a Kiwi girl (maybe like you) who understands that age is just a number ? Happy Easter , Stephen
We have women in New Zealand. A fair few of them like me 🙂
Lara, you have said that it is difficult to trade corrective waves because there is so much variation within them and you have warned us against trading waves 2 and 4. Does this also apply at the intermediate level? Thanks.
An excellent question.
Not entirely. The first movement down must be 5-3-5 within minor A. That can be traded. Once that is finished it may be a zigzag for minor A or it may continue to finish as an impulse for minor A.
The B wave within intermediate wave (2) should probably be avoided. I’ll be avoiding it anyway. But when it is done (and I’ll be working to figure that out) then the C wave down may certainly be traded.