Upwards movement was expected. This is how the session began but most gains were retraced.
Summary: Two wave counts today both expect more upwards movement. In the short term, a third wave up may still be beginning. It is reasonably likely that price will reach to 1,275.24. The target is 1,281. Upwards movement is most likely a B or X wave within a larger correction for intermediate wave (2). It is possible but unlikely that this upwards movement is the start of intermediate wave (3).
New updates to this analysis are in bold.
Last published weekly chart is here.
MAIN DAILY ELLIOTT WAVE COUNT
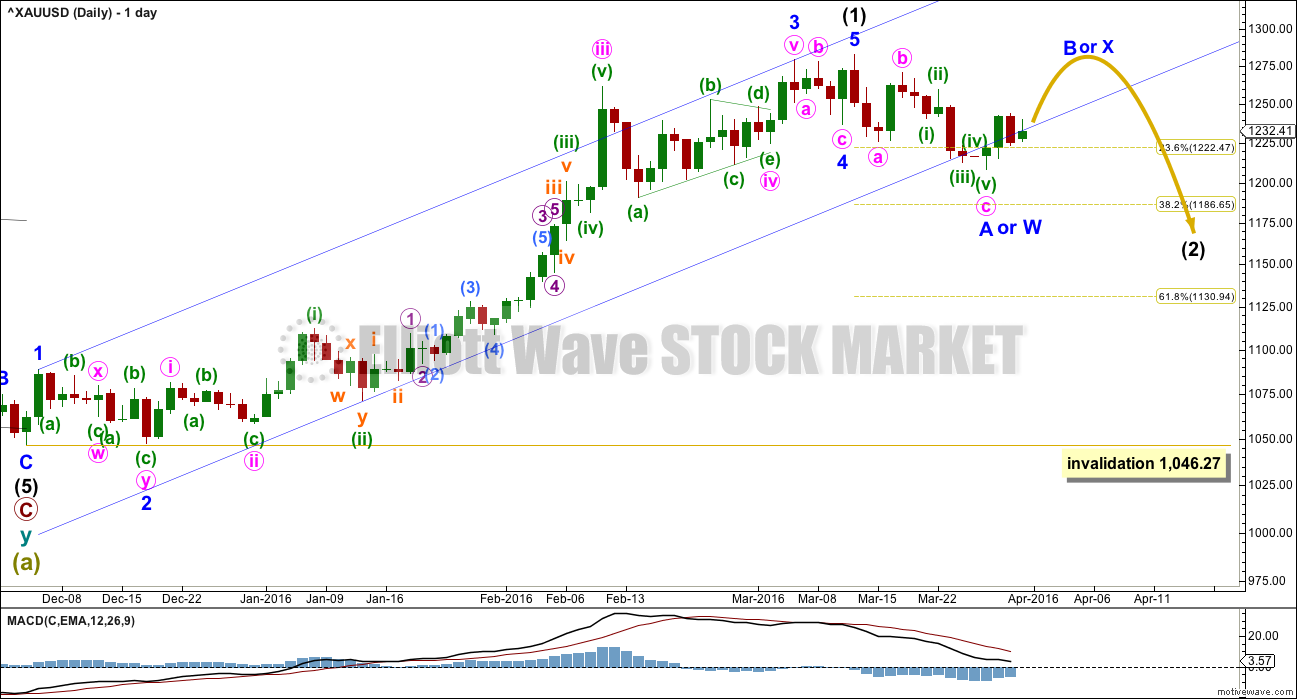
Intermediate wave (1)is a complete impulse. Intermediate wave (2) may have begun. COT supports this wave count; the majority of commercial traders are short (as of 22nd March). While this does not pinpoint when price should turn, it does support a larger downwards trend about here.
The first movement down within intermediate wave (2) subdivides as a three, not a five. This indicates intermediate wave (2) is not unfolding as the most common zigzag, so it may be unfolding as a flat, combination or double zigzag. The first three down may be minor wave A of a flat or minor wave W of a double combination or double zigzag.
If the correction up labelled minor wave B or X is shallow, then intermediate wave (2) would most likely be a double zigzag. Double zigzags have a slope against the prior trend; they are not sideways movements. A double zigzag may end close to the 0.618 Fibonacci ratio at 1,131.
If the correction up labelled minor wave B or X is deep and reaches to 1,275.24 or above, then intermediate wave (2) would most likely be a flat or combination. These are both sideways movements. A combination or flat may end closer to the 0.382 Fibonacci ratio at 1,187.
The channel about intermediate wave (1) is today drawn using Elliott’s technique. Upwards movement may find resistance at the lower edge.
This wave count expects the upwards movement to be a counter trend movement. The trend remains down at intermediate wave degree. Minor wave B or X would be likely to look like a three wave structure at the daily chart level.
HOURLY ELLIOTT WAVE COUNT
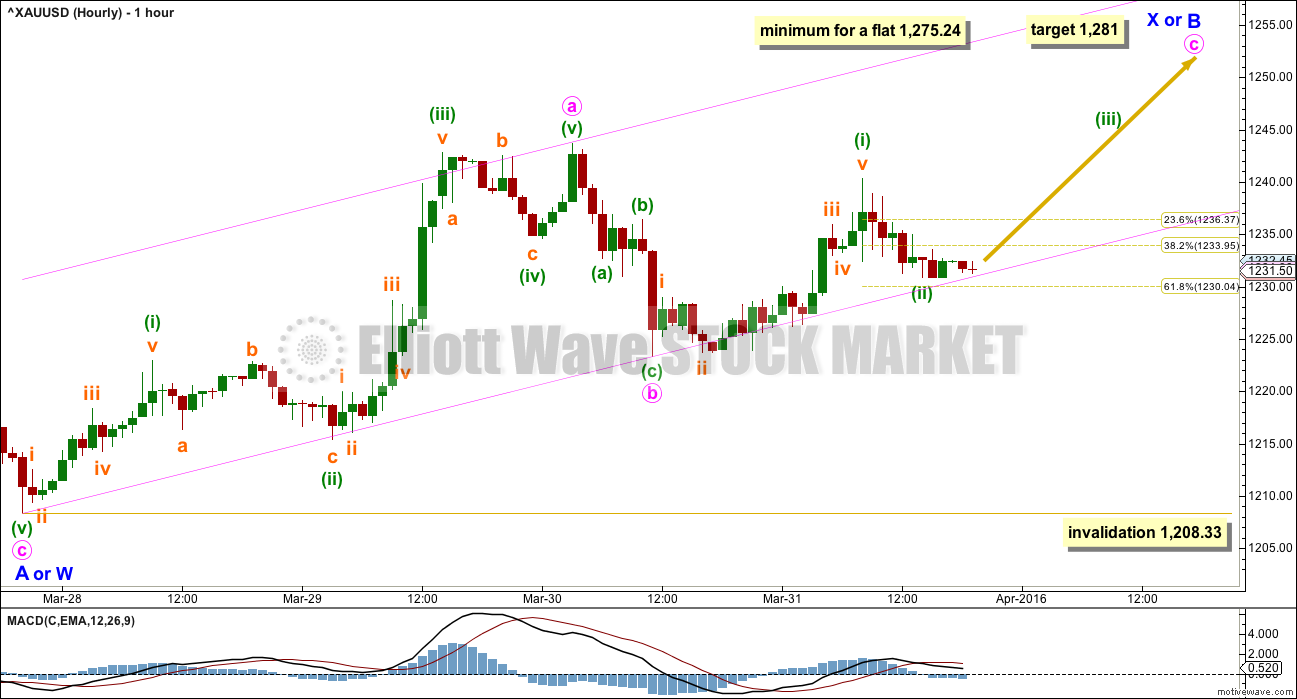
Minor wave A or W subdivides as a 5-3-5 zigzag. This structure is complete.
Minor wave B or X must subdivide as a corrective structure. This may be any one of 23 possible structures. The labelling will change as it unfolds. It is impossible for me to give you a road map for a B wave. They are the most difficult of all Elliott waves to analyse, and usually it is only clear what structure they take at the end. There is too much variety within B waves.
So far within minor wave B the structure looks like a zigzag. Minute wave a fits best as a five wave impulse. This means that if minute wave b continues sideways and lower ,it may not move beyond the start of minute wave a below 1,208.33.
Minute wave c must subdivide as a five wave structure, either an impulse or ending diagonal. So far minuette waves (i) and now (ii) may be complete. Price is finding support at the lower edge of the channel about this upwards movement.
If price breaks below the lower pink trend line, that would be an indication that minute wave b may not be over.
This wave count at this stage expects upwards momentum to increase as a small third wave unfolds. The target for minute wave c remains the same: at 1,281 minute wave c would reach 1.618 the length of minute wave a.
If intermediate wave (2) is unfolding as a flat correction, then within it minor wave B must reach to 0.9 the length of minor wave A at 1,275.24 or above. Minor wave B may make a new high above the start of minor wave A at 1,282.68 as in an expanded flat.
If intermediate wave (2) is unfolding as a double combination, then there is no minimum requirement for minor wave X within it. It must only subdivide as a corrective structure. X waves within combinations are normally deep.
If intermediate wave (2) is unfolding as a double zigzag, then there is no minimum requirement for minor wave X within it; but minor wave X should not be deep, it should be shallow.
ALTERNATE DAILY ELLIOTT WAVE COUNT
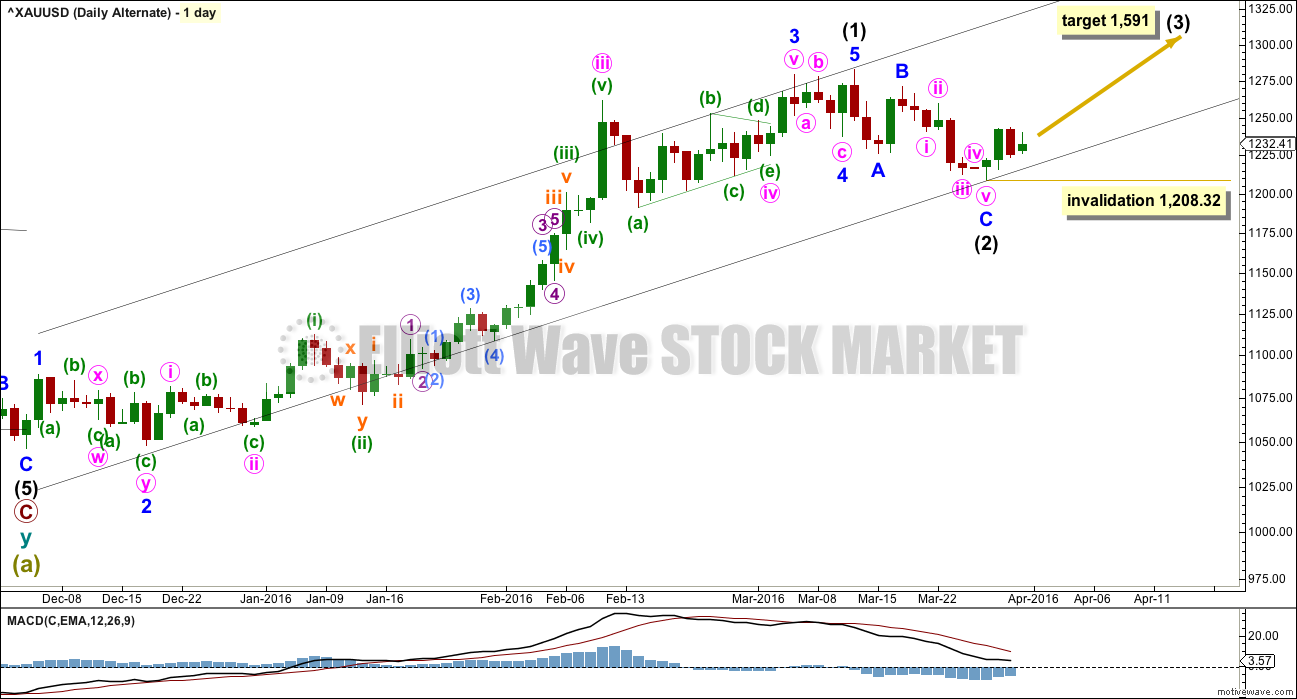
It is technically possible but highly unlikely that intermediate wave (2) is over. This wave count requires confirmation with a five up on the hourly chart for confidence. A new high is not confirmation of this wave count.
If intermediate wave (2) is over, then it is a very brief and shallow 0.31 zigzag lasting only eleven days (intermediate wave (1) lasted 69 days). The probability of this is very low.
At 1,591 intermediate wave (3) would reach 1.618 the length of intermediate wave (1).
Within intermediate wave (3), no second wave correction may move beyond its start below 1,208.32.
I do not want to give too much weight to this alternate by publishing an hourly chart. The subdivisions would be exactly the same as the main hourly chart.
TECHNICAL ANALYSIS

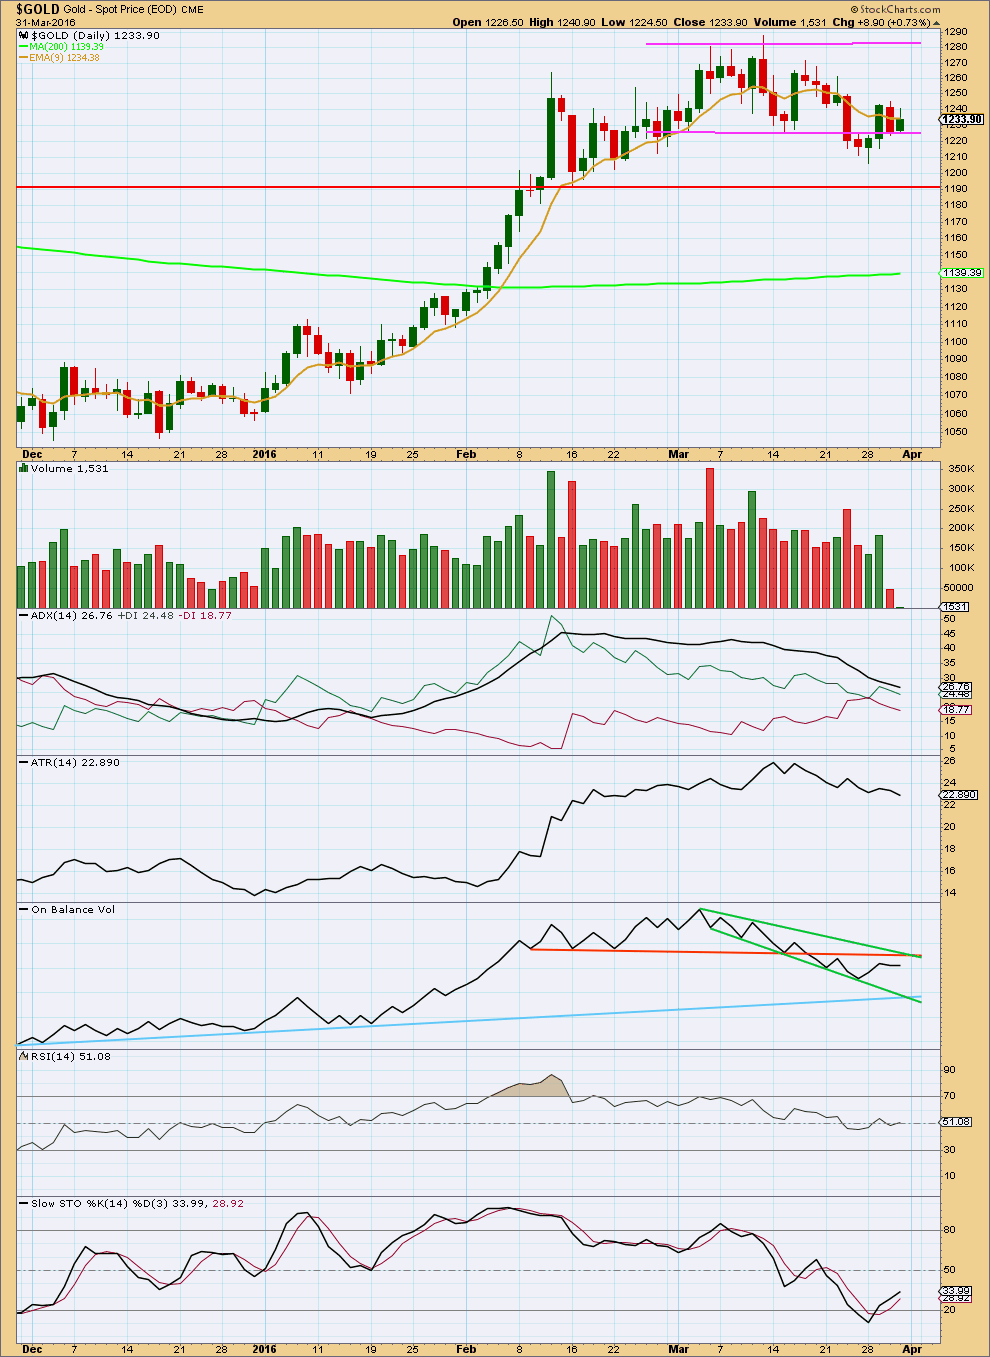
Click chart to enlarge. Chart courtesy of StockCharts.com.
Price is back within the consolidation zone and overall volume continues to decline. What looked like a breakout on 23rd March was false.
During the consolidation so far, it is still the upwards day of 10th March which has strongest volume. This indicates an upwards breakout is more likely than downwards. This does not support the main Elliott wave count but does support the alternate Elliott wave count.
Downwards movement for the session of 30th March comes with very light volume. The fall in price was not supported at all by volume.
Now a small inside day producing a green candlestick comes with minuscule volume. There was no support for the rise in price during this session.
As consolidations develop, they move price sideways on declining volume and at the end volume is lightest. The almost negligible volume for today’s session may be an indication that the consolidation is mature and a breakout may happen within the next 24 hours. The next daily candlestick may be very long and may come with high volume. Prior volume indicates this is most likely to be upwards.
ADX is clearly declining indicating the market is not trending. ATR is still sideways, which is in agreement with ADX.
On Balance Volume today is flat. If OBV turns upwards, it is likely to find resistance at the orange trend line. This line is highly technically significant; it is long held, horizontal and repeatedly tested. The next rise in price may end when OBV touches that line again.
RSI is neutral. There is room for price to rise or fall.
Stochastics is returning from oversold.
This analysis is published @ 08:06 p.m. EST.


I’ve paid a small amount to relearn a lesson: don’t try to trade B waves.
I’ve been stopped out for a small loss. Small because I moved my stop closer to the entry point. A risk management technique I prefer.
There is a five up and now a very deep three down on the hourly chart.
The target at 1,281 for minor B or X is for C to = 2.618 X A at 1,302.
Lara will give us a clear picture…
But with the move i can see ABC on hourly chart…with C completing with todays low…if this is correct than this is minutte 2 completed in minor 1 of int 3…
Comments..??
Lara mentioned in the above analysis that the probability of intermediate 2 ending in such short time is low. Also, in this scenario the COT data is going against it. Volume is also rising as price falls, and decreases when price rises on the hourly chart… Also, shouldn’t C have moved lower than A to avoid truncation? But anything can happen. We’ll just have to wait and see.
My gut says we’re going lower, and that intermediate 2 is not done… What complicates things is that its hard to tell if we’re in wave W or X, or B. All in all, its too risky with too many unknowns to make a short term bet in any direction…
I think the alt might be OK on the basis that the depth of correction should find support in the fourth wave of lesser degree. No COT data in EW to my knowledge. just a thought…..
TOS, MACD GDX 1,3,5,15,39 and 78 are Buys at this minute.
A complete reversal from the gold low at 10:11 am when all were Sell.
So far within minor wave B the structure looks like a zigzag. Minute wave a fits best as a five wave impulse. This means that if minute wave b continues sideways and lower ,it may not move beyond the start of minute wave a below 1,208.33.
Minute wave c must subdivide as a five wave structure, either an impulse or ending diagonal. So far minuette waves (i) and now (ii) may be complete. Price is finding support at the lower edge of the channel about this upwards movement.
If price breaks below the lower pink trend line, that would be an indication that minute wave b may not be over.
Gold getting very hard to understand…
If alt 2 also get invalidated…does it mean we are in the wave 3 of A…??..
If it is so than the complete correction of int 2 will be very low…unable to digest it…
Any wave counts yet?
Do you think gold’s low of today at 1,208.98 at 10:11 am will be the low the rest of the day?
Good that gold stayed above the 1,208.32 invalidation.
I don’t think anyone has a clue. It seems like every few days the wave counts get invalidated. Wave B or X might have been very shallow, and this could be a strong wave C down in intermediate 2…
It could also be a continuation of A or W, and we could be going up to start B or X…
The COT figures say its going lower…
But what’s going to happen the rest of the day? No one knows…
I think the low of today was a buying time for gold and just minute wave b moved down and bottomed and gold moves up from here.
Exactly.
The wave count is not invalidated. There was no new low below 1,208.33.
Gold is now approaching invalidation zone for both hourly main and daily alternate at $1,208.32. Gold reached 1208.98. Not looking good.
Another way to look at it is an opportunity. When corrections are that deep they present a low risk entry. But only if you have a clear wave count
More US news coming at 10 am EST FRIDAY, APRIL 1 10 am EST
US – ISM manufacturing
9:21a
Dollar turns higher after jobs report at 8:30 am EST
9:20a
Gold futures put on the brakes, speed lower after jobs report
After watching GDX drop quickly yesterday into the close, it didn’t feel right. Probably due to all the insiders knowing the job numbers data before us.
I’m a new member and signed up about 2 weeks ago. While most sing your praise, I haven’t seen 1 single correct call yet. Today is no different with gold trading at $1,215.85 at the time of this post. Forgive me with my direct approach, but I’m not very impressed. Let me know how you made out with your trading position as well?
Blame it on the US FED yo-yo effect on the markets with big direction changes and also today at 8:30 am US EST non-farm payroll pushed US dollar up and oil and gold down hard. Causing huge sentiment and price changes in gold.
Stephen,
You have to just read Lara’s analysis for a while in order to appreciate it…
Just sit back and don’t make any short-term trades based on the analysis right now. If you want to get the most out of Lara’s analysis, I would use it for long term trades, 12-18 months out. For example, gold is in a bull market. It will be going higher long term for the next 12-18 months… Don’t get stuck on when intermediate 2 begins or ends, and try to day trade based on that. Wait until she’s confident intermediate 2 is over, and put a good long term bet that price will go higher from there.
To really appreciate Lara’s analysis, look into her oil analysis archives from the days oil was price above $100 back 2nd and 3rd quarter of 2014. But even then, if you would have placed short term bets that price would go lower, you would lose capital. Its the long-term picture you’ve gotta focus on.
This is coming from someone who has cancelled his membership in the past, frustrated by trading short-term. But for a good analysis, you’ll be coming back here.
Ditto. Couldn’t agree any more.
ari, Thanks for your views on things. You’ve made some valid points about trading gold day by day versus longer term and also about Lara’s analysis. I learnt a lot from your really great comments.
🙂
Price is consolidating. It’s range bound.
If you expect me to give you a road map for exactly how price will move during a range bound consolidation then you’re expecting the impossible.
Let us all know how you get on trying to find an analyst who can do that.
I’ve been pretty clear. This is a B wave. My analysis above states “t is impossible for me to give you a road map for a B wave. They are the most difficult of all Elliott waves to analyse, and usually it is only clear what structure they take at the end. There is too much variety within B waves.”
You’re not impressed with this? Fine. Cancel your membership please.
Looks like minute wave b is continuing lower as double zig zag and has reached a reasonable target of 1219 and that may be it.
Seems like it for now.
For the invalidation point, from Lara’s analysis “GOLD Elliott Wave Technical Analysis – 31st March, 2016”:
This means that if minute wave b continues sideways and lower ,it may not move beyond the start of minute wave a below 1,208.33.
What you think about this count ?….is it possible to count as a three the b wave whitin triangle ? ….MACD is around zero…..
As alternate…
Minor 4 = expanded flat – x wave – triangle….and maybe at the min. 1208,98 is finished c wave within triangle ….
Gold And Silver Signaling Lower – Avi Gilburt March 30, 2016
http://www.gold-eagle.com/article/gold-and-silver-signaling-lower
See at the bottom of the article the link to GDX, GLD, and Silver EW charts.
Be aware that Lara doesn’t necessarily approve of his chart counts.
So what is june contracts volume today lara..??..and what it is saying for TA..??
StockCharts data is still the same.
COMEX data shows a slight increase in volume for 31st.
It doesn’t really change the TA picture much. Overall volume is still declining. Some support for upwards move in price. Doesn’t change the expectation of an upwards breakout
Ohh k…thanx
I think the inaccurate volume data for StockCharts is related to yesterdays expiration of the April16 Comex gold contract. All margin positions were forced to liquidate their position or roll over to the June16 contract. The only open April16 contracts are the ones held by 100% cash buyers.
As of yesterday, StockCharts should have been posting the volume for the June16 contract. Hopefully their data feed rolls over sooner than later. Maybe tomorrow?
For example:
Yesterdays (Wednesday March 30th) Globex volume for the June16 contract was 173,097. StockCharts posted the volume for the April16 contract of 47,523.
http://www.cmegroup.com/trading/metals/precious/gold_quotes_volume_voi.html
Today, the CME Group has not yet posted the final daily volume data so StockCharts is sourcing its data from the Estimated Volume of the May16 futures settlement. Not sure why.
http://www.cmegroup.com/trading/metals/precious/gold_quotes_settlements_futures.html
Whenever todays volume data is available from the CME, the Globex volume for the June16 contract will more accurately represent golds volume for today.
Thank you Reid.
Any possibility that this A wave in Gold is a leading diagonal?
I meant to post this one.
No. Because it doesn’t meet the rules for wave lengths within diagonals.
The third wave is longer than the first, but the fourth wave is shorter than the second and the trend lines converge suggesting a contracting diagonal.
The third wave is too long.
… Yeah, with an inside day, can expect the Thursday high 1242.30 to be taken out for a lot more once Gold price begins to get above its pivot. Upwards move / rally is expecting…. What a fine analysis by Lara folks, simply marvelous~! Good luck all, thank you Lara…. 🙂
Thank you very much Syed