
Last week’s analysis again expected upwards movement.
This is how the week began, but today price has moved strongly lower retracing the gains of the last five days.
Summary: A larger second wave correction has most likely arrived. It may last a few weeks and most likely would end about 14.514.
New updates to this analysis are in bold.
WEEKLY WAVE COUNT
Click chart to enlarge.
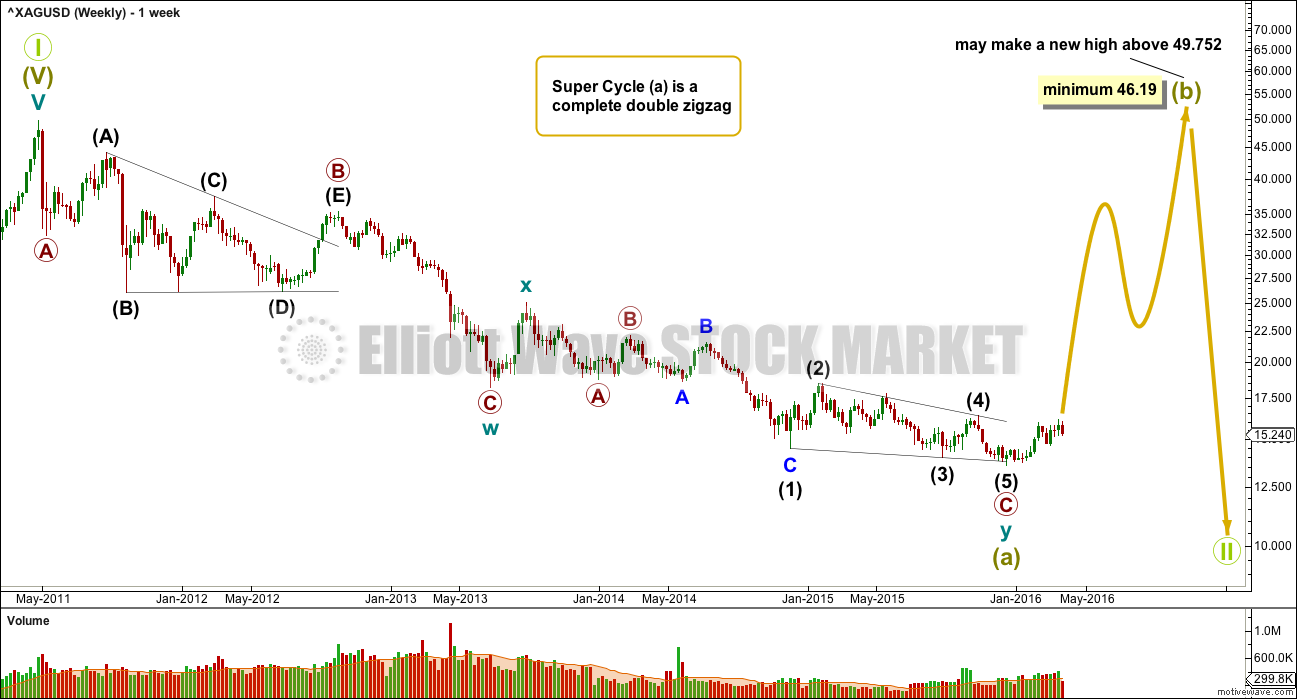
If super cycle wave (a) is a double zigzag, then within the second zigzag of the double labelled cycle wave y the structure may be complete.
Primary wave C is an ending contracting diagonal within the zigzag of cycle wave y. All subwaves subdivide as zigzags. The third wave is shorter than the first, the fifth wave is shorter than the third, and the fourth wave is shorter than the second. The trend lines converge.
There is a small overshoot of the (1)-(3) trend line at the end. This indicates the contracting diagonal structure is very likely to be complete.
If this wave count is correct, then super cycle wave (a) has subdivided as a three wave structure. That indicates Grand Super Cycle wave II may be a flat correction.
If this correction at Grand Super Cycle is a second wave (as opposed to a fourth wave), then a triangle may be eliminated.
A combination may also be eliminated because the first wave is a multiple. Combinations may only consist of a maximum of three corrective structures, so within each of W, Y and Z they may only subdivide into simple A-B-C structures (or A-B-C-D-E in the case of triangles). To label multiples within multiples increases the maximum beyond three, violating the rule.
Super Cycle wave (b) must retrace a minimum 90% of super cycle wave (a) at 46.19. Super cycle wave (b) may make a new price extreme beyond that seen for super cycle wave (a) above 49.752 as in an expanded flat.
Super cycle wave (b) may be any one of 23 possible corrective structures. It is impossible to predict at this early stage which one it will be, only to say it is unlikely to be a rare structure such as a running flat, expanding triangle or triple combination. That still leaves multiple structural possibilities. The most likely structure which would be able to meet the minimum price requirement at 23.945 is a zigzag.
The first movement up for a wave of this large degree must subdivide as a clear five at the daily chart level, and probably at the weekly chart level also.
DAILY WAVE COUNT
Click chart to enlarge.
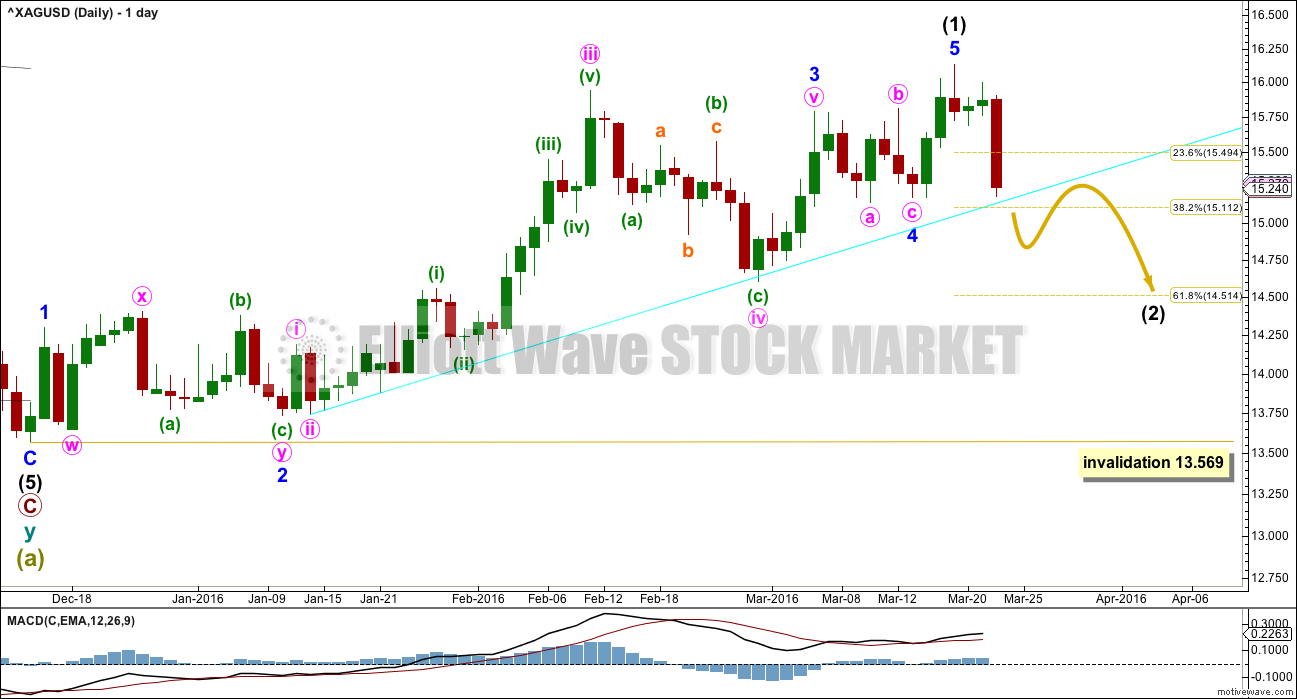
If there has been a trend change at super cycle degree, then a clear five wave structure upwards must develop. With the last high this may now be seen as complete.
Minute wave v to end minor wave 3 is slightly truncated by 0.154 within intermediate wave (1). Although this reduces the probability of this wave count, Silver does seem to exhibit truncations more readily than Gold; I will let the wave count for Gold lead Silver. Gold expects that intermediate wave (2) has most likely arrived.
Ratios within intermediate wave (1) are: minor wave 3 is 0.135 longer than 2.618 the length of minor wave 1, and minor wave 5 has no Fibonacci ratio to either of minor waves 3 or 1.
Minor wave 2 is a deep double combination and minor wave 4 is a shallow regular flat with a slightly truncated C wave.
Downwards movement may find support here at the cyan trend line. A bounce up may be seen for a day to three.
Intermediate wave (1) lasted 66 days (not a Fibonacci number). Intermediate wave (2) would likely last longer; second wave corrections are often more time consuming than the first waves they correct.
Intermediate wave (2) may not move beyond the end of intermediate wave (1) below 13.569.
ALTERNATE DAILY WAVE COUNT
Click chart to enlarge.
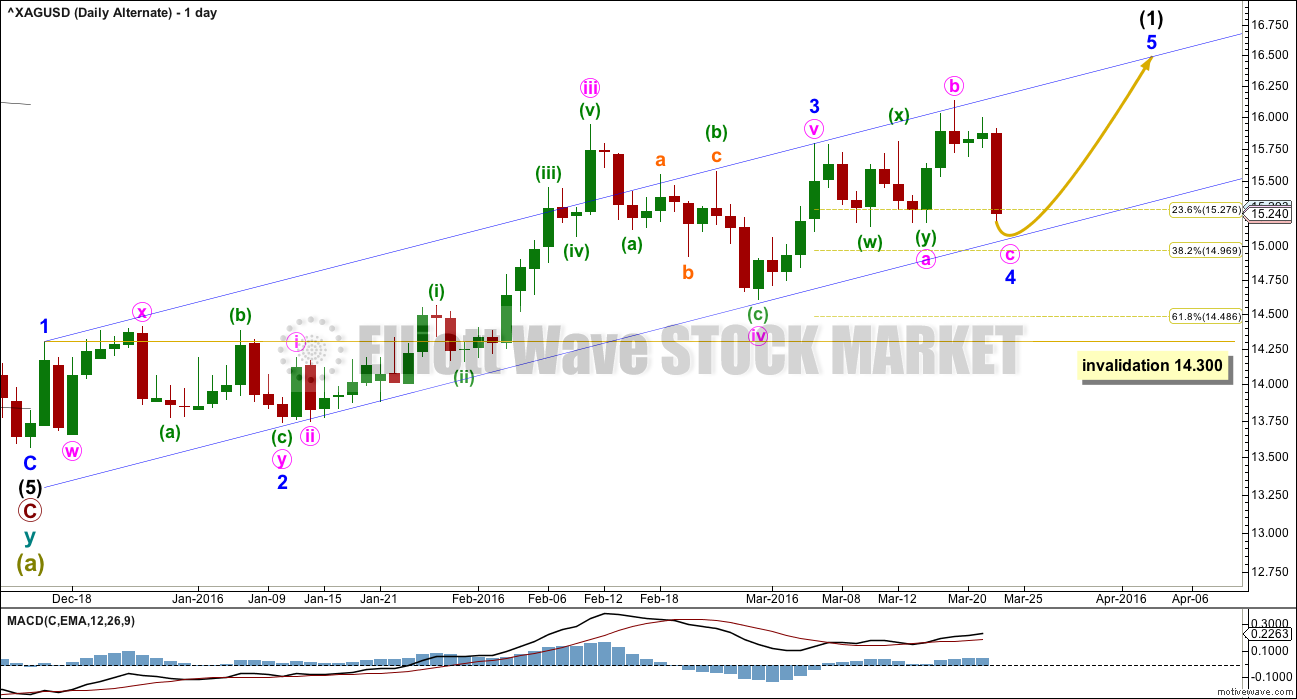
This wave count fits with the alternate for Gold.
Minor wave 2 was a combination. To exhibit some alternation minor wave 4 may be a more shallow expanded flat.
Minor wave 4 may find support at the Elliott channel drawn about this upwards impulse. A little more downwards movement may complete the expanded flat, so that minute wave c moves below the end of minute wave a to avoid a truncation and a very rare running flat. This may end when price finds support at the Elliott channel.
Thereafter, new highs for Silver may be required to complete intermediate wave (1).
Minor wave 4 may not move into minor wave 1 price territory below 14.300.
TECHNICAL ANALYSIS
DAILY CHART
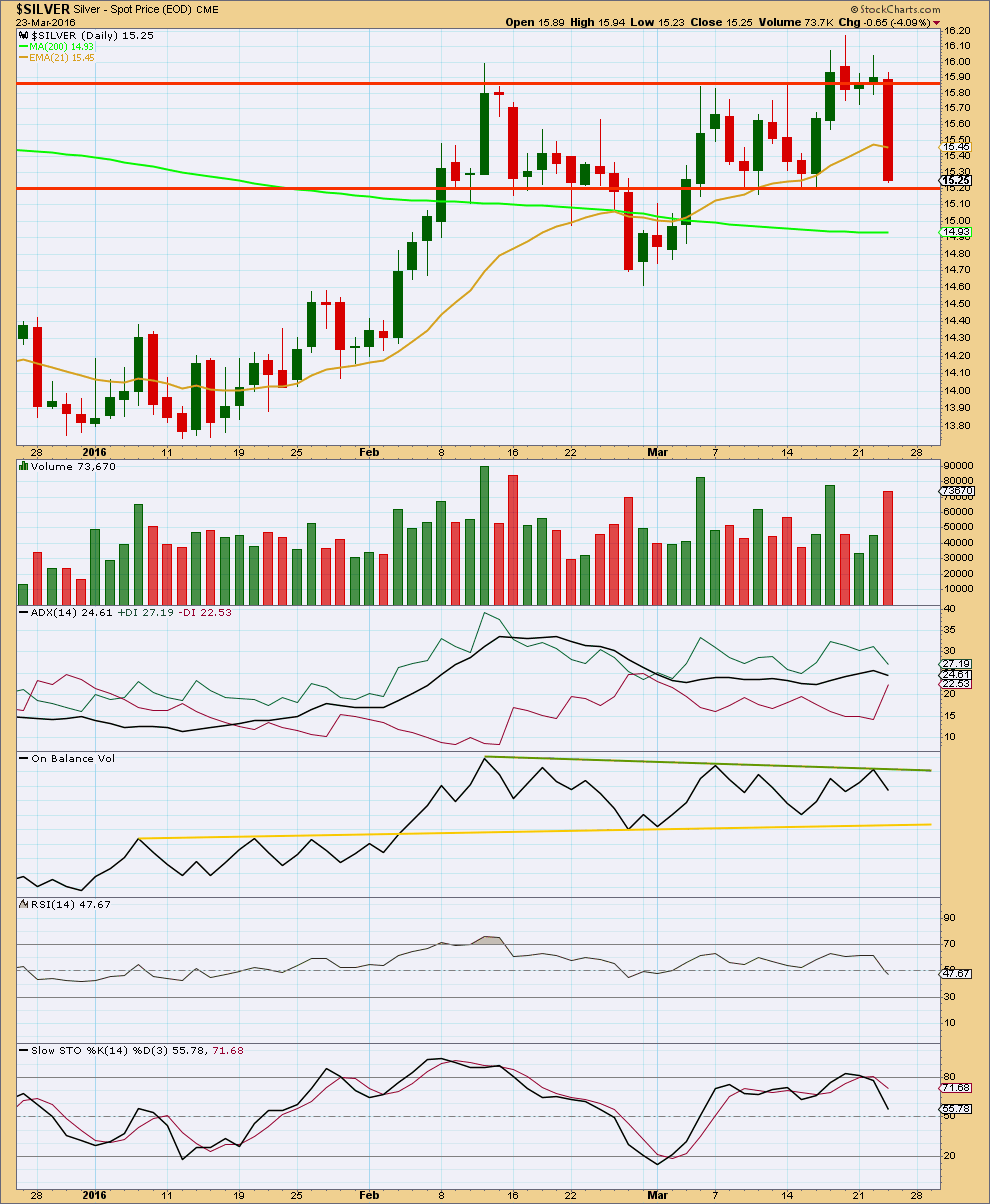
Click chart to enlarge. Chart courtesy of StockCharts.com.
With price returning strongly back into the horizontal red lines after breaking above on a day with increased volume for 17th March, the small upwards breakout was false.
The strong downwards day of 23rd March has not broken below support. Price remains range bound for Silver. Strong volume for the 23rd of March does support the fall in price and indicates it is more likely that price may continue lower. This supports the main Elliott wave count.
On Balance Volume is not providing any clue this time as to which direction price may move next. If OBV breaks below the yellow line then expect more downwards movement from price. If OBV breaks above the green line then expect upwards movement from price.
Both RSI and Stochastics are neutral. There is room for price to rise or fall.
ADX is declining today indicating the market is not trending. It is not yet indicating a trend change: the +DX line remains above the -DX line.
This analysis is published @ 10:39 p.m. EST.