
Last week’s analysis expected upwards movement from Silver, which is what happened.
Summary: The trend remains up. The target for the next interruption to the trend remains at 16.802.
New updates to this analysis are in bold.
WEEKLY WAVE COUNT
Click chart to enlarge.
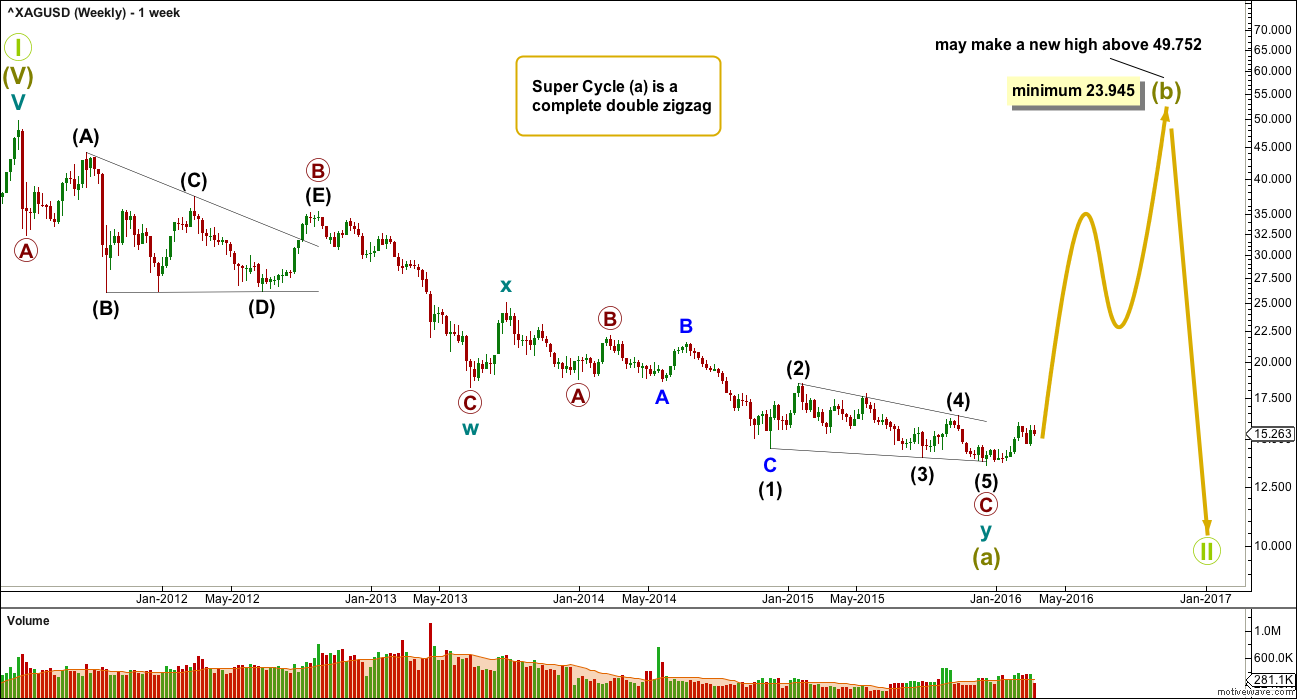
If super cycle wave (a) is a double zigzag, then within the second zigzag of the double labelled cycle wave y the structure may be complete.
Primary wave C is an ending contracting diagonal within the zigzag of cycle wave y. All subwaves subdivide as zigzags. The third wave is shorter than the first, the fifth wave is shorter than the third, and the fourth wave is shorter than the second. The trend lines converge.
There is a small overshoot of the (1)-(3) trend line at the end. This indicates the contracting diagonal structure is very likely to be complete.
If this wave count is correct, then super cycle wave (a) has subdivided as a three wave structure. That indicates Grand Super Cycle wave II may be a flat correction.
If this correction at Grand Super Cycle is a second wave (as opposed to a fourth wave), then a triangle may be eliminated.
A combination may also be eliminated because the first wave is a multiple. Combinations may only consist of a maximum of three corrective structures, so within each of W, Y and Z they may only subdivide into simple A-B-C structures (or A-B-C-D-E in the case of triangles). To label multiples within multiples increases the maximum beyond three, violating the rule.
Super Cycle wave (b) must retrace a minimum 90% of super cycle wave (a) at 23.945. Super cycle wave (b) may make a new price extreme beyond that seen for super cycle wave (a) above 49.752 as in an expanded flat.
Super cycle wave (b) may be any one of 23 possible corrective structures. It is impossible to predict at this early stage which one it will be, only to say it is unlikely to be a rare structure such as a running flat, expanding triangle or triple combination. That still leaves multiple structural possibilities. The most likely structure which would be able to meet the minimum price requirement at 23.945 is a zigzag.
The first movement up for a wave of this large degree must subdivide as a clear five at the daily chart level, and probably at the weekly chart level also.
DAILY WAVE COUNT
Click chart to enlarge.
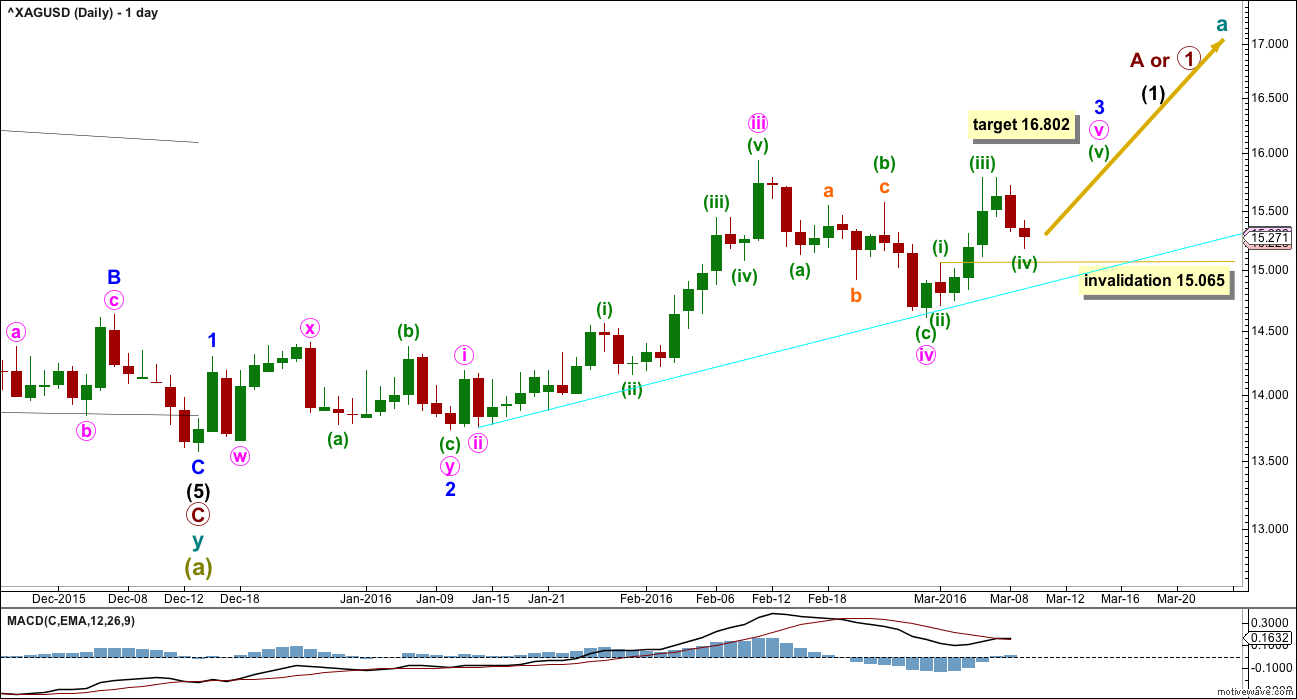
If there has been a trend change at super cycle degree, then a clear five wave structure upwards must develop. This would still be incomplete.
At this stage, due to the duration, this sideways consolidation looks like it may need to be labelled one degree higher. For now it makes no difference to the expected direction of price, so I will leave it as is. Silver just does not always have nice proportions; I will let Gold lead the way.
Upwards movement for the last week looks most likely to be minute wave v unfolding as expected. There are two ways to label this upwards movement so far. Minuette waves (i) to (iv) may be complete. If minuette wave (iv) moves any lower, it may not move into minuette wave (i) price territory below 15.065. This first wave count expects minuette wave (v) within minute wave v to be extended. This is a typical tendency for commodities, so this is the main wave count.
Minuette wave (iii) has no Fibonacci ratio to minuette wave (i).
Along the way up, expect price to find support at the cyan trend line. When this line is breached, then intermediate wave (1) may be over.
At 16.802 minute wave v would reach equality in length with minute wave iii. If this target is wrong, it may be too high. When there is some structure within minute wave v to analyse, then the target may be calculated at a second wave degree. At that stage, it may widen to a zone or it may change.
ALTERNATE DAILY WAVE COUNT
Click chart to enlarge.
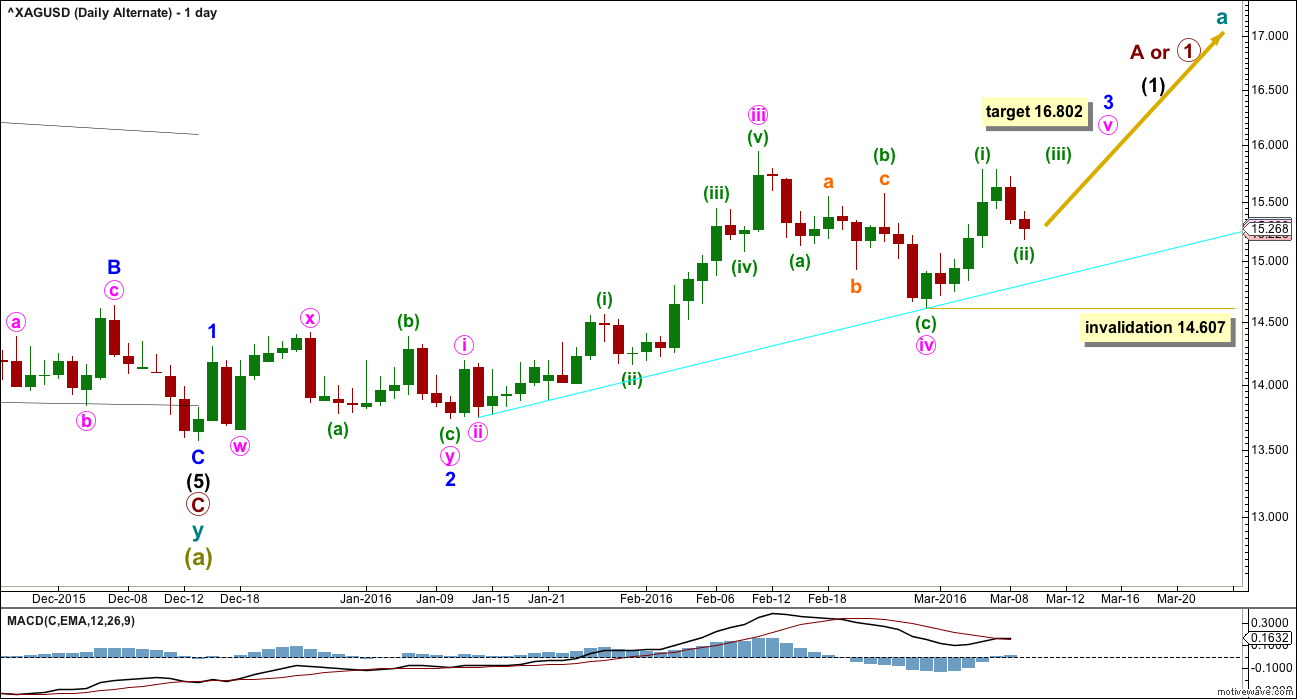
Upwards movement within minute wave v may be only minuette wave (i).
This makes no difference at this stage to the target, only to the invalidation point.
Minuette wave (ii) may not move beyond the start of minuette wave (i) below 14.607.
TECHNICAL ANALYSIS
DAILY CHART
Click chart to enlarge. Chart courtesy of StockCharts.com.
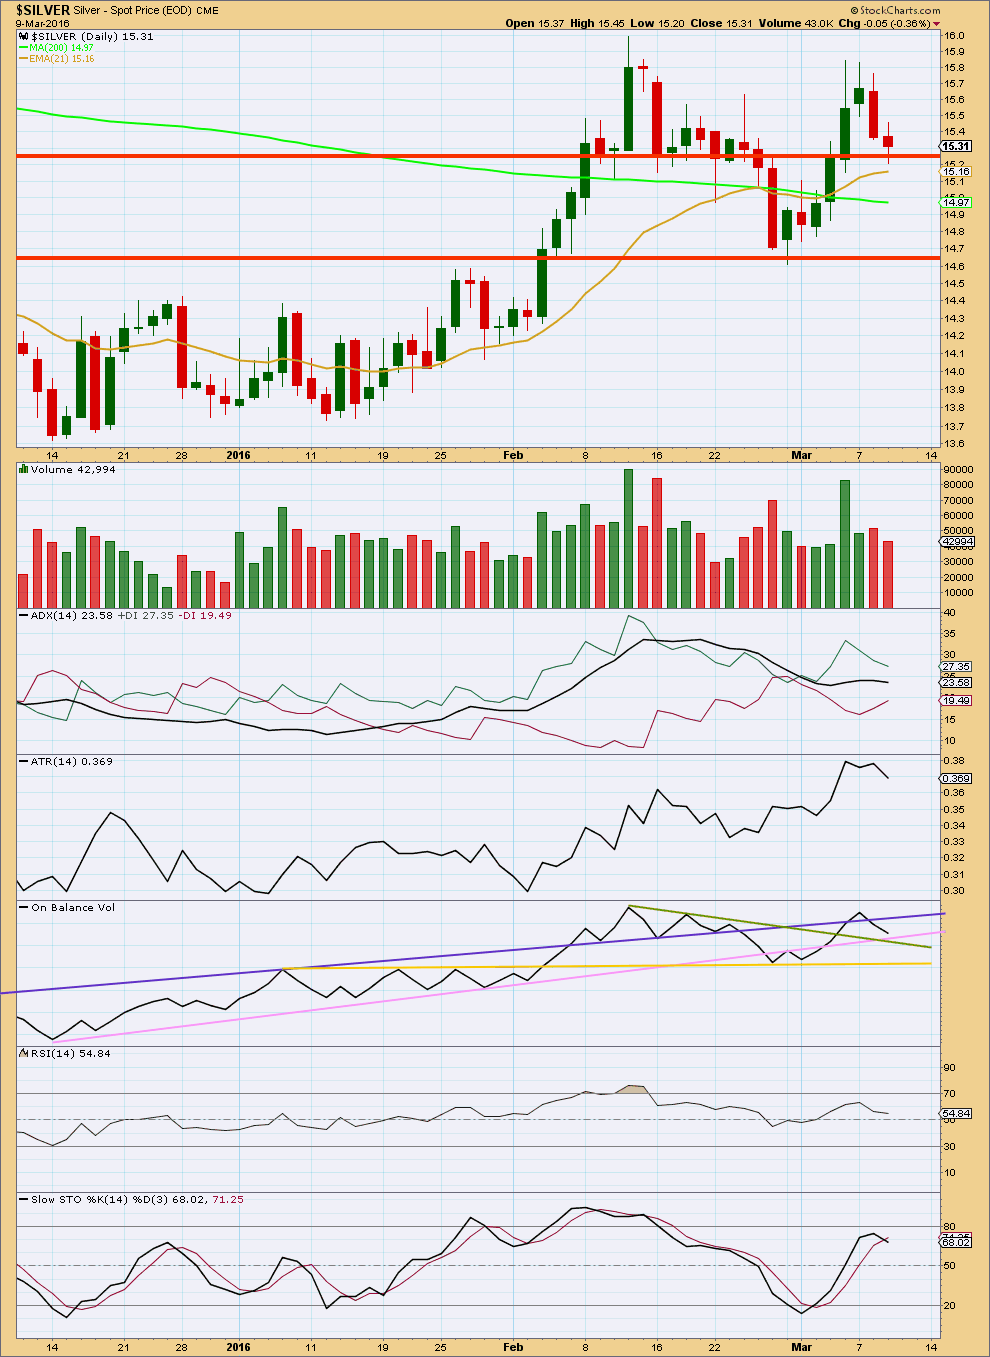
Upwards movement for 4th March on strong volume broke above the horizontal line of resistance. This looks like a small breakout. The rise in price was supported by volume. The fall in price for the last two days comes with declining volume. In the short term, the volume profile is bullish. This supports the wave count.
ADX is flat to declining indicating the market is not trending. ATR agrees as it is declining. Both these indicators are lagging as they are both based on 14 day averages.
On Balance Volume may find support at the pink trend line. This may hold price up here.
RSI is close to neutral. There is room for the market to rise or fall.
Stochastics has not quite reached overbought. A little more upwards movement may be expected at least until it does.
This analysis is published @ 03:37 a.m. EST on 10th March, 2016.