
Downwards movement was expected. This is not what happened.
The Elliott wave count was invalidated by upwards movement above 15.514.
Summary: Upwards movement is most likely over. A new low below 14.781 would confirm the main wave count and more downwards movement to a target at 14.124. A new high above 17.483 would add confidence to the alternate wave count, and the target would be 18.928.
New updates to this analysis are in bold.
WEEKLY WAVE COUNT
Click chart to enlarge.
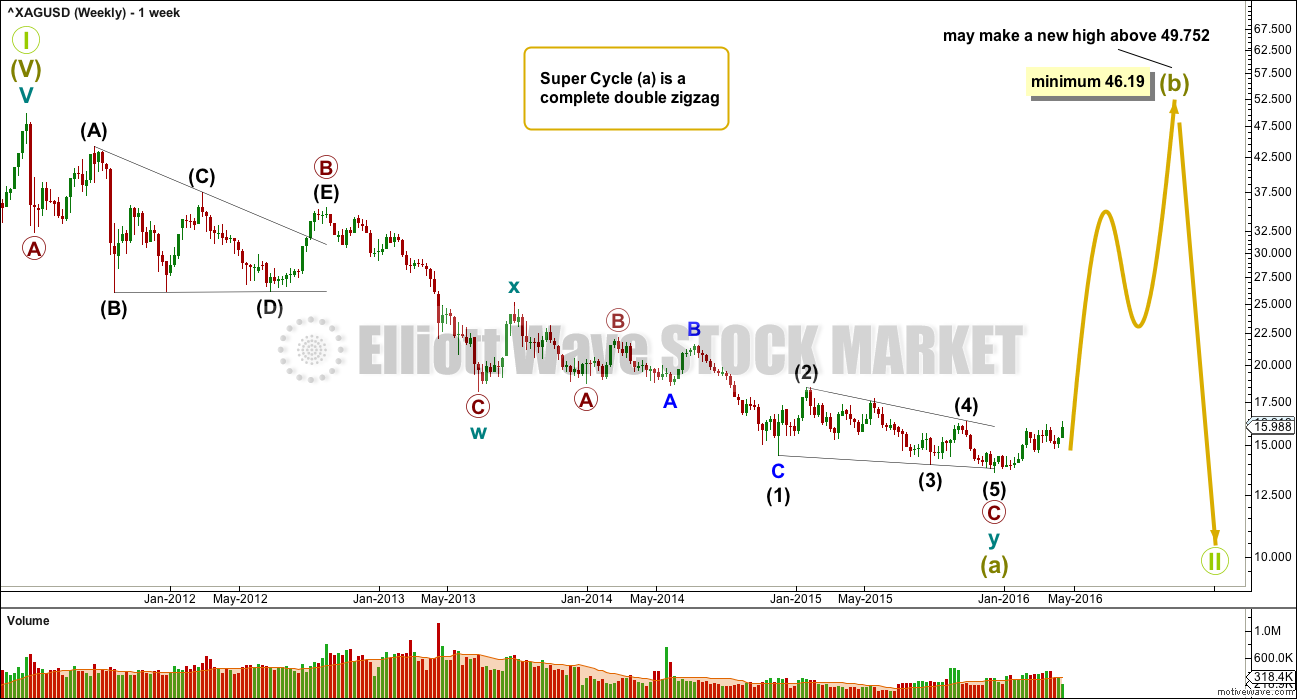
If super cycle wave (a) is a double zigzag, then within the second zigzag of the double labelled cycle wave y the structure may be complete.
Primary wave C is an ending contracting diagonal within the zigzag of cycle wave y. All subwaves subdivide as zigzags. The third wave is shorter than the first, the fifth wave is shorter than the third, and the fourth wave is shorter than the second. The trend lines converge.
There is a small overshoot of the (1)-(3) trend line at the end. This indicates the contracting diagonal structure is very likely to be complete.
If this wave count is correct, then super cycle wave (a) has subdivided as a three wave structure. That indicates Grand Super Cycle wave II may be a flat correction.
If this correction at Grand Super Cycle is a second wave (as opposed to a fourth wave), then a triangle may be eliminated.
A combination may also be eliminated because the first wave is a multiple. Combinations may only consist of a maximum of three corrective structures, so within each of W, Y and Z they may only subdivide into simple A-B-C structures (or A-B-C-D-E in the case of triangles). To label multiples within multiples increases the maximum beyond three, violating the rule.
Super Cycle wave (b) must retrace a minimum 90% of super cycle wave (a) at 46.19. Super cycle wave (b) may make a new price extreme beyond that seen for super cycle wave (a) above 49.752 as in an expanded flat.
Super cycle wave (b) may be any one of 23 possible corrective structures. It is impossible to predict at this early stage which one it will be, only to say it is unlikely to be a rare structure such as a running flat, expanding triangle or triple combination. That still leaves multiple structural possibilities. The most likely structure which would be able to meet the minimum price requirement at 23.945 is a zigzag.
The first movement up for a wave of this large degree must subdivide as a clear five at the daily chart level, and probably at the weekly chart level also.
DAILY WAVE COUNT
Click chart to enlarge.
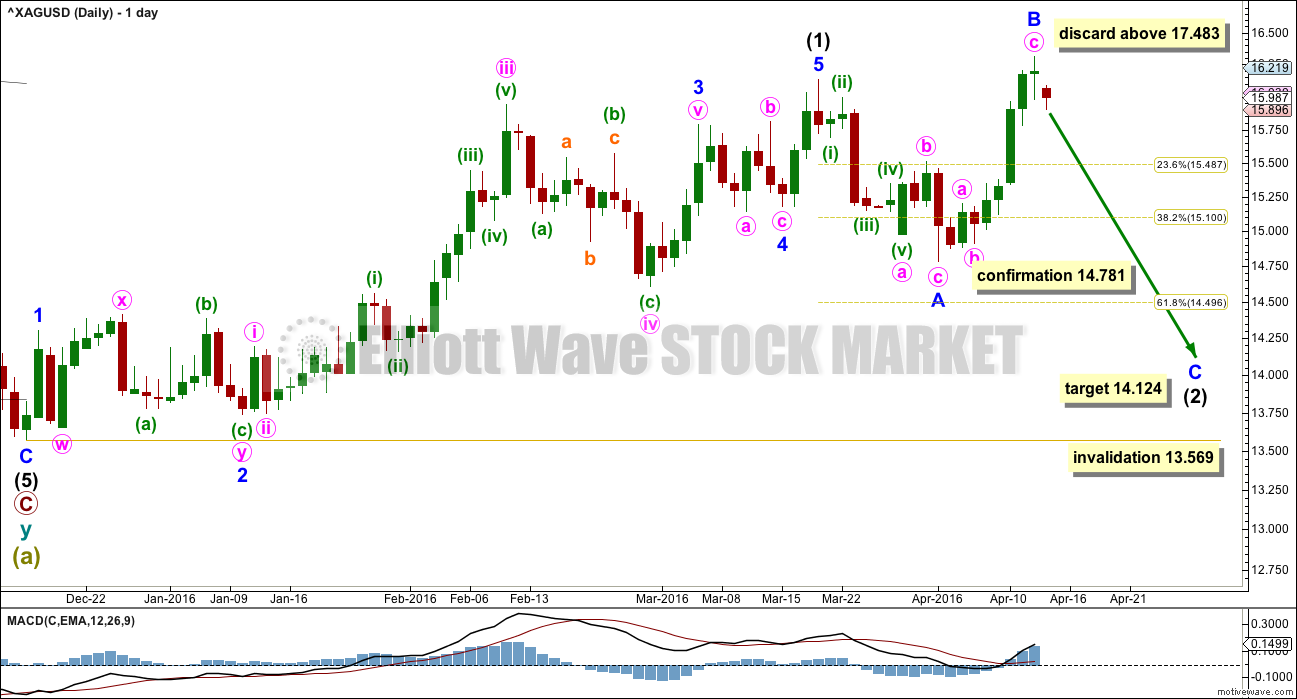
Minor wave A was not complete as a five wave structure as per last week’s analysis. It had ended as a three wave structure at the last low.
Upwards movement over the last week is most likely a zigzag for minor wave B. Minor wave B is a 1.13 length of minor wave A, within the normal range of a B wave for a flat correction of 1 to 1.38.
Intermediate wave (2) may be unfolding as a very common expanded flat correction.
At 14.124 minor wave C would reach 1.618 the length of minor wave A. Minor wave C may last about two weeks.
Intermediate wave (2) may not move beyond the end of intermediate wave (1) below 13.569.
Unfortunately, there is no rule stating a limit for a B wave within a flat correction. Minor wave B may continue higher. If it does, then when it reaches twice the length of minor wave A at 17.483 the probability that a flat is unfolding would be so low the idea should be discarded.
ALTERNATE DAILY WAVE COUNT
Click chart to enlarge.
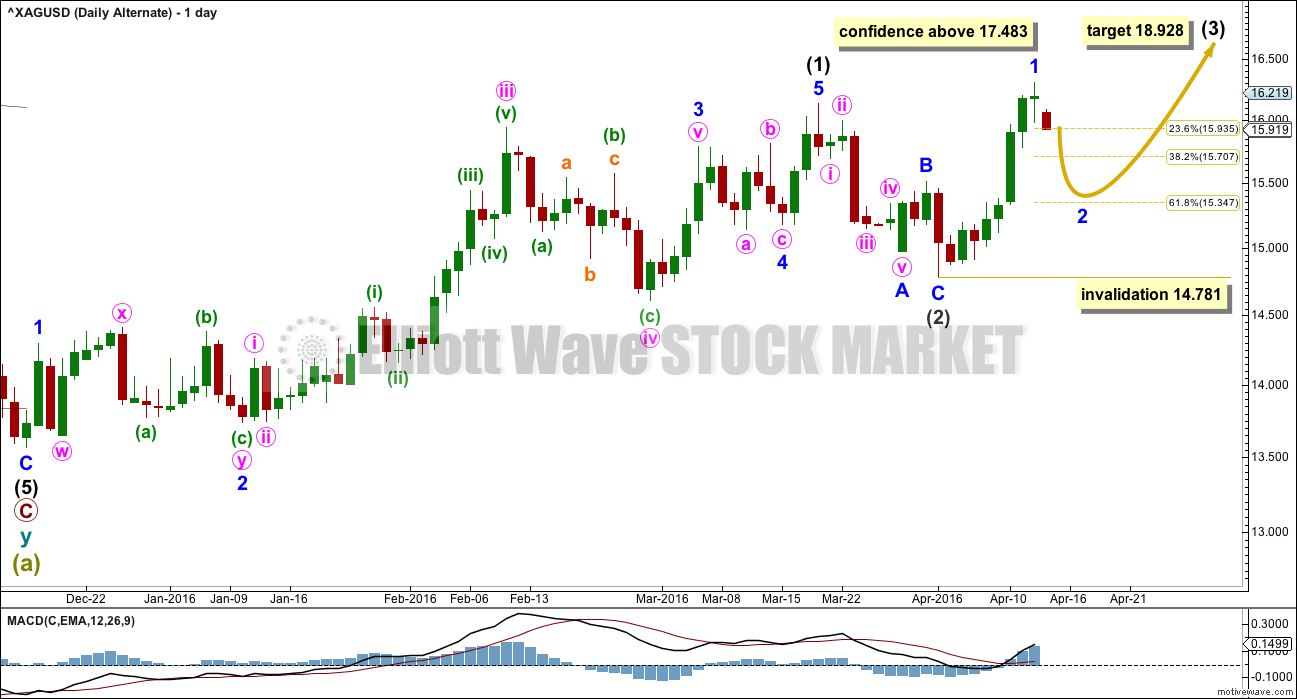
This alternate looks at the possibility that upwards movement is not a B wave but the start of intermediate wave (3).
This wave count has a lower probability than the main wave count for the following reasons:
1. Intermediate wave (2) would be more shallow than second wave corrections normally are, particularly the first big second wave correction of a new trend.
2. Intermediate wave (2) would have lasted just 10 days to correct the 66 days of intermediate wave (1). The proportions of this wave count do not look right.
3. The start of a big third wave should have stronger momentum than this upwards movement. The divergence with price and MACD at the last high shows upwards movement is weak. This would be highly unusual for a third wave.
If upwards movement continues above 17.483, the main wave count would be discarded. This alternate would then be the only wave count.
Minor wave 2 may not move beyond the start of minor wave 1 below 14.781.
TECHNICAL ANALYSIS
DAILY CHART
Click chart to enlarge. Chart courtesy of StockCharts.com.
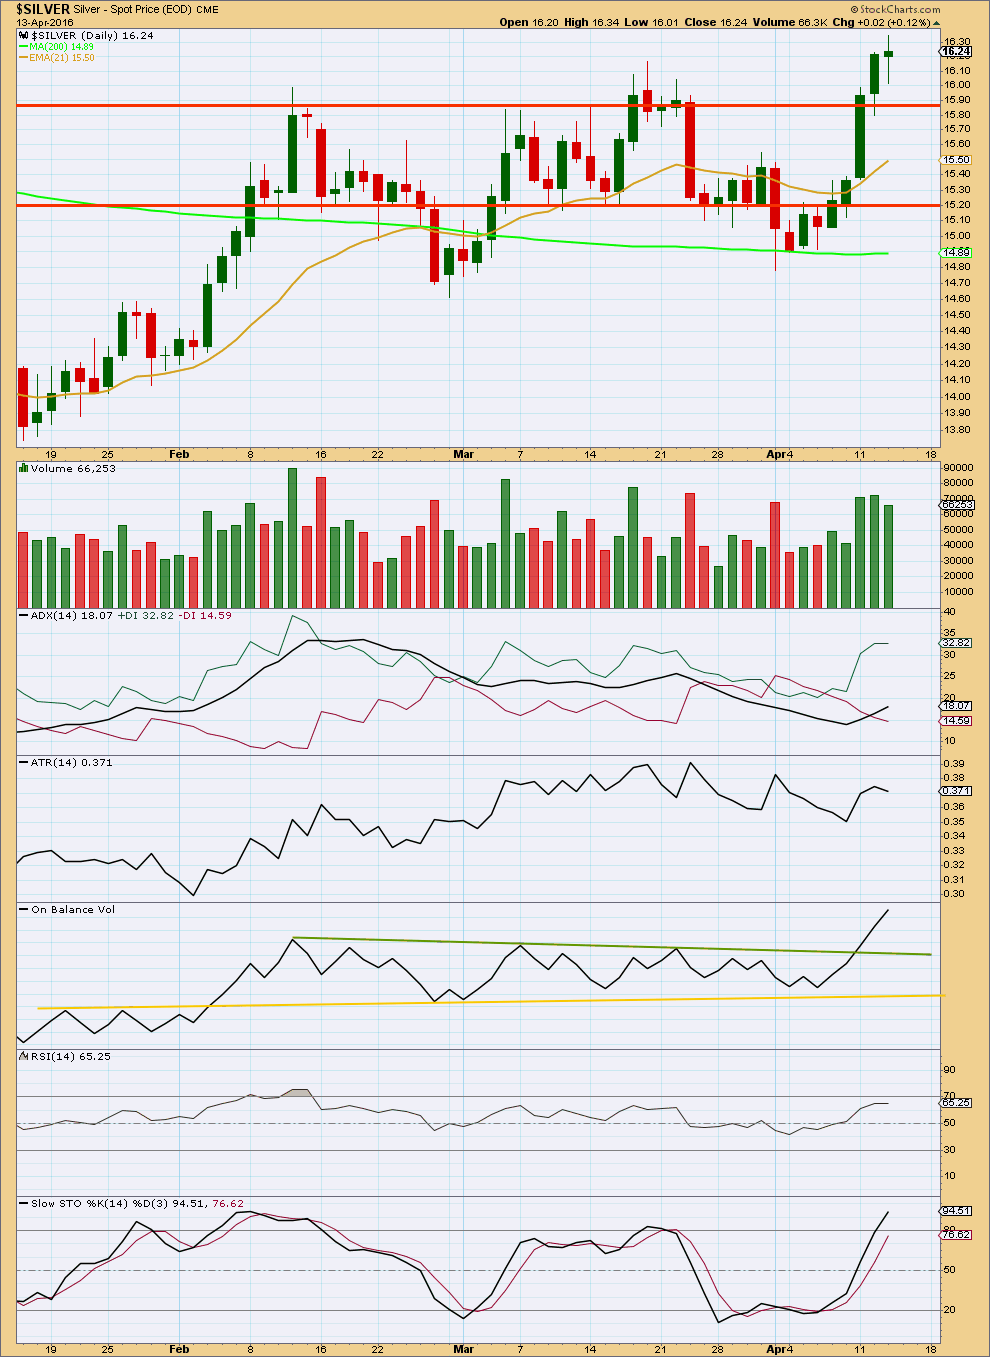
What looked like a classic downwards breakout last week turned out to be false, even though it looked to be strongly supported by volume.
Price moved higher on increasing volume overall. The daily candlestick for 13th April looks like the trend may be stalling; the candlestick is a doji, representing indecision, and it comes with lighter volume. If the next session for 14th April closes with a red daily candlestick moving lower well into the body of the daily candlestick of 12th April, then an Evening Doji Star candlestick pattern would be formed indicating a trend change.
ADX is increasing indicating the market is trending. The trend is up because the +DX line is above the -DX line.
ATR is unclear. Overall, it looks to be moving sideways. It is not in agreement with ADX, so a trend is not clear.
On Balance Volume gave a strong bullish signal on the strong upwards day of 11th April with a break above the green trend line. If OBV breaks below that line it would be a strong bearish signal.
RSI is not yet overbought. There is room for price to rise further.
Stochastics is only beginning to move into overbought. There is room for price to rise further.
This analysis is published @ 04:40 a.m. EST on 14th April, 2016.