
More downwards movement was expected for Silver. Price has moved lower but not as much as expected.
Summary: On balance, the expectation is for Silver to move a little lower for at least a few days. However, the picture is somewhat unclear. If a new high above 17.72 comes on a day with increased volume, then expect a big third wave up may be underway.
New updates to this analysis are in bold.
WEEKLY WAVE COUNT
Click chart to enlarge.
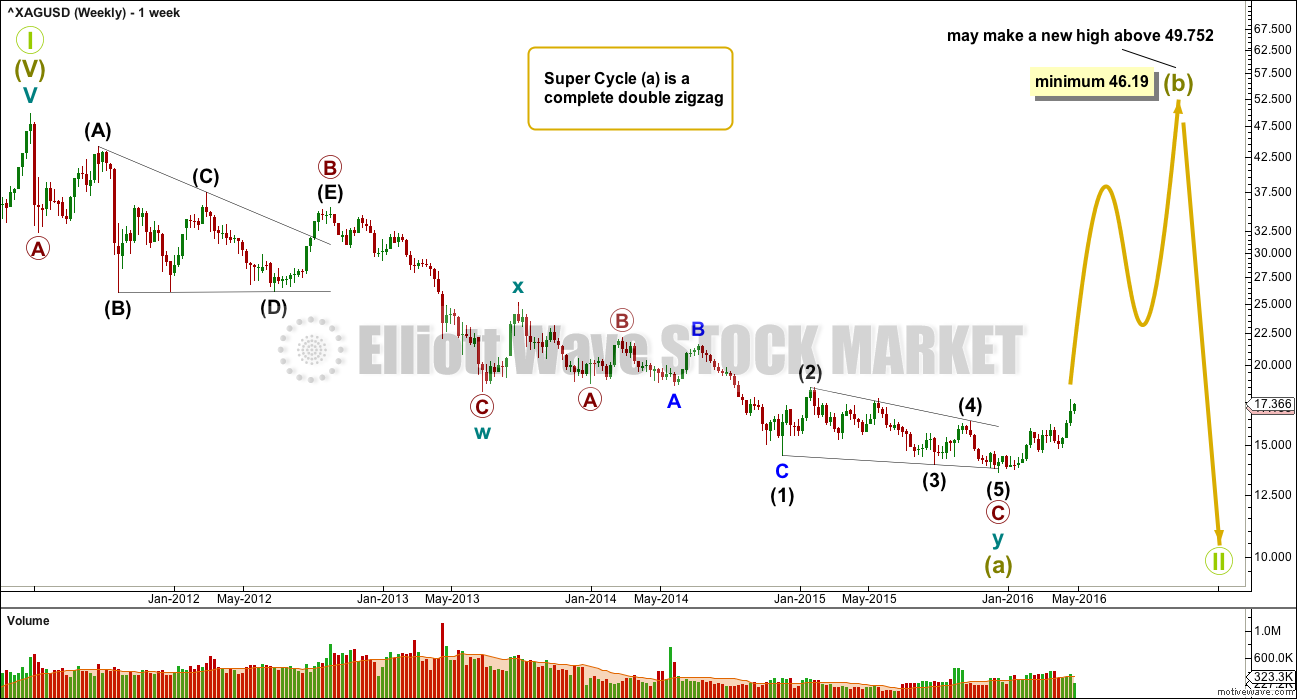
If super cycle wave (a) is a double zigzag, then within the second zigzag of the double labelled cycle wave y the structure may be complete.
Primary wave C is an ending contracting diagonal within the zigzag of cycle wave y. All subwaves subdivide as zigzags. The third wave is shorter than the first, the fifth wave is shorter than the third, and the fourth wave is shorter than the second. The trend lines converge.
There is a small overshoot of the (1)-(3) trend line at the end. This indicates the contracting diagonal structure is very likely to be complete.
If this wave count is correct, then super cycle wave (a) has subdivided as a three wave structure. That indicates Grand Super Cycle wave II may be a flat correction.
If this correction at Grand Super Cycle is a second wave (as opposed to a fourth wave), then a triangle may be eliminated.
A combination may also be eliminated because the first wave is a multiple. Combinations may only consist of a maximum of three corrective structures, so within each of W, Y and Z they may only subdivide into simple A-B-C structures (or A-B-C-D-E in the case of triangles). To label multiples within multiples increases the maximum beyond three, violating the rule.
Super Cycle wave (b) must retrace a minimum 90% of super cycle wave (a) at 46.19. Super cycle wave (b) may make a new price extreme beyond that seen for super cycle wave (a) above 49.752 as in an expanded flat.
Super cycle wave (b) may be any one of 23 possible corrective structures. It is impossible to predict at this early stage which one it will be, only to say it is unlikely to be a rare structure such as a running flat, expanding triangle or triple combination. That still leaves multiple structural possibilities. The most likely structure which would be able to meet the minimum price requirement at 23.945 is a zigzag.
The first movement up for a wave of this large degree must subdivide as a clear five at the daily chart level, and probably at the weekly chart level also.
DAILY WAVE COUNT
Click chart to enlarge.
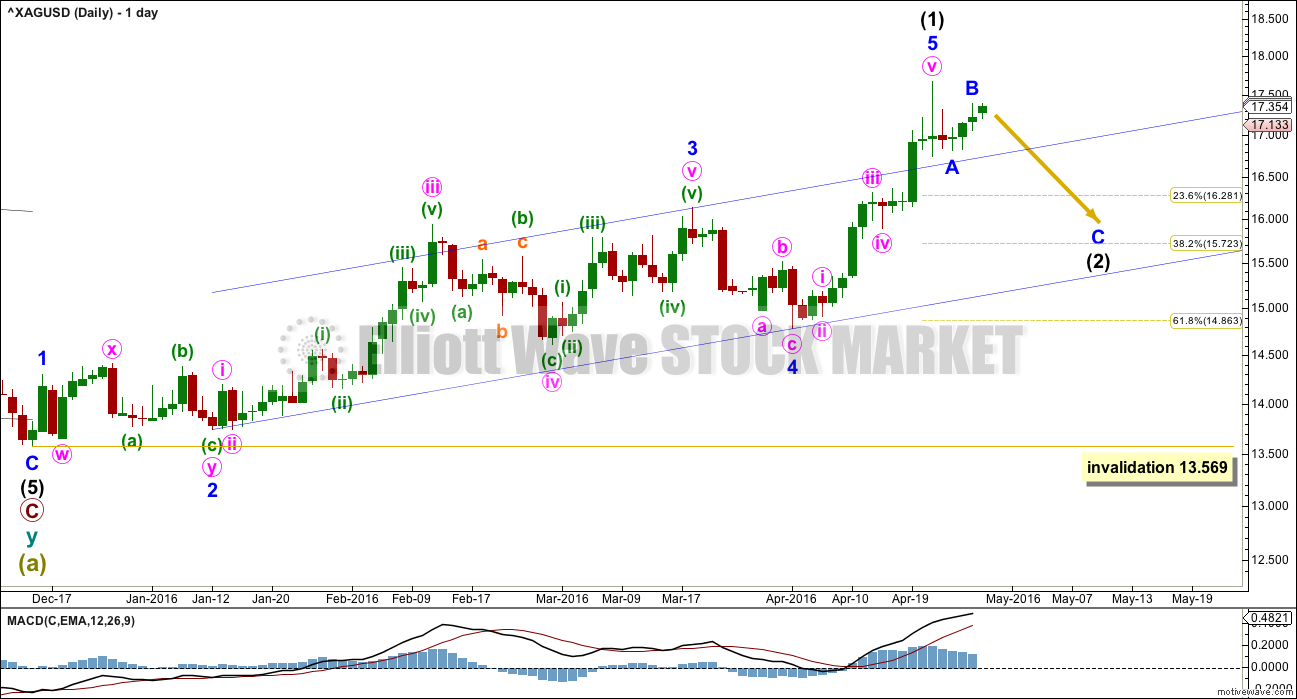
The last wave up to the high labelled intermediate wave (1) still looks like a fifth wave typical of commodities, ending on a blowoff top. This is still my main wave count for this reason.
If this is correct, then intermediate wave (2) cannot be over at the low labelled minor wave A. That would be absurdly shallow and brief for an intermediate degree correction.
Intermediate wave (2) may be unfolding as a zigzag. At 15.985 minor wave C would reach 1.618 the length of minor wave A. If minor wave B moves higher, this target must be recalculated.
Draw a channel about intermediate wave (1) using Elliott’s second technique: draw the first trend line from the ends of minor waves 2 to 4, then place a parallel copy on the end of minor wave 3. The end of minute wave iii overshoots the channel, which is typical for the middle of a third wave. The fifth wave of minor 5 also overshoots the channel, which is typical of a swift strong fifth wave in commodities. This wave count has a typical look.
Intermediate wave (1) lasted 90 days, one longer than a Fibonacci 89. Intermediate wave (2) may be expected to most likely last either a Fibonacci 34, 55, 89 or maybe even 144 days. It is most likely to end about the 0.618 Fibonacci ratio of intermediate wave (1) about 14.863. It does not have to be this long in duration. So far it has lasted five days. The earliest it could complete may be a Fibonacci 13. When it looks like a complete three wave structure, then it may be over.
Intermediate wave (2) may not move beyond the start of intermediate wave (1) below 13.569.
The alternate will be published this week as it is more in line with expectations for Gold. However, Silver and Gold do not always move together. They are different markets with different Elliott wave counts. Notice that since 4th April while Silver has moved strongly higher for what looks like a strong fifth wave typical of commodities, complete with a blowoff top, Gold has moved only sideways in a narrowing consolidation. These markets have not been moving together, so any expectation that they must now do so would be misplaced.
ALTERNATE DAILY WAVE COUNT
Click chart to enlarge.
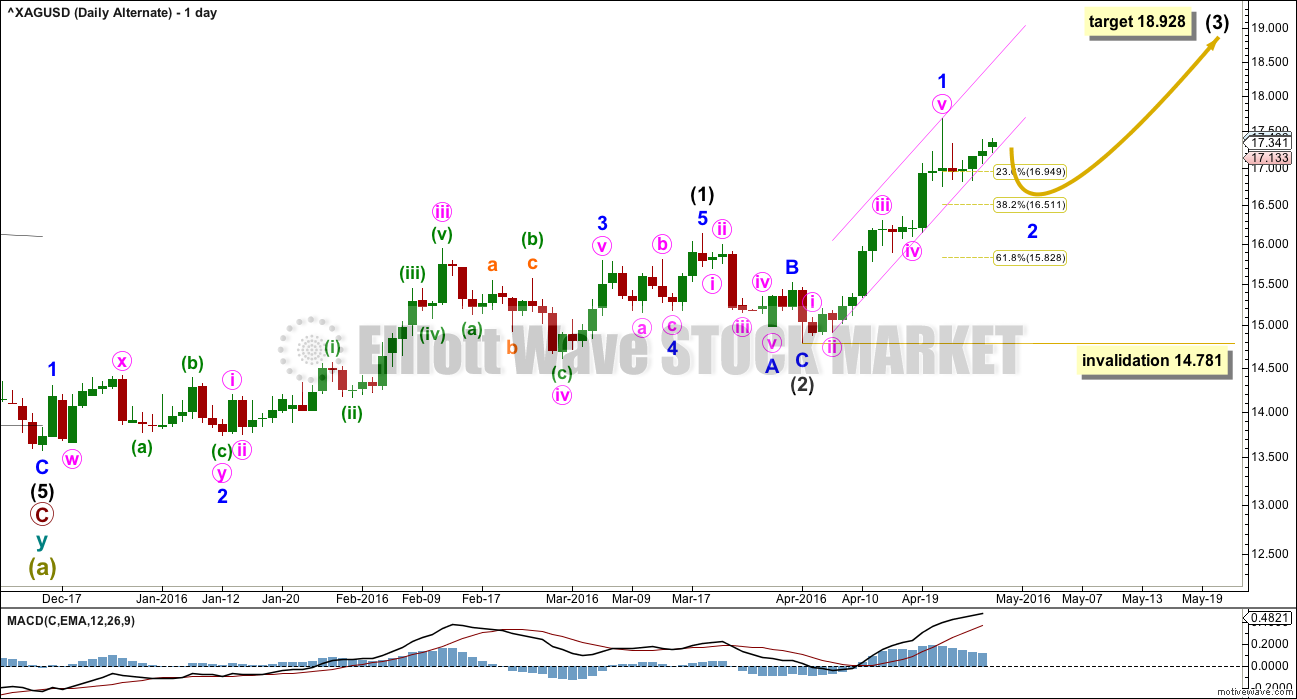
Intermediate wave (2) may have been over earlier as labelled. It would be a relatively brief second wave correction lasting only 10 days to intermediate wave (1) at 66 days. It would have been relatively deep at 0.52 the depth of intermediate wave (1).
The biggest problem with this wave count is it sees what looks like a strong wave typically a fifth wave for a commodity as a first wave. This is possible, and at this stage all possibilities should be considered.
Minor wave 2 would be unlikely to be over as it has not breached the small channel containing minor wave 1. It may correct to either the 0.382 or 0.618 Fibonacci ratios of minor wave 1.
When minor wave 2 has breached the small channel containing minor wave 1 and it looks like a three wave structure, then minor wave 3 upwards may be expected to begin.
If price makes a new high above 17.72 on a day with increasing volume, then minor wave 2 may already be over. If that happens, then minor wave 3 within intermediate wave (3) may be underway.
TECHNICAL ANALYSIS
DAILY CHART
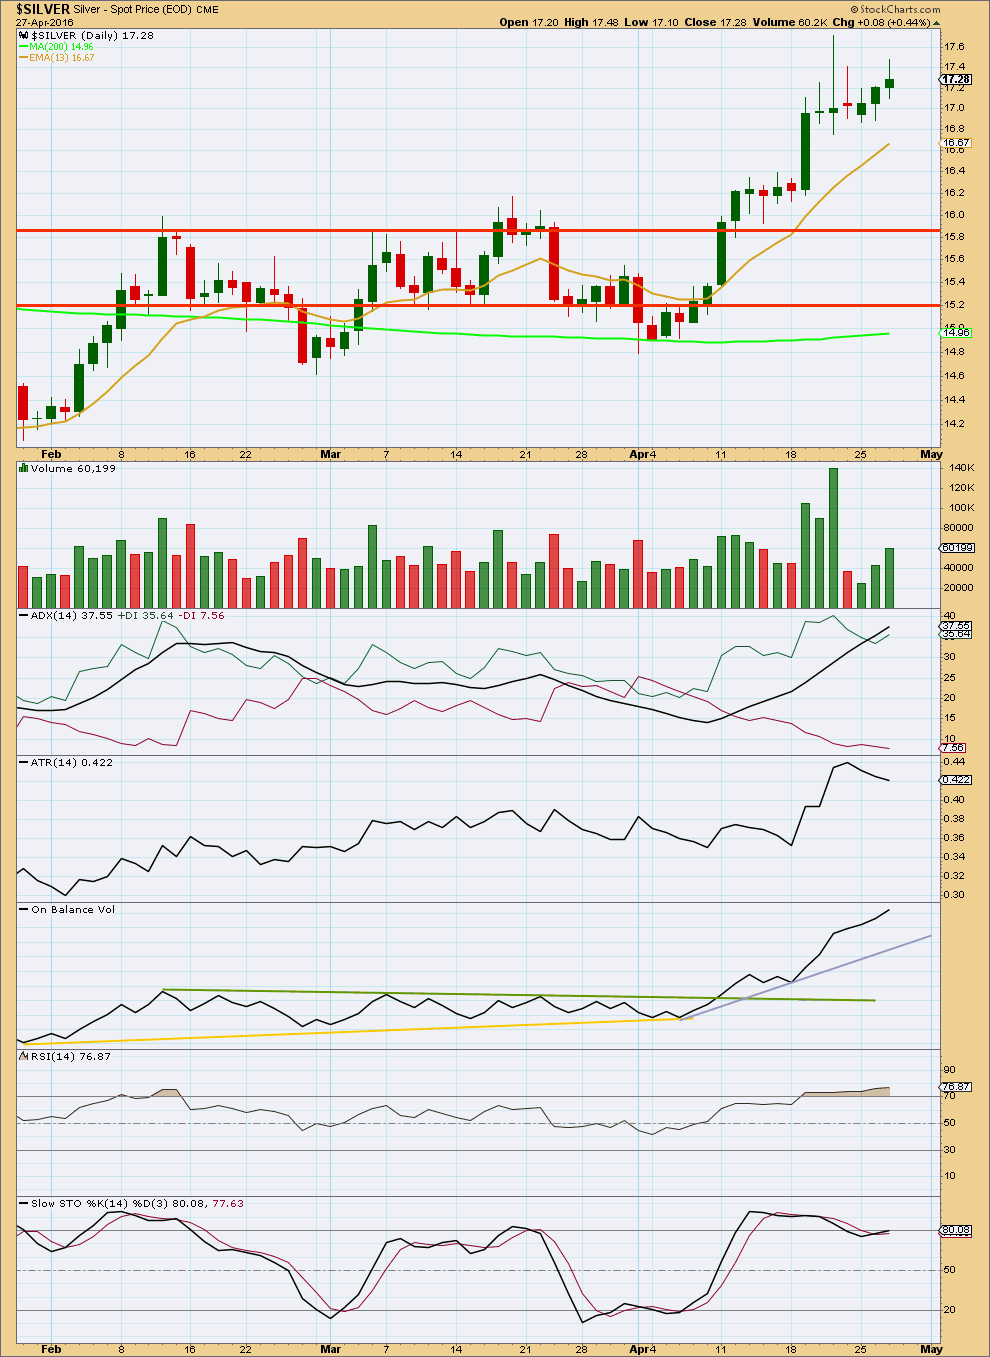
Click chart to enlarge. Chart courtesy of StockCharts.com.
In the short term, volume indicates support for upwards movement, so it should be expected to continue. This does not support either Elliott wave count as they both expect at least a little more downwards movement first.
Volume is clearly bullish, supporting the rise in price.
ADX indicates the market is strongly trending. For the last few days ATR disagrees as it is declining.
On Balance Volume has no close by trend lines to assist in indicating the next direction for price. What OBV is showing however is divergence with price. As price has made lower highs in the last three sessions (lower than the peak of 21st April), OBV is making higher highs. This indicates weakness in price. Despite strength from OBV it is failing to translate into corresponding strength in price.
RSI shows the same hidden bearish divergence. As price is making lower highs RSI has moved more into overbought territory, making higher highs. Despite the strength from RSI increasing it is failing to translate into a corresponding increase in price. Price is weak.
On balance, despite volume favouring more upwards movement, the divergence from On Balance Volume and particularly RSI has a little more weight. This in conjunction with the Elliott wave counts indicates it is more likely that Silver will move a little lower for at least a few days before resuming an upwards trend.
This analysis is published @ 05:46 a.m. EST on 28th April, 2016.