
A correction was expected for Silver, which is so far what has happened over the last week.
Summary: A correction may be over for Silver. A strong upwards movement may be ahead. A short term target is at 22.09. A longer term target is now at 25.63.
New updates to this analysis are in bold.
WEEKLY WAVE COUNT
Click chart to enlarge.
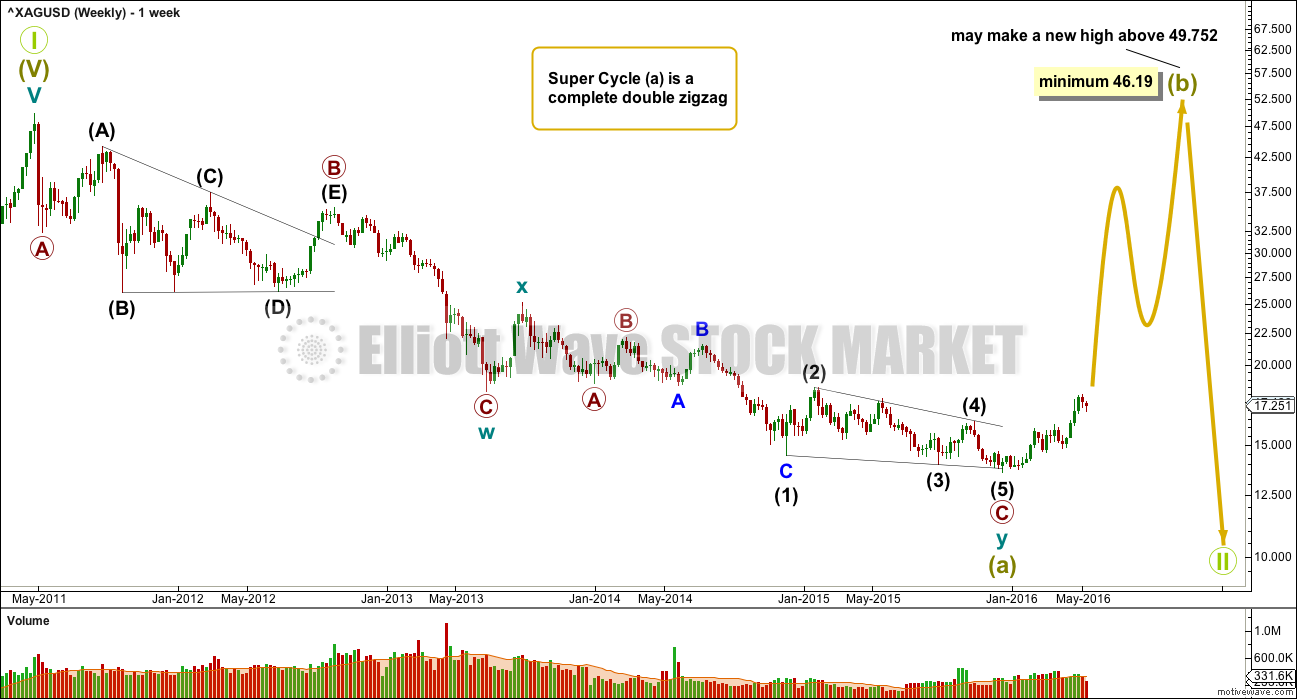
If super cycle wave (a) is a double zigzag, then within the second zigzag of the double labelled cycle wave y the structure may be complete.
Primary wave C is an ending contracting diagonal within the zigzag of cycle wave y. All subwaves subdivide as zigzags. The third wave is shorter than the first, the fifth wave is shorter than the third, and the fourth wave is shorter than the second. The trend lines converge.
There is a small overshoot of the (1)-(3) trend line at the end. This indicates the contracting diagonal structure is very likely to be complete.
If this wave count is correct, then super cycle wave (a) has subdivided as a three wave structure. That indicates Grand Super Cycle wave II may be a flat correction.
If this correction at Grand Super Cycle is a second wave (as opposed to a fourth wave), then a triangle may be eliminated.
A combination may also be eliminated because the first wave is a multiple. Combinations may only consist of a maximum of three corrective structures, so within each of W, Y and Z they may only subdivide into simple A-B-C structures (or A-B-C-D-E in the case of triangles). To label multiples within multiples increases the maximum beyond three, violating the rule.
Super Cycle wave (b) must retrace a minimum 90% of super cycle wave (a) at 46.19. Super cycle wave (b) may make a new price extreme beyond that seen for super cycle wave (a) above 49.752 as in an expanded flat.
Super cycle wave (b) may be any one of 23 possible corrective structures. It is impossible to predict at this early stage which one it will be, only to say it is unlikely to be a rare structure such as a running flat, expanding triangle or triple combination. That still leaves multiple structural possibilities. The most likely structure which would be able to meet the minimum price requirement at 23.945 is a zigzag.
The first movement up for a wave of this large degree must subdivide as a clear five at the daily chart level, and probably at the weekly chart level also.
MAIN DAILY WAVE COUNT
Click chart to enlarge.
This week’s classic technical analysis for Silver favours this wave count.
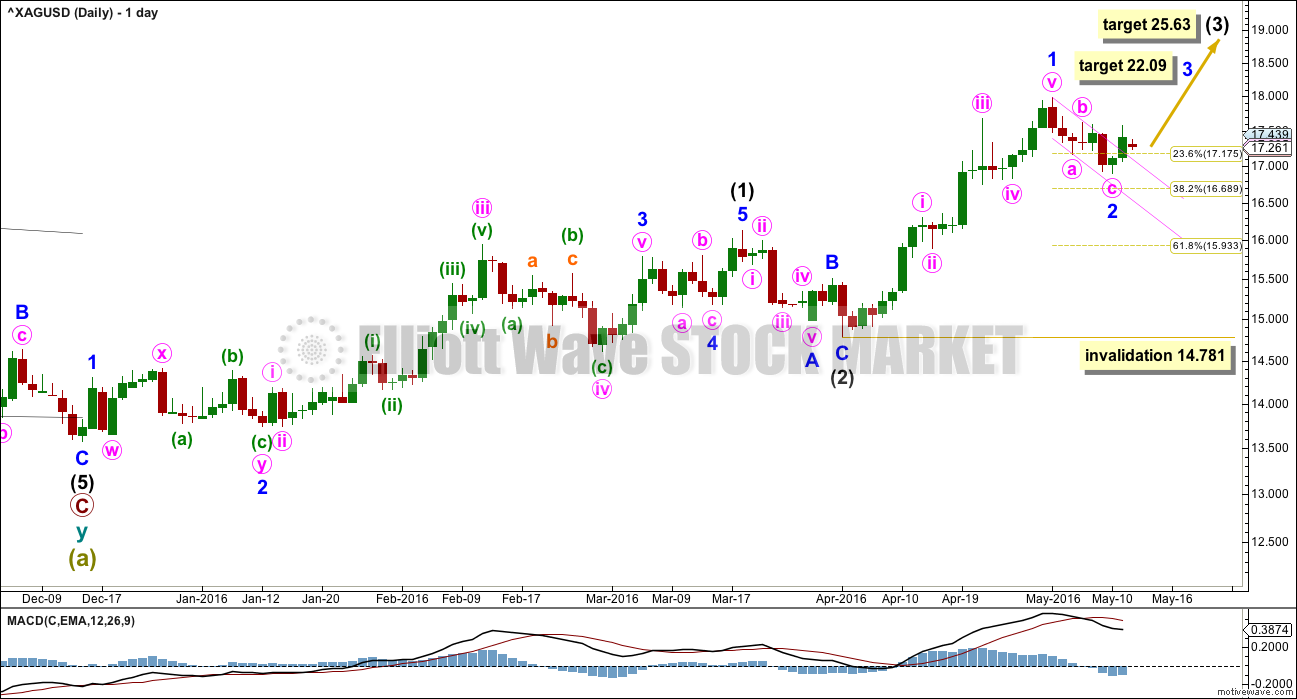
Silver may be ready to move up strongly in the middle of a third wave at two degrees.
Minor wave 2 is a complete three wave structure on the daily chart. It has breached a channel which could be drawn about minor wave 1 (on last week’s chart). Now a small channel about minor wave 2 (pink) is breached by upwards movement. This indicates that minor wave 2 may be over and minor wave 3 upwards may be underway.
Alternatively, the degree of labelling within minor wave 2 may be moved down one degree. Minute wave a may have completed a three wave structure and minor wave 2 may be unfolding as a flat correction.
Alternatively, the complete zigzag for minor wave 2 may be only the first zigzag of a double to take minor wave 2 lower.
What looks more likely from classic technical analysis is more upwards movement from here for Silver.
At 22.09 minor wave 3 would reach 1.618 the length of minor wave 1.
Minor wave 4 may be expected to be deep if minor wave 2 is over here as a shallow zigzag.
At 25.63 intermediate wave (3) would reach 4.236 the length of intermediate wave (1).
If minor wave 2 continues lower, then it may not move below the start of minor wave 1 at 14.781. If minor wave 2 moves lower, then the target for minor wave 3 must move correspondingly lower also.
SECOND DAILY WAVE COUNT
Click chart to enlarge.
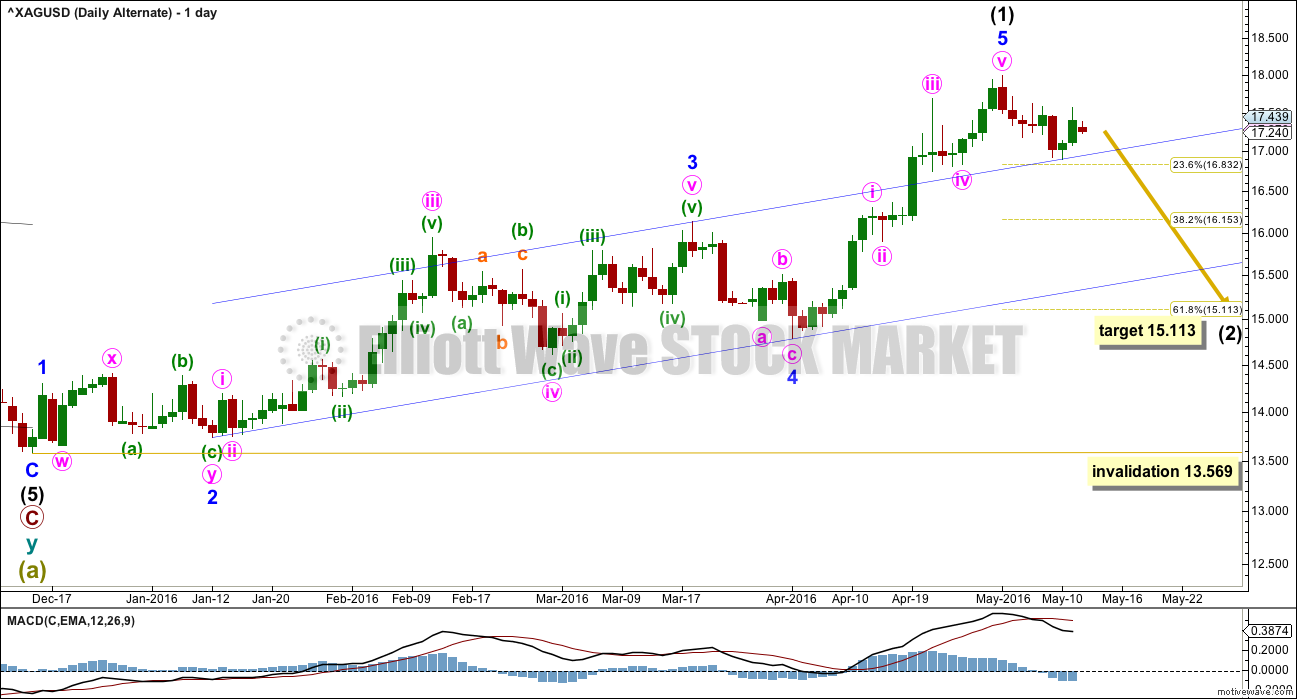
It is still possible that Silver may continue lower for a few weeks in an intermediate degree correction.
Intermediate wave (2) should be expected to be likely to break below the channel containing intermediate wave (1).
The most likely target for intermediate wave (2) would be the 0.618 Fibonacci ratio at 15.113.
If this wave count is correct, then there has been a trend change for Silver at intermediate degree. Downwards movement should show an increase in volume. That is not happening.
TECHNICAL ANALYSIS
DAILY CHART
Click chart to enlarge. Chart courtesy of StockCharts.com.
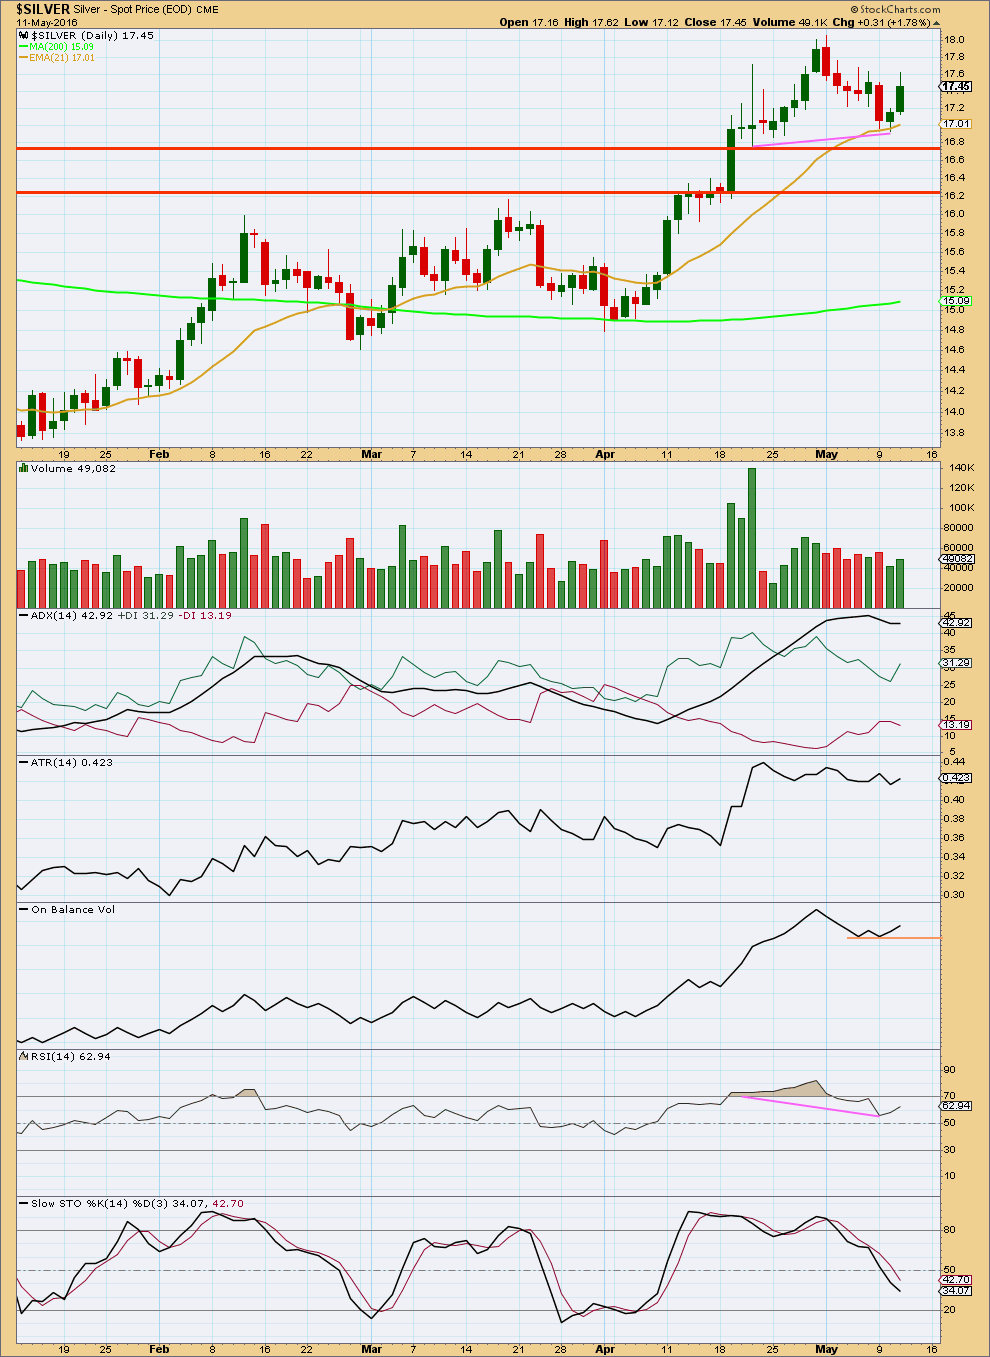
This week Silver no longer looks overbought.
From the high on 2nd May, volume is flat to declining as price falls. The fall in price is not well supported by volume, so it is somewhat suspicious.
The last two upwards days come with some increase in volume for the second day. There was some support for the rise in price. But volume for these two days remains relatively light compared to recent days. The support is not clear. These two days may certainly be a small rally within a larger downwards movement that is not yet complete.
ADX is declining until today where it may be beginning to slightly increase. ADX is now below 45, so there is again some room for an upwards trend to continue from here.
ATR is overall flat indicating the market is not trending.
Both ADX and ATR are in agreement: the market is not trending. However, these two indicators are lagging as they are based on 14 day averages.
It is difficult to find a reasonable trend line for On Balance Volume at this stage. The short orange line has little technical significance, but it may offer some support.
On Balance Volume exhibits some divergence with price between the lows of 4-5th of May and 10th of May. While price made new lows, OBV did not and remained essentially flat. This is regular bullish divergence and indicates weakness to downwards movement.
RSI also exhibits divergence with price. From the low for price on 21st April to 10th of May (pink lines), price has made a higher low while RSI has made a lower low. This is hidden bullish divergence; RSI is indicating underlying strength. This divergence is strong and covers a reasonable time period. While I do not give much weight to divergence with many oscillators, I do give reasonable weight to divergence with RSI.
RSI is not extreme. There is room for price to rise or fall.
Stochastics is returning from overbought. It has not yet reached oversold.
Price may find some support about the 21 day moving average. This Fibonacci number seems to work reasonably well for Silver when it is trending. It may be working here as so far it looks like price has bounced off this line.
This analysis is published @ 04:46 a.m. EST on 12th May, 2016.