
Last week’s analysis expected more downwards movement towards a target at 16.297.
Price has reached 16.181.
Summary: The structure is incomplete. More downwards movement is expected. The first wave count target is at 15.933. The second wave count target is at 15.113. Risk to short positions here is at 16.900. A small fourth wave correction may unfold, lasting one to two days, before the downwards trend resumes.
New updates to this analysis are in bold.
WEEKLY WAVE COUNT
Click chart to enlarge.
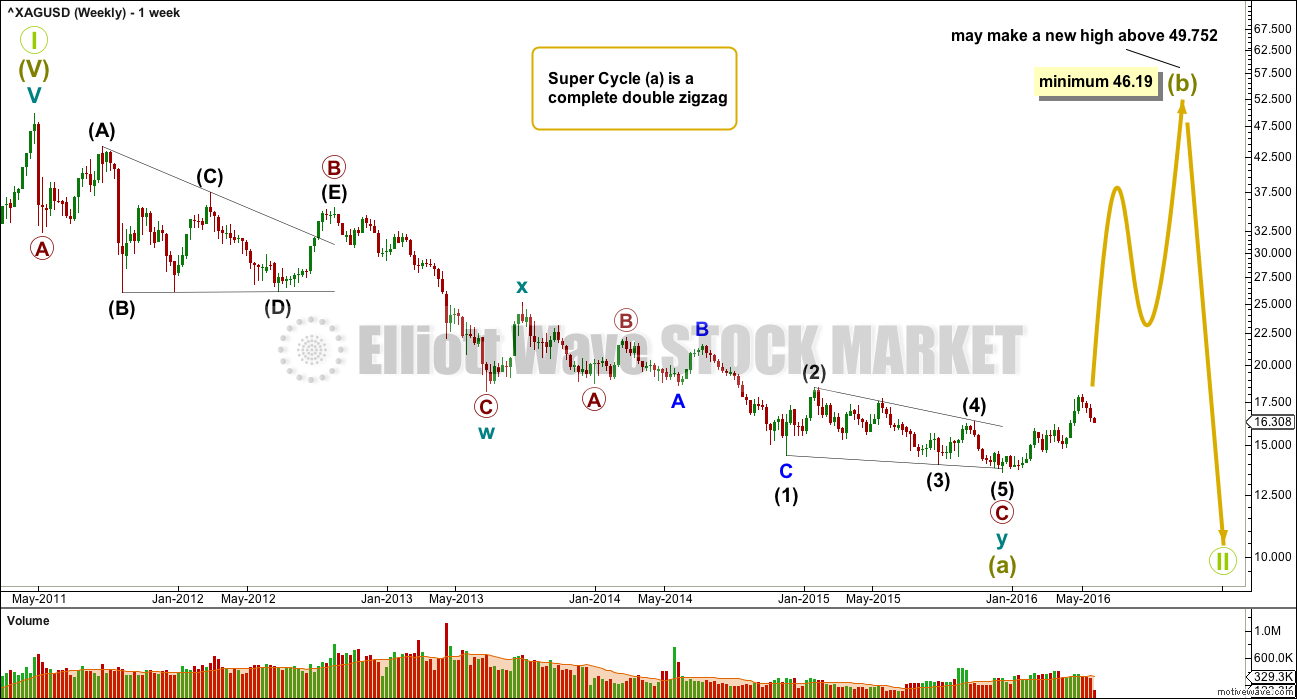
If super cycle wave (a) is a double zigzag, then within the second zigzag of the double labelled cycle wave y the structure may be complete.
Primary wave C is an ending contracting diagonal within the zigzag of cycle wave y. All subwaves subdivide as zigzags. The third wave is shorter than the first, the fifth wave is shorter than the third, and the fourth wave is shorter than the second. The trend lines converge.
There is a small overshoot of the (1)-(3) trend line at the end. This indicates the contracting diagonal structure is very likely to be complete.
If this wave count is correct, then super cycle wave (a) has subdivided as a three wave structure. That indicates Grand Super Cycle wave II may be a flat correction.
If this correction at Grand Super Cycle is a second wave (as opposed to a fourth wave), then a triangle may be eliminated.
A combination may also be eliminated because the first wave is a multiple. Combinations may only consist of a maximum of three corrective structures, so within each of W, Y and Z they may only subdivide into simple A-B-C structures (or A-B-C-D-E in the case of triangles). To label multiples within multiples increases the maximum beyond three, violating the rule.
Super Cycle wave (b) must retrace a minimum 90% of super cycle wave (a) at 46.19. Super cycle wave (b) may make a new price extreme beyond that seen for super cycle wave (a) above 49.752 as in an expanded flat.
Super cycle wave (b) may be any one of 23 possible corrective structures. It is impossible to predict at this early stage which one it will be, only to say it is unlikely to be a rare structure such as a running flat, expanding triangle or triple combination. That still leaves multiple structural possibilities. The most likely structure which would be able to meet the minimum price requirement at 23.945 is a zigzag.
The first movement up for a wave of this large degree must subdivide as a clear five at the daily chart level, and probably at the weekly chart level also.
FIRST DAILY WAVE COUNT
Click chart to enlarge.
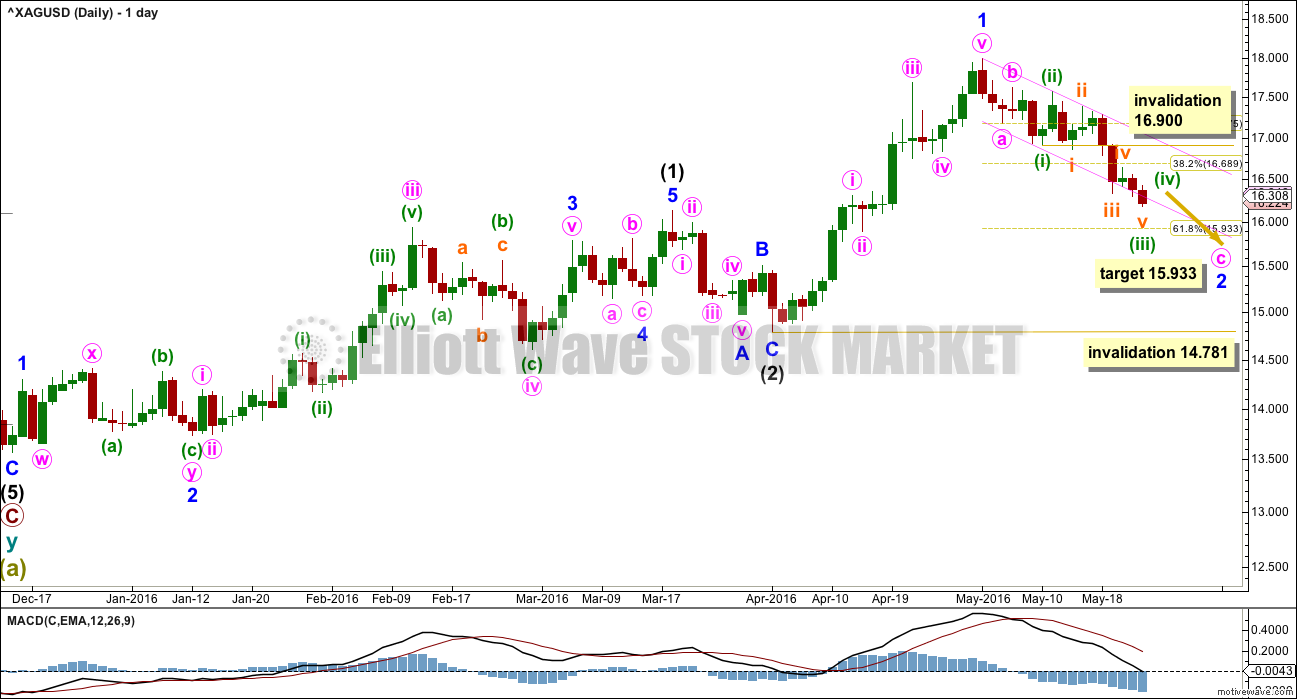
Minor wave 2 is moving lower and subdividing as a zigzag. Minute wave c now looks like it is subdividing as an impulse, not an ending diagonal.
Within the impulse of minute wave c, the middle of the third wave may be over. Minuette wave (iii) is a complete impulse.
Minuette wave (iv) may not move into minuette wave (i) price territory above 16.900.
The last fifth wave down of minuette wave (v) may be swift and strong, typical of commodities.
Minor wave 2 may end about the 0.618 Fibonacci ratio of minor wave 1 at 15.933.
The channel is a best fit. If it is breached by strong downwards movement, then look for price to find resistance at the lower trend line.
SECOND DAILY WAVE COUNT
Click chart to enlarge.
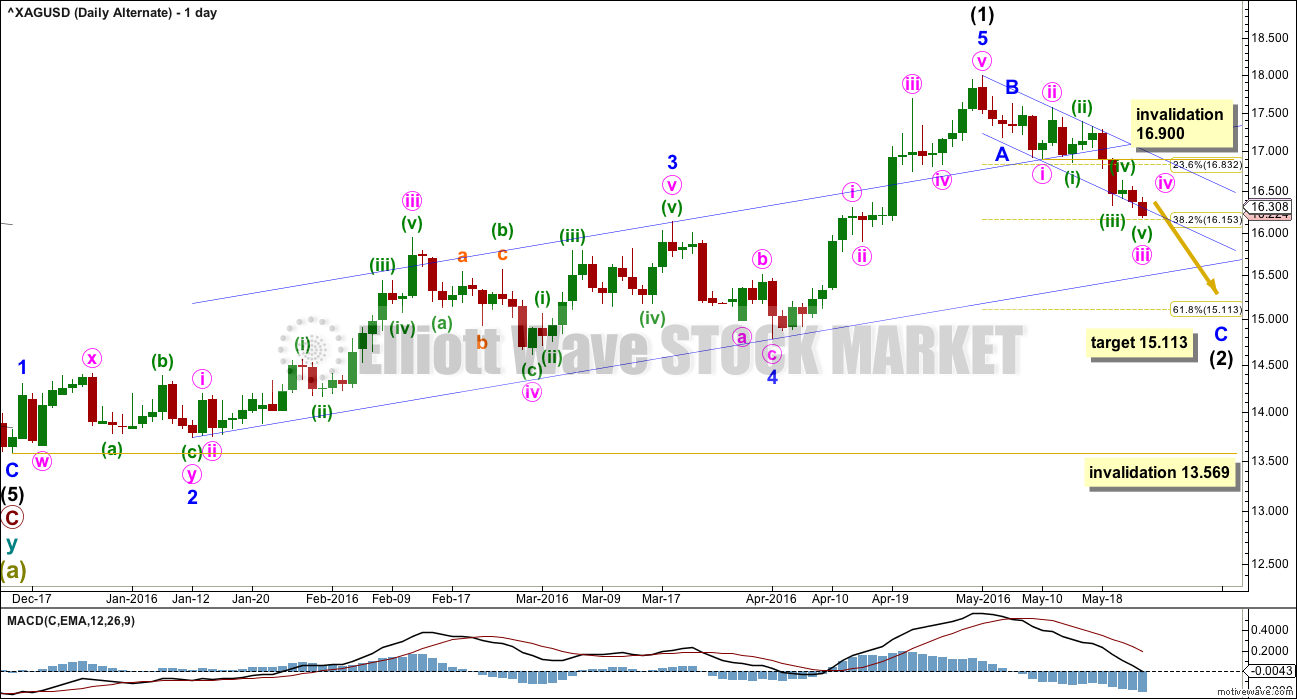
The structure for the downwards correction is the same for both wave counts. The target this week for this second wave count is different. If intermediate wave (2) corrects to the 0.618 Fibonacci ratio of intermediate wave (1), it would end about 15.113.
If this correction is intermediate wave (2), then the invalidation point is lower. Intermediate wave (2) may not move beyond the start of intermediate wave (1) below 13.569.
Price may not provide clarity between these two wave counts if the target is correct. Momentum and structure in coming weeks may indicate which wave count is correct.
TECHNICAL ANALYSIS
DAILY CHART
Click chart to enlarge. Chart courtesy of StockCharts.com.
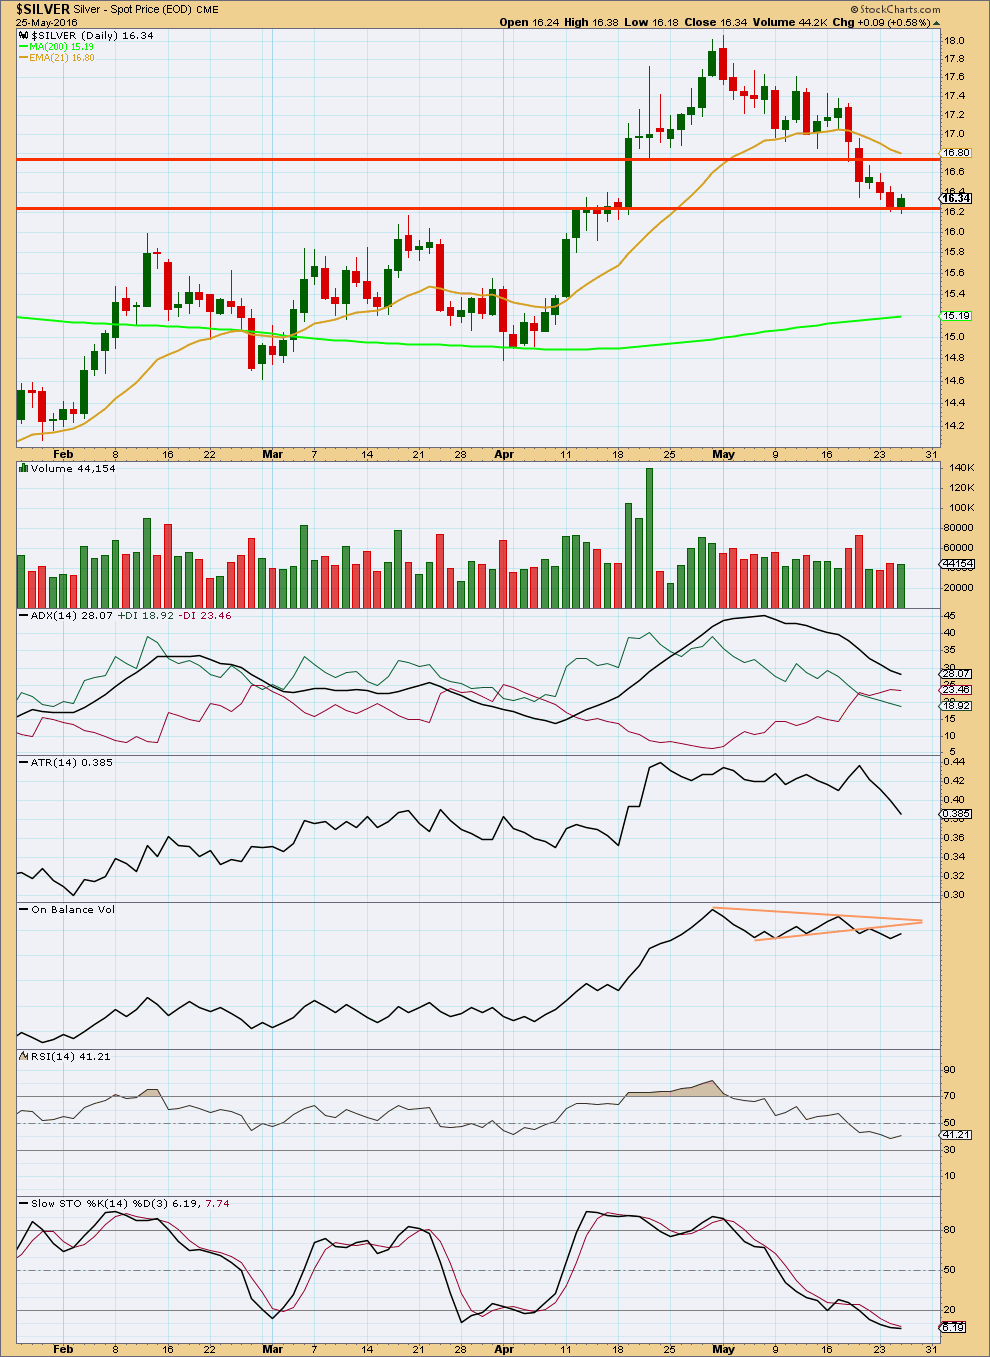
There is some support for falling price from volume, but not much. Overall, volume is light. This market continues to fall mostly of its own weight.
The two strong downwards days of 18th and 19th of May are supported by volume. This movement looks like a third wave; volume supports this part of the Elliott wave count.
Price may find some support here about 16.2. A bounce from here may find resistance about 16.7.
ADX is declining indicating there is no clear trend yet. The -DX line has crossed above the +DX line indicating a trend change.
ATR is also declining indicating the market is not trending. If this downwards movement is a counter trend movement, then the decline in ATR would be explained.
On Balance Volume should find resistance at the orange trend lines. While price is falling from 4th of May, OBV has not made a new low. There is divergence between price and OBV. This indicates weakness in price and is bearish.
There is no divergence between price and RSI. RSI is not yet extreme. There is further room for price to fall.
Stochastics is oversold. A bounce from here may be expected to resolve this.
This analysis is published @ 04:59 a.m. EST on 26th May, 2016.