
The downwards movement expected for Silver did not happen.
Summary: Silver looks overbought and due for a correction. It may find support about 16.70. The larger trend remains up.
New updates to this analysis are in bold.
WEEKLY WAVE COUNT
Click chart to enlarge.
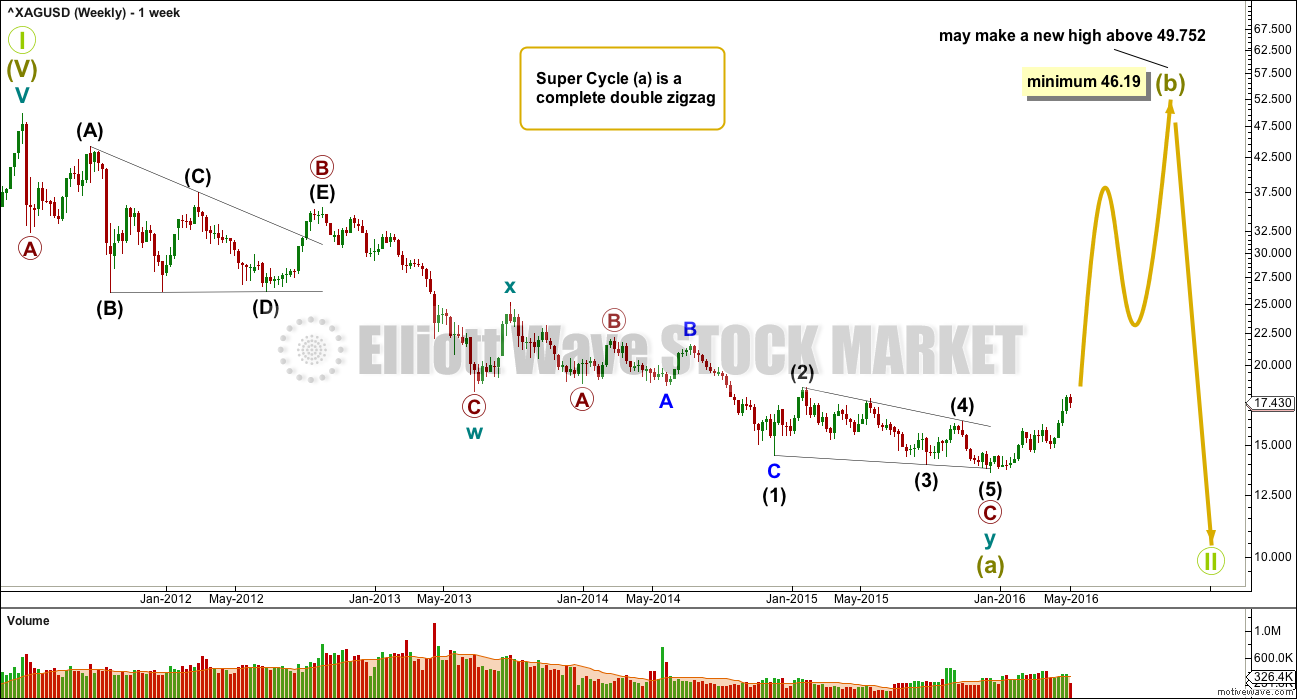
If super cycle wave (a) is a double zigzag, then within the second zigzag of the double labelled cycle wave y the structure may be complete.
Primary wave C is an ending contracting diagonal within the zigzag of cycle wave y. All subwaves subdivide as zigzags. The third wave is shorter than the first, the fifth wave is shorter than the third, and the fourth wave is shorter than the second. The trend lines converge.
There is a small overshoot of the (1)-(3) trend line at the end. This indicates the contracting diagonal structure is very likely to be complete.
If this wave count is correct, then super cycle wave (a) has subdivided as a three wave structure. That indicates Grand Super Cycle wave II may be a flat correction.
If this correction at Grand Super Cycle is a second wave (as opposed to a fourth wave), then a triangle may be eliminated.
A combination may also be eliminated because the first wave is a multiple. Combinations may only consist of a maximum of three corrective structures, so within each of W, Y and Z they may only subdivide into simple A-B-C structures (or A-B-C-D-E in the case of triangles). To label multiples within multiples increases the maximum beyond three, violating the rule.
Super Cycle wave (b) must retrace a minimum 90% of super cycle wave (a) at 46.19. Super cycle wave (b) may make a new price extreme beyond that seen for super cycle wave (a) above 49.752 as in an expanded flat.
Super cycle wave (b) may be any one of 23 possible corrective structures. It is impossible to predict at this early stage which one it will be, only to say it is unlikely to be a rare structure such as a running flat, expanding triangle or triple combination. That still leaves multiple structural possibilities. The most likely structure which would be able to meet the minimum price requirement at 23.945 is a zigzag.
The first movement up for a wave of this large degree must subdivide as a clear five at the daily chart level, and probably at the weekly chart level also.
FIRST DAILY WAVE COUNT
Click chart to enlarge.
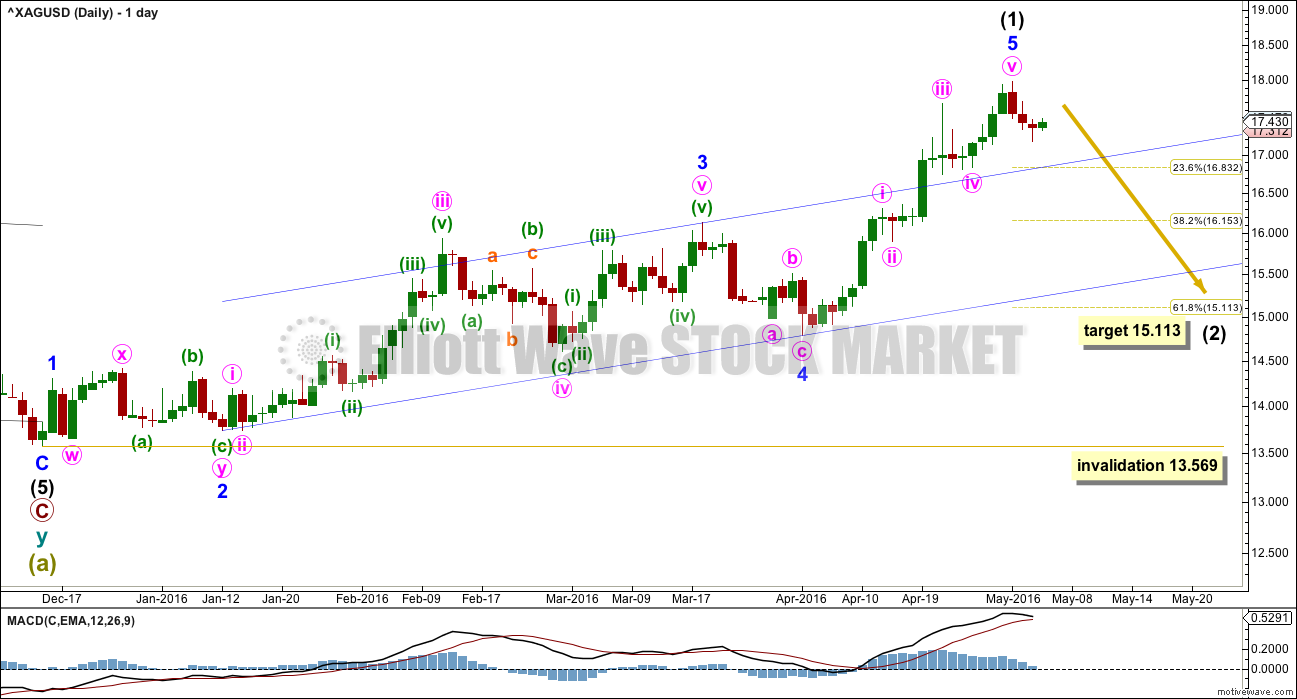
The two daily charts are labelled first and second this week rather than main and alternate because I expect they have about an even probability.
Intermediate wave (1) may have just ended. This first wave count would require an intermediate degree correction for wave (2) to unfold over a few weeks. It may end most likely about the 0.618 Fibonacci ratio at 15.113.
This first wave count fits with the alternate for Gold, if both markets correct together.
This first wave count has more support from classic technical analysis.
SECOND DAILY WAVE COUNT
Click chart to enlarge.
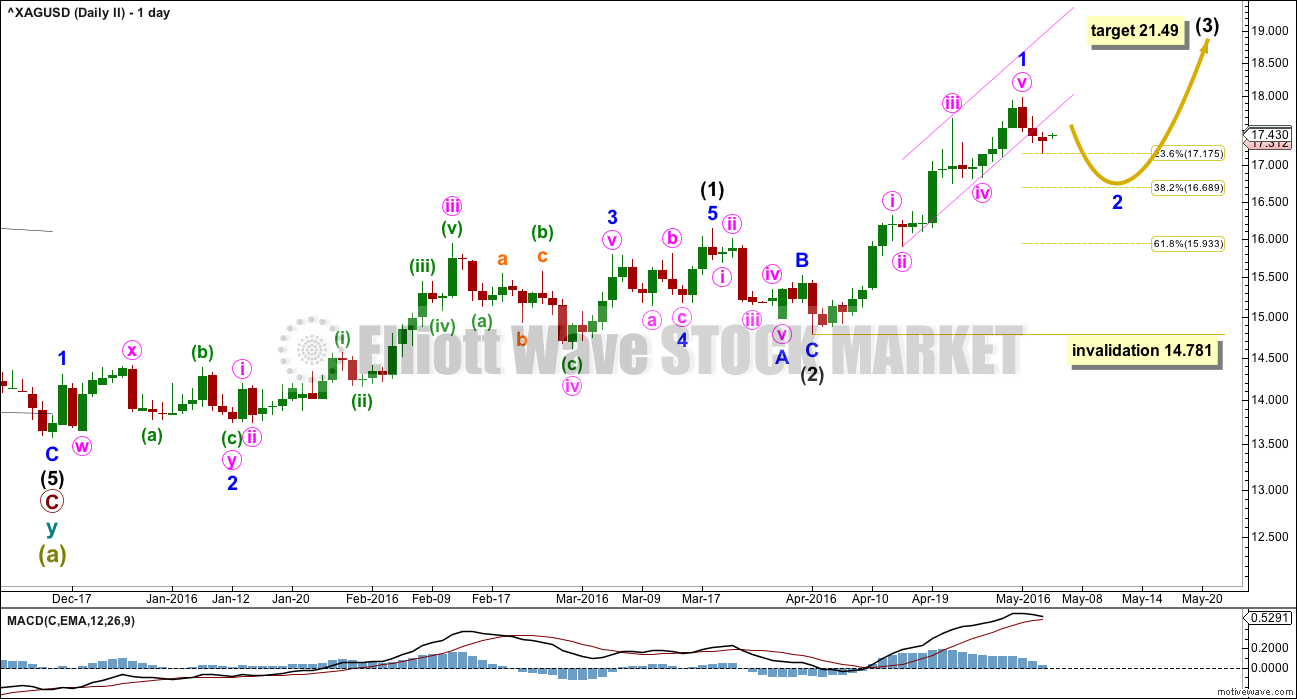
This second wave count expects Silver to begin the middle of a third wave up shortly. First, minor wave 2 may move lower to end at either the 0.382 or 0.618 Fibonacci ratios.
At 21.49 intermediate wave (3) would reach 2.618 the length of intermediate wave (1).
Minor wave 2 may not move beyond the start of minor wave 1 below 14.781.
TECHNICAL ANALYSIS
DAILY CHART
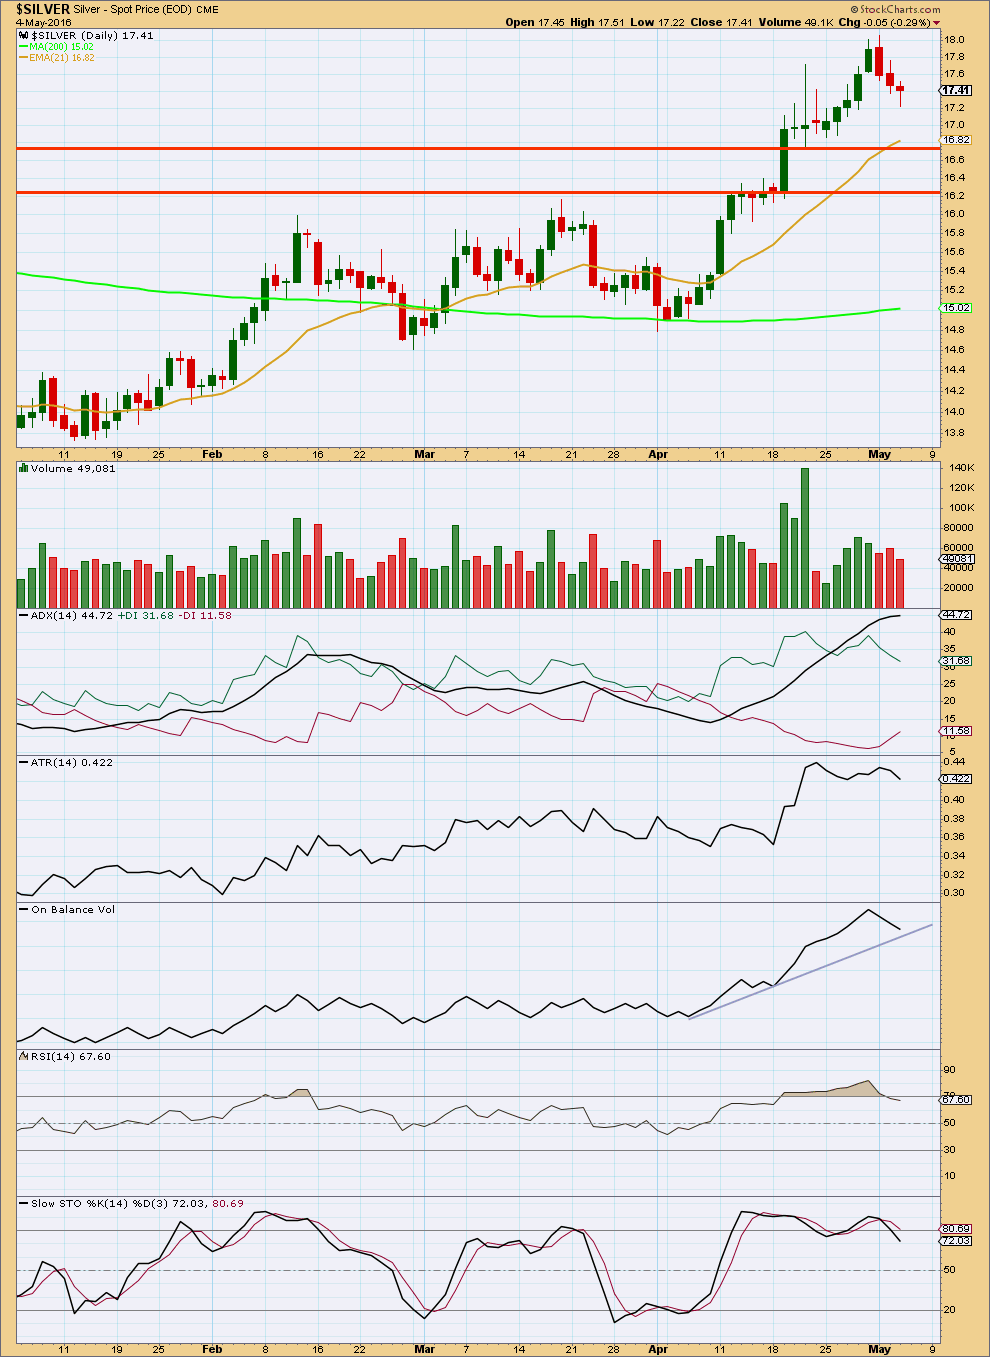
Click chart to enlarge. Chart courtesy of StockCharts.com.
Silver now looks overbought. At the last high, the rise in price was not supported by volume for the final two days. However, now price is falling on light and declining volume overall. The fall in price isn’t supported by volume either, but a market may fall of its own weight.
There is a bearish engulfing candlestick pattern at the high. This is the strongest bearish reversal signal. It has occurred close to the round number of 18 which is significant. But volume on the first candle is higher than the second, which slightly weakens the signal.
Horizontal support lines are redrawn after looking left back over a year. The next support may be about the round number of 16.70. Thereafter, about 16.30.
ADX is extreme just below 45. A correction from the extreme should be expected.
ATR has flattened off and may be beginning to decline.
On Balance Volume may find some small support at the trend line. A break below that line would be a weak bearish signal.
RSI is returning from overbought.
Stochastics showed some divergence at the last high with price. It is returning from overbought.
This analysis is published @ 04:31 a.m. EST on 5th May, 2016.