
Upwards movement was expected but price has moved sideways in a small range. The target remains the same.
Summary: Expect more upwards movement while price remains within the blue channel on the daily chart. The target remains at 55.83. When the channel is breached, then expect several weeks of downwards movement. At this stage, there is some weakness to the upwards trend and On Balance Volume indicates price may break below support shortly. The target may not be met.
New updates to this analysis are in bold
MONTHLY ELLIOTT WAVE COUNT
Click chart to enlarge.
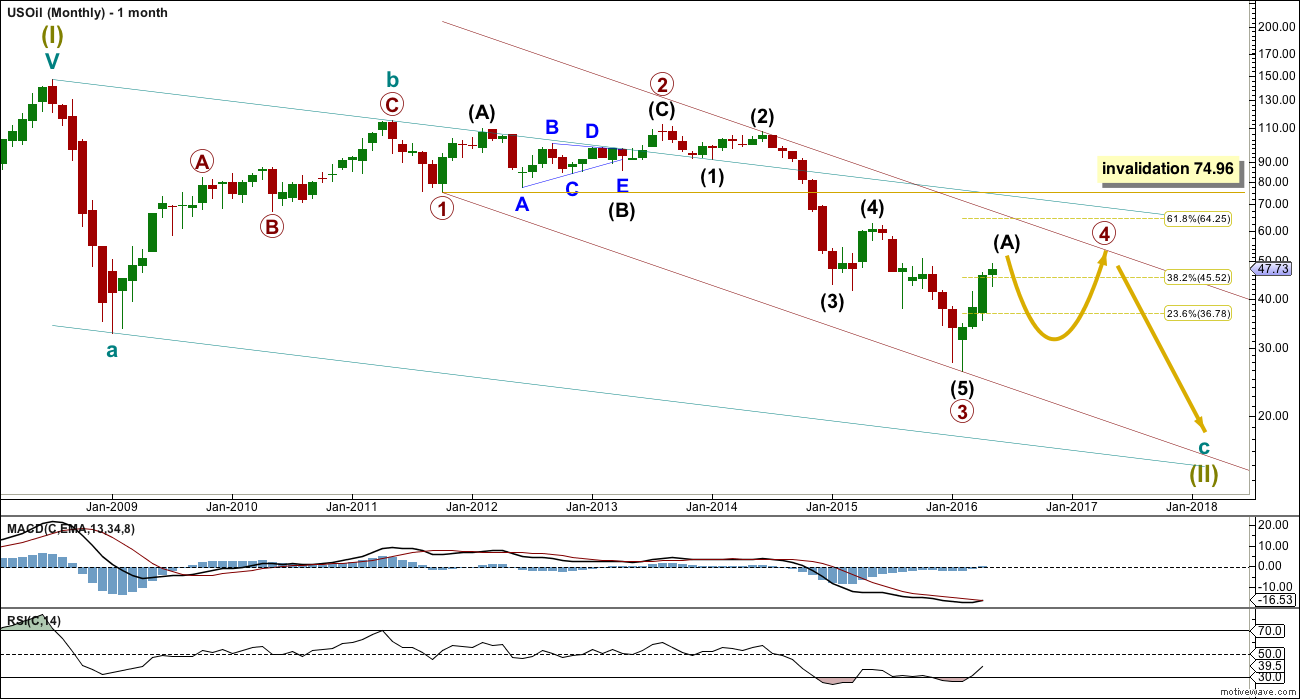
Within the bear market, cycle wave b is seen as ending in May 2011. Thereafter, a five wave structure downwards for cycle wave c begins.
Primary wave 1 is a short impulse lasting five months. Primary wave 2 is a very deep 0.94 zigzag lasting 22 months. Primary wave 3 is a complete impulse with no Fibonacci ratio to primary wave 1. It lasted 30 months.
Primary wave 4 is likely to exhibit alternation with primary wave 2. Primary wave 4 is most likely to be a flat, combination or triangle. Within all of these types of structures, the first movement subdivides as a three.
Primary wave 4 is likely to end within the price territory of the fourth wave of one lesser degree; intermediate wave (4) has its range from 42.03 to 62.58.
Primary wave 4 may end if price comes up to touch the upper edge of the maroon channel. The upper edge of this channel has been pushed up this week to sit on the end of intermediate wave (2) within primary wave 3.
Primary wave 4 is most likely to be shallow to exhibit alternation in depth with primary wave 2. The 0.382 Fibonacci ratio at 45.52 is within the price range of intermediate wave (4), so this is the most likely target.
Primary wave 4 may not move into primary wave 1 price territory above 74.96.
DAILY ELLIOTT WAVE COUNT
Click chart to enlarge.
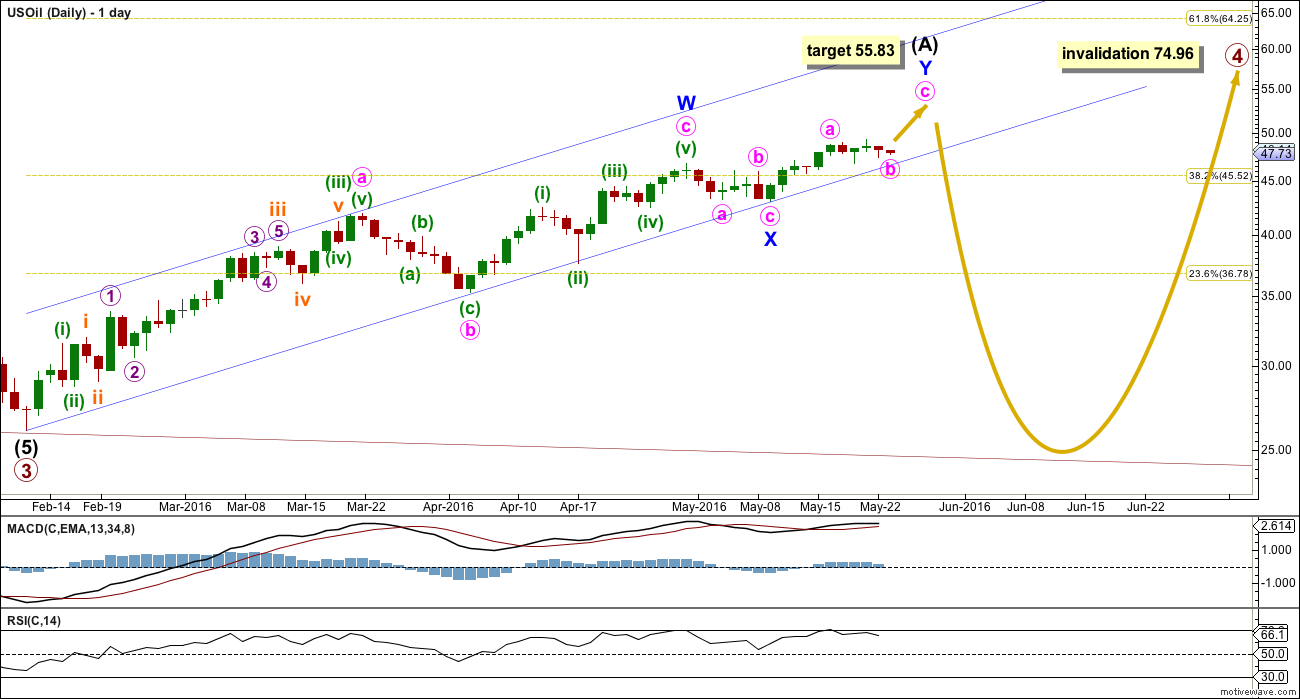
Intermediate wave (A) looks like it may be unfolding as a double zigzag. Price remains within the channel.
Expect upwards movement to continue while price remains within the channel. At 55.83 minor wave Y would reach 0.618 the length of minor wave W.
If when it is complete intermediate wave (A) is a double zigzag as labelled, then that narrows the range of possible structures for primary wave 4 to a flat or triangle. If the first movement is a multiple, then primary wave 4 cannot be a longer multiple. The maximum number of corrective structures within a multiple is three, so to label multiples within multiples increases the maximum beyond three violating the rule.
If primary wave 4 is a flat correction, then when intermediate wave (A) is complete then intermediate wave (B) must retrace a minimum 0.9 length of intermediate wave (A). An expanded flat would see intermediate wave (B) make a new low below the start of intermediate wave (A) at 26.06. There is no lower invalidation point for a flat correction.
If primary wave 4 is a triangle, then when intermediate wave (A) is complete then intermediate wave (B) downwards has no minimum nor maximum limit. It must be a three and it may make a new low below the start of intermediate wave (A) at 26.06 as in a running triangle.
When price breaks below the blue channel with a full daily candlestick below and not touching the lower edge, that shall provide trend channel confirmation that upwards movement is over and the next wave down has begun. The next wave down is likely to be very deep.
When the channel is breached, then look out for a throwback back up to the lower trend line. Price may find resistance there. If this is how price behaves, it would present a low risk entry opportunity for a short position.
Primary wave 4 may not move into primary wave 1 price territory above 74.96.
ALTERNATE DAILY ELLIOTT WAVE COUNT
Click chart to enlarge.
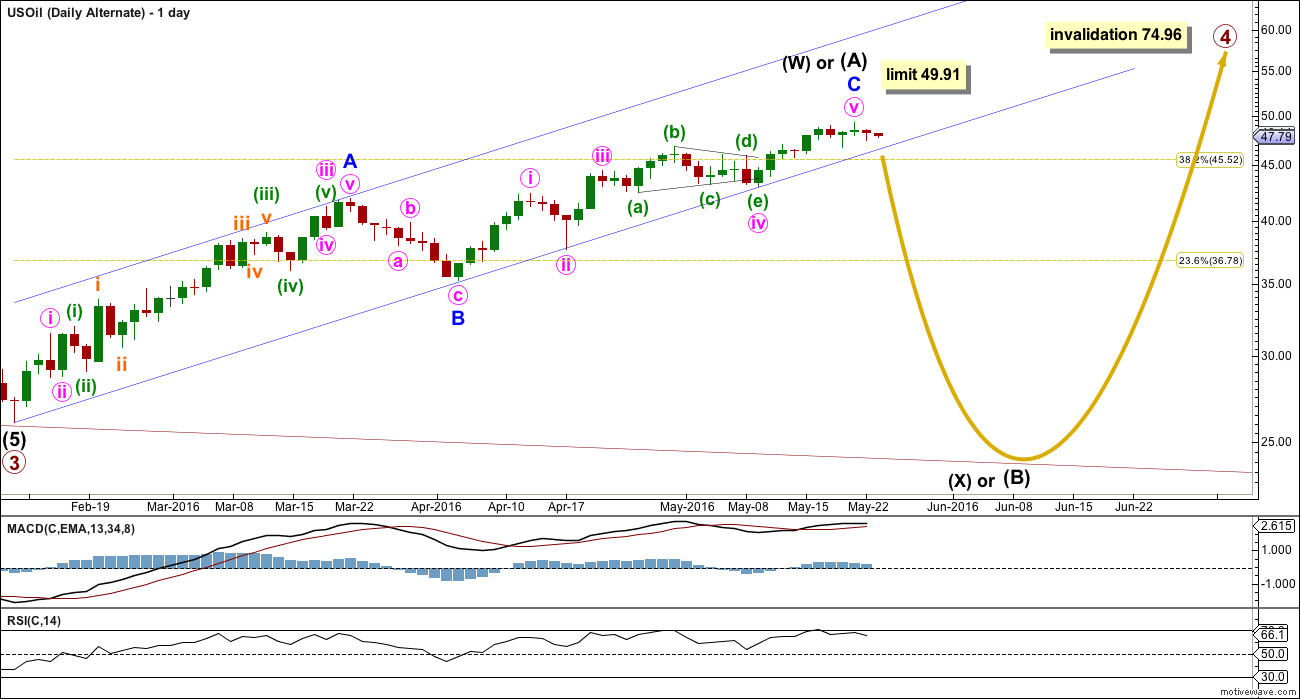
Alternatively, it is possible that intermediate wave (A) could be a complete zigzag.
Within minor wave C, minute wave iii is shorter than minute wave i. This limits minute wave v to no longer than equality with minute wave iii at 49.91, so that minute wave iii is not the shortest actionably wave within the impulse.
If intermediate wave (W) or (A) is a single zigzag, then primary wave 4 may be either a flat, triangle or combination. All structural options (apart from zigzags) would be possible.
Intermediate wave (X) or (B) may make a new low below 26.06. There is no minimum nor maximum requirement for intermediate wave (X) or (B). It must only be a corrective structure. It may be any corrective structure.
The trend should be expected to remain the same until proven otherwise. Only when the blue trend channel about intermediate wave (W) or (A) is breached by downwards movement should a trend change be expected to have occurred.
TECHNICAL ANALYSIS
MONTHLY CHART
Click chart to enlarge. Chart courtesy of StockCharts.com.
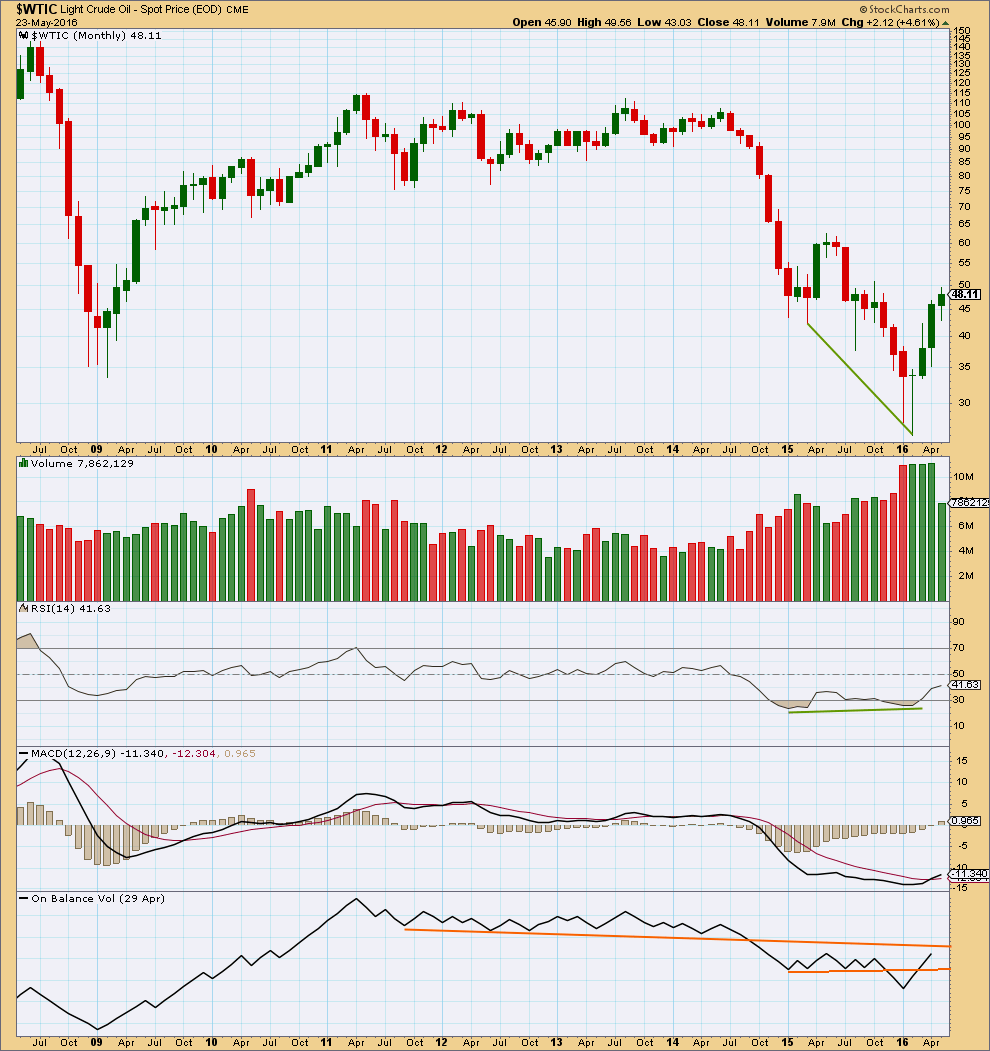
Price shows divergence with RSI as price moved lower.
The fall in price was supported by volume. The rise in price from the low in February is supported by volume. This favours a bullish outlook.
The three monthly candlesticks for January, February and March create a Morning Doji Star reversal pattern. However, this is a warning of a trend change and not definitive. There is an example of a stronger candlestick reversal pattern on this monthly chart for March and April 2015. April 2015 completed a bullish engulfing candlestick pattern; this is the strongest reversal pattern and this example was particularly strong. Yet it only translated to one more month of slight new highs in May before the downwards trend resumed.
On Balance Volume has broken above the lower orange line. It may find resistance at the upper orange line which may serve to hold the rise in price.
DAILY CHART
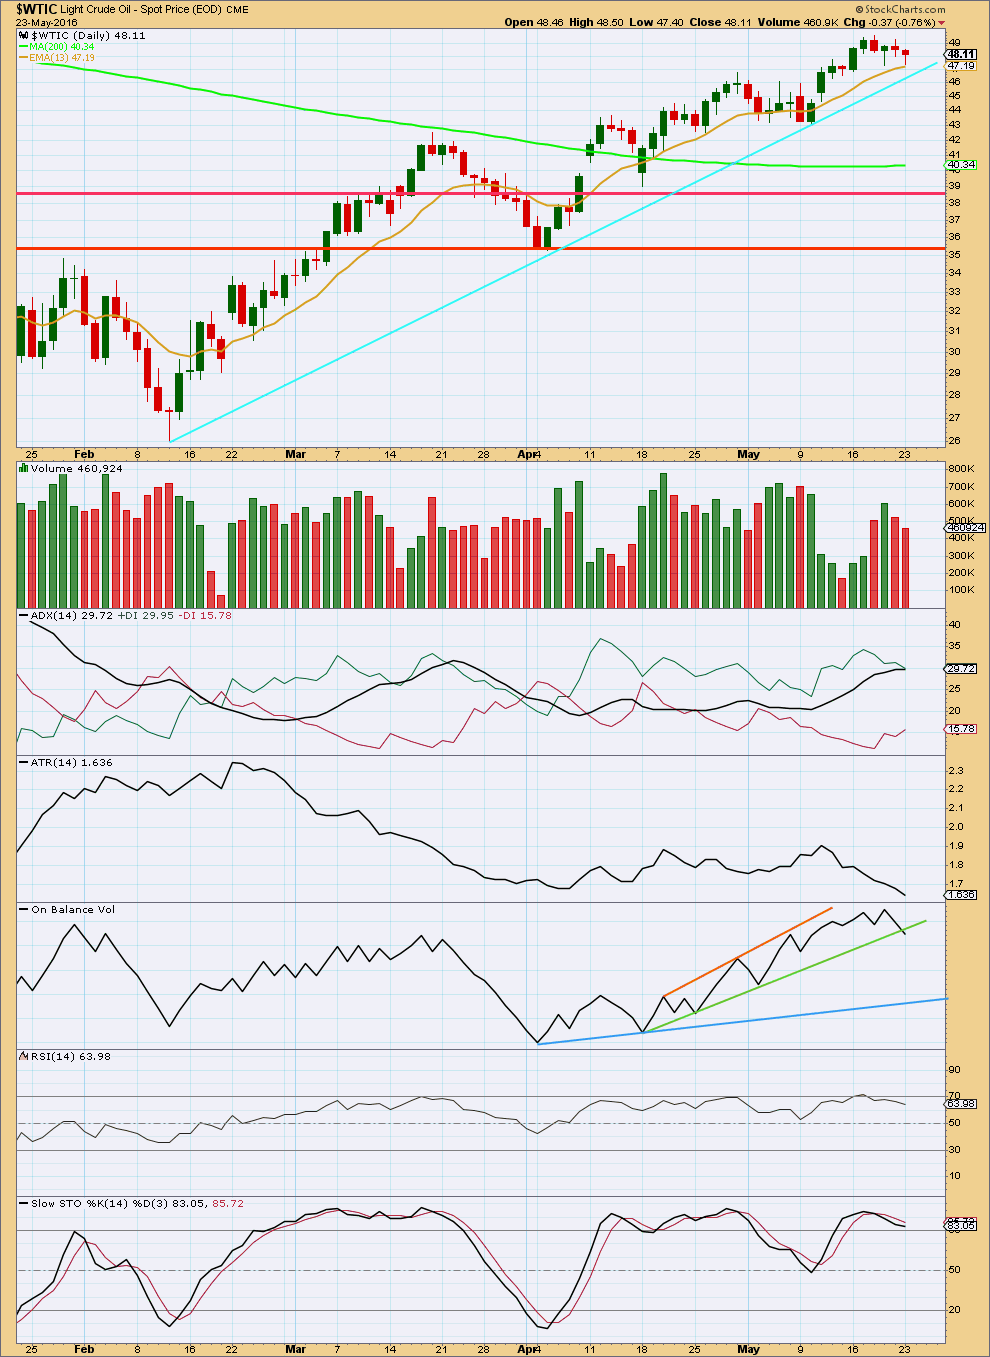
Click chart to enlarge. Chart courtesy of StockCharts.com.
Over the last five days price has moved sideways, with the upwards day having stronger volume and the last two downwards days not supported by volume. In the short term, this volume profile may be interpreted as bullish.
However, up to the last high volume was particularly light. This is bearish.
On Balance Volume may be providing an early warning of a price breakout below support. OBV has broken below support of the green line. This may be followed by price breaking below support of its cyan bull market trend line.
If price breaks below the cyan line, then a trend change would be indicated.
At the high there was divergence between price and Stochastics.
ATR is still increasing indicating there is an upwards trend in place.
ATR strongly disagreeing this week indicating weakness in this upwards trend.
A break below the green or blue lines by On Balance Volume would be a bearish indication.
There is no divergence between price and RSI.
This analysis is published @ 03:47 a.m. EST on 24th May, 2016.