
Price continues higher and remains within the channel as the main Elliott wave count expected.
The target remains the same.
Summary: Expect more upwards movement while price remains within the blue channel on the daily chart. The target remains at 55.83. When the channel is breached, then expect several weeks of downwards movement. There is weakness this week from volume and ATR, and divergence with RSI. This trend is very weak and may end within the next week.
New updates to this analysis are in bold
MONTHLY ELLIOTT WAVE COUNT
Click chart to enlarge.
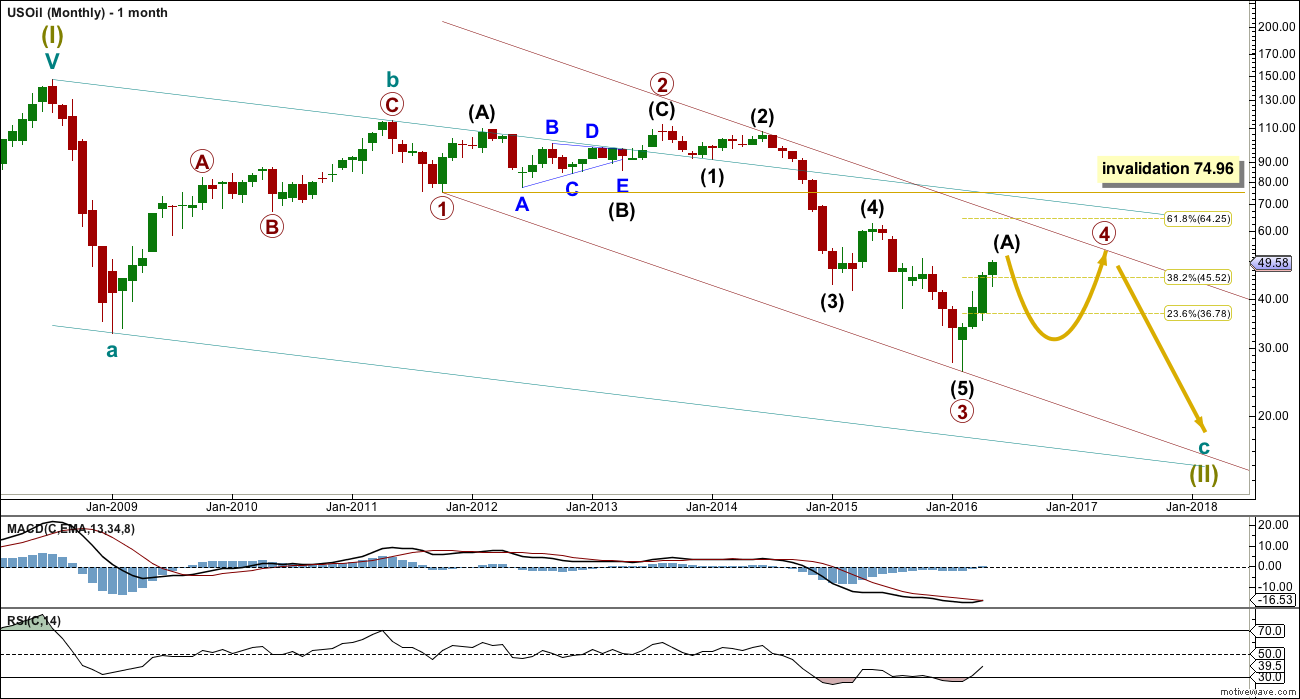
Within the bear market, cycle wave b is seen as ending in May 2011. Thereafter, a five wave structure downwards for cycle wave c begins.
Primary wave 1 is a short impulse lasting five months. Primary wave 2 is a very deep 0.94 zigzag lasting 22 months. Primary wave 3 is a complete impulse with no Fibonacci ratio to primary wave 1. It lasted 30 months.
Primary wave 4 is likely to exhibit alternation with primary wave 2. Primary wave 4 is most likely to be a flat, combination or triangle. Within all of these types of structures, the first movement subdivides as a three.
Primary wave 4 is likely to end within the price territory of the fourth wave of one lesser degree; intermediate wave (4) has its range from 42.03 to 62.58.
Primary wave 4 may end if price comes up to touch the upper edge of the maroon channel. The upper edge of this channel has been pushed up to sit on the end of intermediate wave (2) within primary wave 3.
Primary wave 4 is most likely to be shallow to exhibit alternation in depth with primary wave 2. So far it has passed the 0.382 Fibonacci ratio at 45.52. It may now move mostly sideways in a large range.
Primary wave 4 may not move into primary wave 1 price territory above 74.96.
DAILY ELLIOTT WAVE COUNT
Click chart to enlarge.
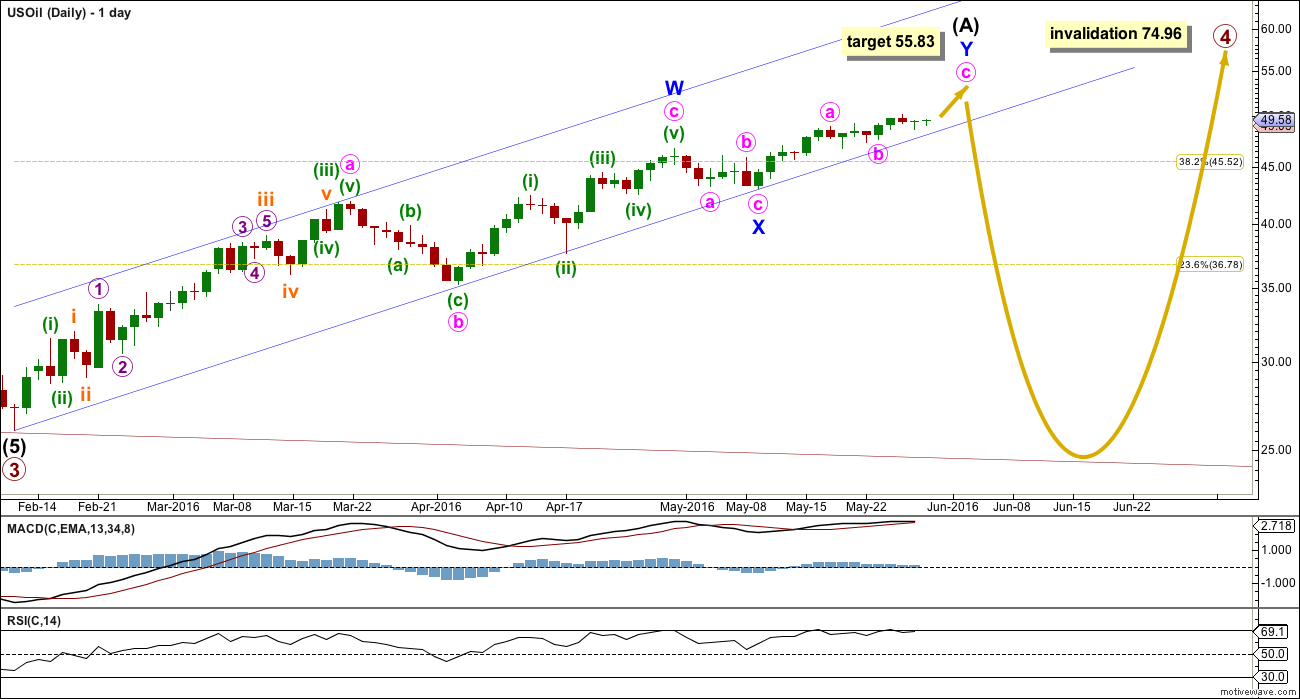
Intermediate wave (A) looks like it may be unfolding as a double zigzag. Price remains within the channel.
Expect upwards movement to continue while price remains within the channel. At 55.83 minor wave Y would reach 0.618 the length of minor wave W.
Within this possible double zigzag, minor wave Y could be complete. Minute wave a subdivides as a five on the hourly chart, followed by a running contracting triangle for minute wave b. The target calculation remains the same.
If when it is complete intermediate wave (A) is a double zigzag as labelled, then that narrows the range of possible structures for primary wave 4 to a flat or triangle. If the first movement is a multiple, then primary wave 4 cannot be a longer multiple. The maximum number of corrective structures within a multiple is three, so to label multiples within multiples increases the maximum beyond three violating the rule.
If primary wave 4 is a flat correction, then when intermediate wave (A) is complete then intermediate wave (B) must retrace a minimum 0.9 length of intermediate wave (A). An expanded flat would see intermediate wave (B) make a new low below the start of intermediate wave (A) at 26.06. There is no lower invalidation point for a flat correction.
If primary wave 4 is a triangle, then when intermediate wave (A) is complete then intermediate wave (B) downwards has no minimum nor maximum limit. It must be a three and it may make a new low below the start of intermediate wave (A) at 26.06 as in a running triangle.
When price breaks below the blue channel with a full daily candlestick below and not touching the lower edge, that shall provide trend channel confirmation that upwards movement is over and the next wave down has begun. The next wave down is likely to be very deep.
When the channel is breached, then look out for a throwback back up to the lower trend line. Price may find resistance there. If this is how price behaves, it would present a low risk entry opportunity for a short position.
Primary wave 4 may not move into primary wave 1 price territory above 74.96.
ALTERNATE DAILY ELLIOTT WAVE COUNT
Click chart to enlarge.
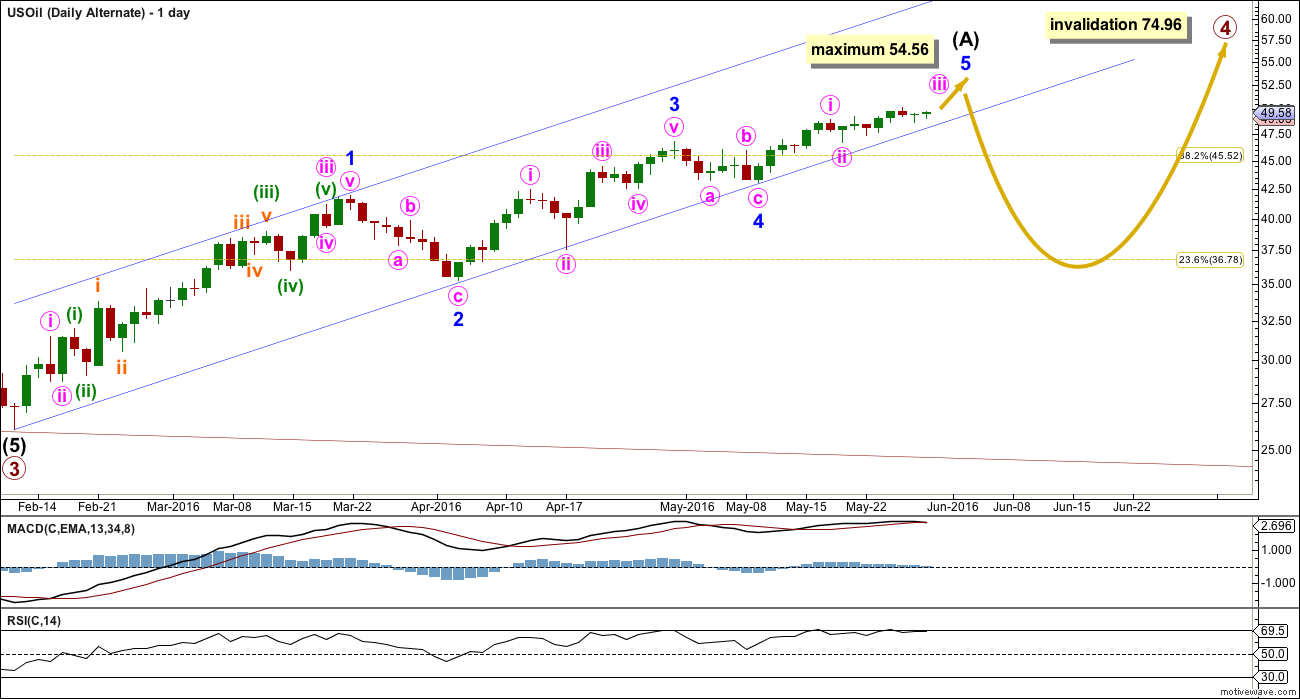
It is possible that primary wave 4 could be a zigzag, but the probability is low because this would see no structural alternation between primary waves 4 and 2. Low probability does not mean no probability, so this alternate must be accepted as possible.
If primary wave 4 unfolds as a zigzag, then intermediate wave (A) within it must unfold as a five wave structure; it may be an incomplete impulse.
Within the impulse, minor wave 3 is shorter than minor wave 1 and there is no Fibonacci ratio between the two. This limits the length of minor wave 5 so that the rule stating a third wave may not be the shortest is met. Minor wave 5 would reach equality in length with minor wave 3 at 54.56. It may not move beyond this point for this wave count to remain valid.
Use the channel in the same way. When it is breached expect upwards movement is over and the next wave down has begun.
If intermediate wave (A) unfolds as a five, then the following downwards correction for intermediate wave (B) may not move beyond its start below 26.06.
TECHNICAL ANALYSIS
MONTHLY CHART
Click chart to enlarge. Chart courtesy of StockCharts.com.
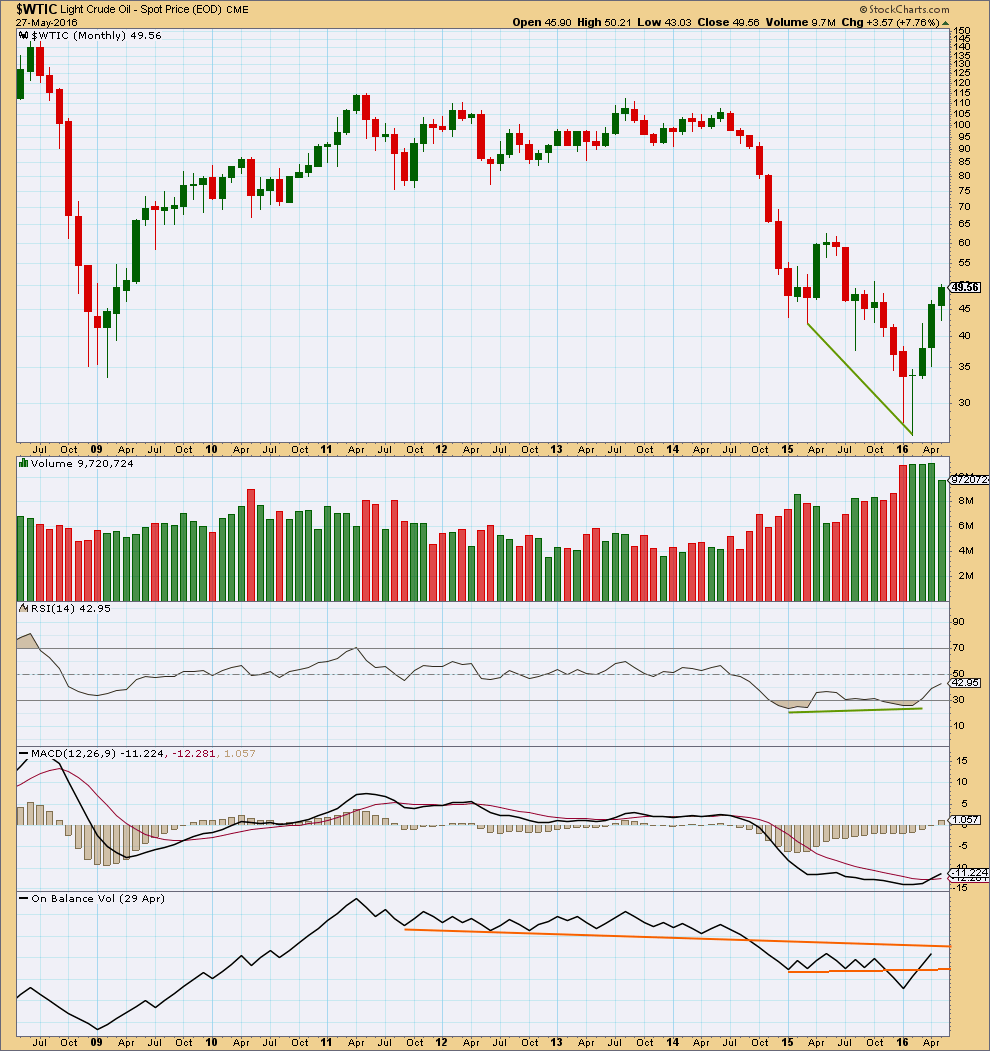
The rise in price from the low in February is supported by volume. This favours a bullish outlook.
The three monthly candlesticks for January, February and March create a Morning Doji Star reversal pattern. However, this is a warning of a trend change and not definitive. There is an example of a stronger candlestick reversal pattern on this monthly chart for March and April 2015. April 2015 completed a bullish engulfing candlestick pattern; this is the strongest reversal pattern and this example was particularly strong. Yet it only translated to one more month of slight new highs in May before the downwards trend resumed.
On Balance Volume has broken above the lower orange line. It may find resistance at the upper orange line which may serve to hold the rise in price.
DAILY CHART
Click chart to enlarge. Chart courtesy of StockCharts.com.
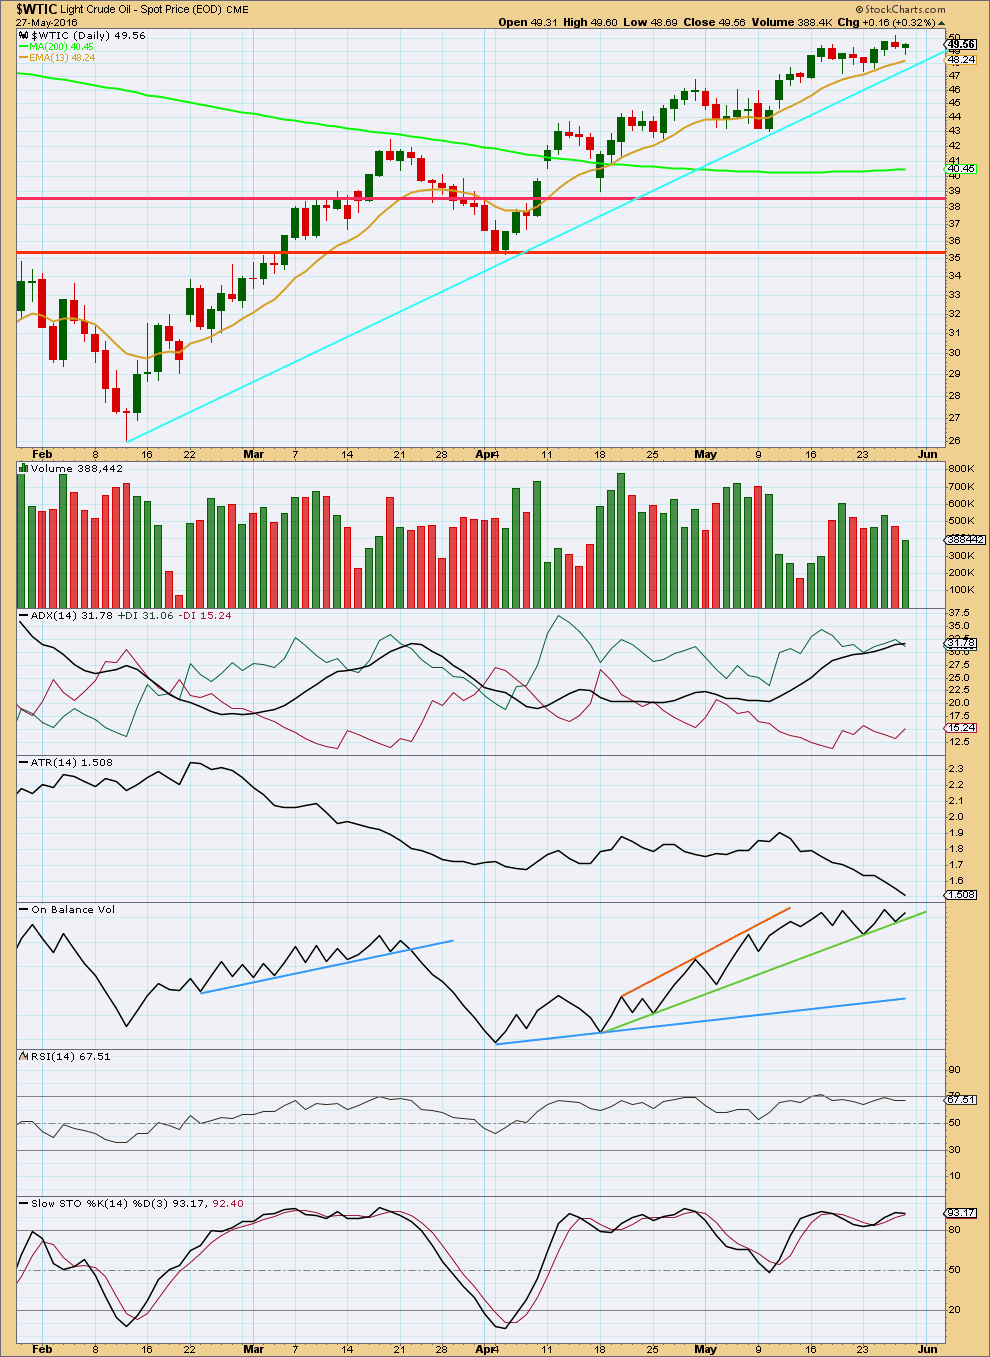
Price continues higher on declining volume. This is a warning that the upwards trend is weakening, but it cannot tell when it will end.
Price is finding some support about the 13 day moving average as it moves upwards. The cyan support line has not been breached. When it is, that shall provide a clear signal that upwards movement is over and the next wave down has begun.
ADX still indicates an upwards trend is intact. With ADX between 25 and 45, the trend is still strong and not yet overextended.
However, ATR is declining and has been since 11th of May. This indicates further weakness to this upwards trend. A declining ATR is more normal for a consolidation than a trend. Again, this indicates weakness but does not indicate when and where the trend will end.
On Balance Volume may give an early warning signal for a trend change. The green line this week is redrawn. This line is providing support for OBV. If this green line is breached by OBV moving lower before price breaks below the cyan line, then expect a break from price to quickly follow OBV.
There is slight divergence this week between RSI and price: price has made a higher high above the prior swing high of 17th of May yet RSI has not made a higher high. This is regular bearish divergence. Again, this indicates weakness but does not indicate exactly when and where price will turn. Normally, in my experience, divergence with price and RSI is a fairly reliable signal of a trend change coming up very soon.
This analysis is published @ 06:19 p.m. EST.