Strong upwards movement was unexpected, but it has taken price up to one of the two possible targets for a multi day correction to end.
Summary: The main wave count still expects intermediate (2) is not over. A new low short term below 1,220.16 would add confidence to this view, and a new low below 1,200.07 would confirm it. The target is now widened to a zone at 1,189 – 1,183. Alternatively, a new high above 1,269.07 would confirm the second wave is over and a third wave up is in the early stages, with a target at 1,582.
New updates to this analysis are in bold.
To see last weekly charts click here.
DAILY ELLIOTT WAVE COUNT
Intermediate wave (2) is not over.
Normally, the first large second wave correction within a new trend is very deep, often deeper than the 0.618 Fibonacci ratio.
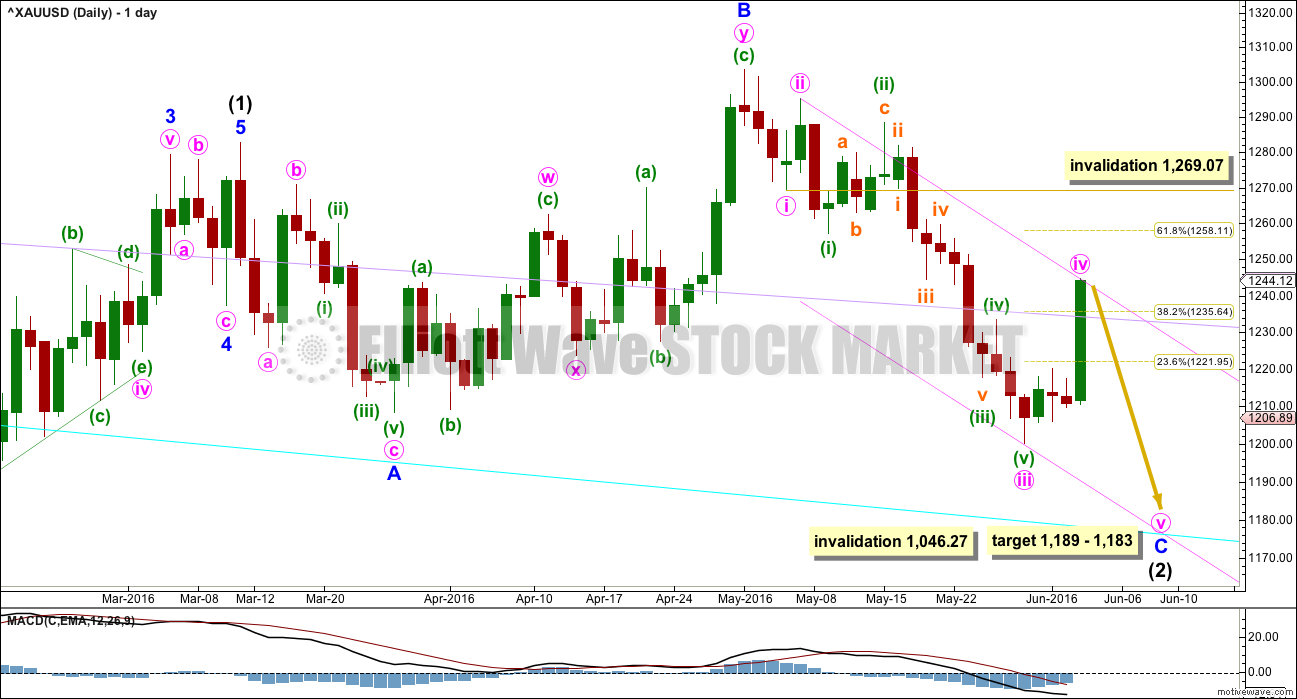
Intermediate wave (2) may be an expanded flat correction. Minor wave A is a three, minor wave B is a three and a 1.28 length of minor wave A. This is within the normal range of 1 to 1.38.
At 1,183 minor wave C would reach 1.618 the length of minor wave A. This would be the most likely target. If price keeps falling through this first target, then the second target would be at 1,108 where minor wave C would reach 2.618 the length of minor wave A.
Within minor wave C, minute wave iv may now be complete. At 1,189 minute wave v would reach 1.618 the length of minute wave i. This gives a target zone of 1,189 to 1,183.
Intermediate wave (2) may not move beyond the start of intermediate wave (1) below 1,046.27.
Minute wave iv may not move into minute wave i price territory above 1,269.07.
Redraw the channel about minor wave C using Elliott’s second technique: the first trend line from the ends of minute waves ii to iv, then a parallel copy on the end of minute wave iii. Minute wave v may end at support at the lower edge of this channel.
For this main wave count, minute wave iii is 5.05 short of 2.618 the length of minute wave i.
There are no adequate Fibonacci ratios between minuette waves (i), (iii), and (v) within minute wave iii.
Ratios within minuette wave (iii) are: there is no Fibonacci ratio between subminuette waves i and iii, and subminuette wave v is 2.64 short of 2.618 the length of subminuette wave i. Subminuette wave ii is an expanded flat and subminuette wave iv is a zigzag.
HOURLY ELLIOTT WAVE COUNT
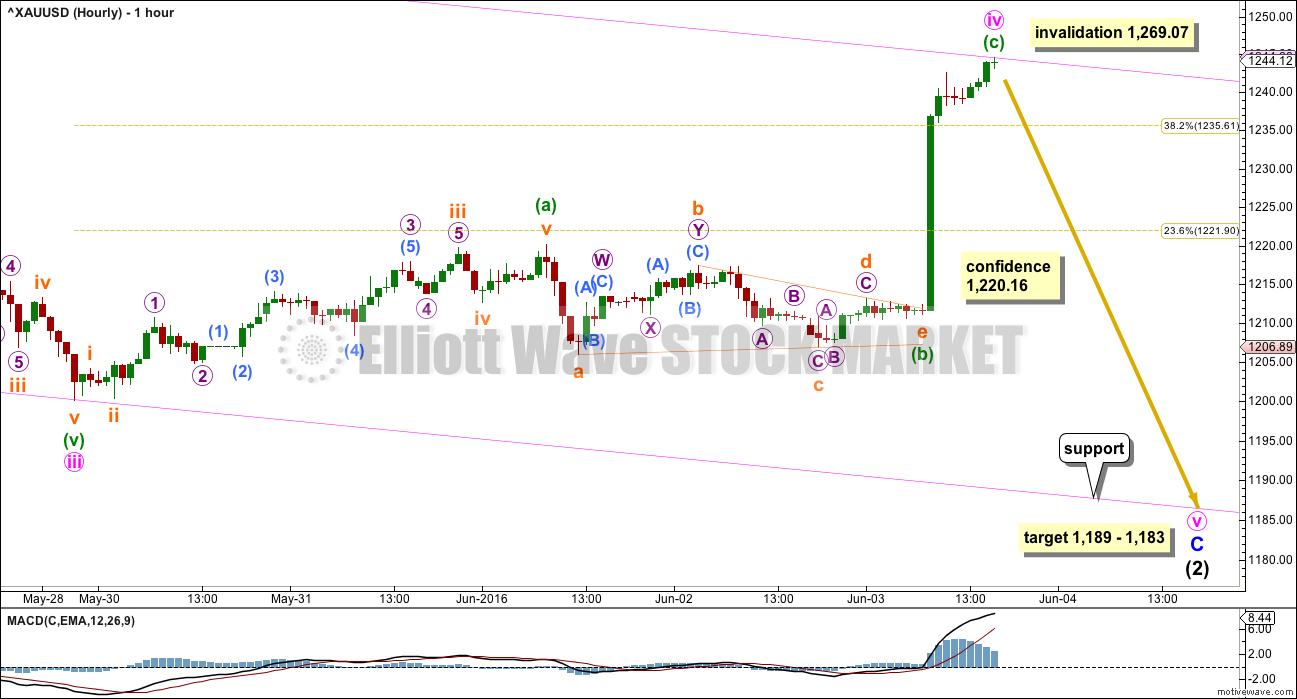
Minute wave ii was a quick deep 0.76 zigzag lasting 23 hours. If minute wave iv is over now as labelled, then it exhibits no alternation in structure with minute wave ii: both are zigzags. Minute wave iv does exhibit alternation in depth; it is relatively shallow at 0.47 the length of minute wave iii.
The lack of alternation in structure reduces the probability of this wave count today.
Sideways movement labelled minuette wave (b) fits perfectly as a triangle. There is no Fibonacci ratio between minuette waves (a) and (c).
A new low below 1,220.16 would invalidate the alternate below at the hourly chart level and provide some confidence in this main wave count. A new low below 1,200.07 would provide final price confirmation of this wave count.
ALTERNATE DAILY ELLIOTT WAVE COUNT
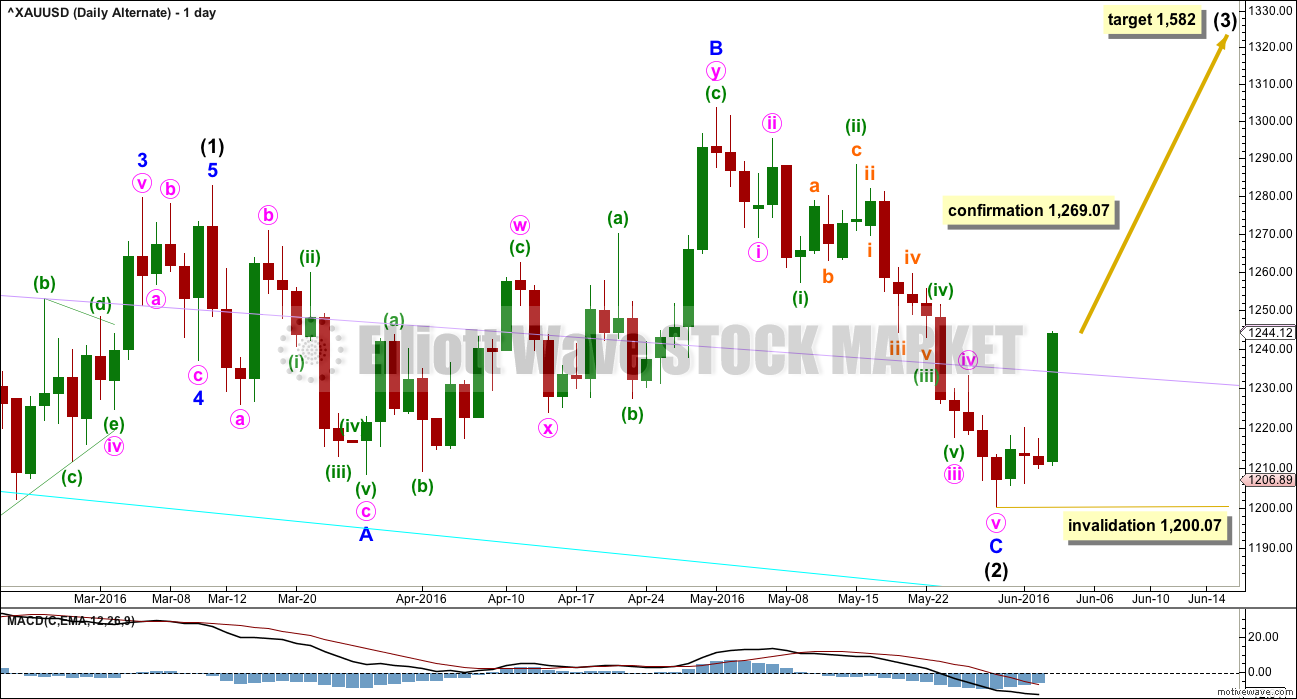
It is possible that intermediate wave (2) is over as a completed expanded flat. It would be a shallow 0.350 correction of intermediate wave (1) lasting 56 days, just one more than a Fibonacci 55. There would be no Fibonacci ratio between minor waves A and C.
For this alternate wave count, ratios within minor wave C are: there is no Fibonacci ratio between minute waves i and iii, and minute wave v is just 1.13 short of equality in length with minute wave i.
Within minute wave iii, there are no adequate Fibonacci ratios between minuette waves (i), (iii) and (v).
Ratios within minuette wave (iii) are: there is no Fibonacci ratio between subminuette waves i and iii, and subminuette wave v is 0.70 short of 0.618 the length of subminuett wave i. Subminuette wave ii is an expanded flat and subminuette wave iv is a regular contracting triangle.
On balance, there is no advantage for either wave count, this alternate or the main, in terms of Fibonacci ratios or alternation which would indicate one is more likely than the other.
What is problematic for this alternate is the structure of minuette wave (v): the fit on the hourly chart is not as neat for this alternate as it is for the main wave count. For this reason, in terms of Elliott wave, this alternate must be judged to have a lower probability. It requires confirmation with a new high above 1,269.07 before it may be used.
At 1,582 intermediate wave (3) would reach 1.618 the length of intermediate wave (1). No second wave correction may move beyond the start of its first wave below 1,200.07 within intermediate wave (3).
ALTERNATE HOURLY ELLIOTT WAVE COUNT
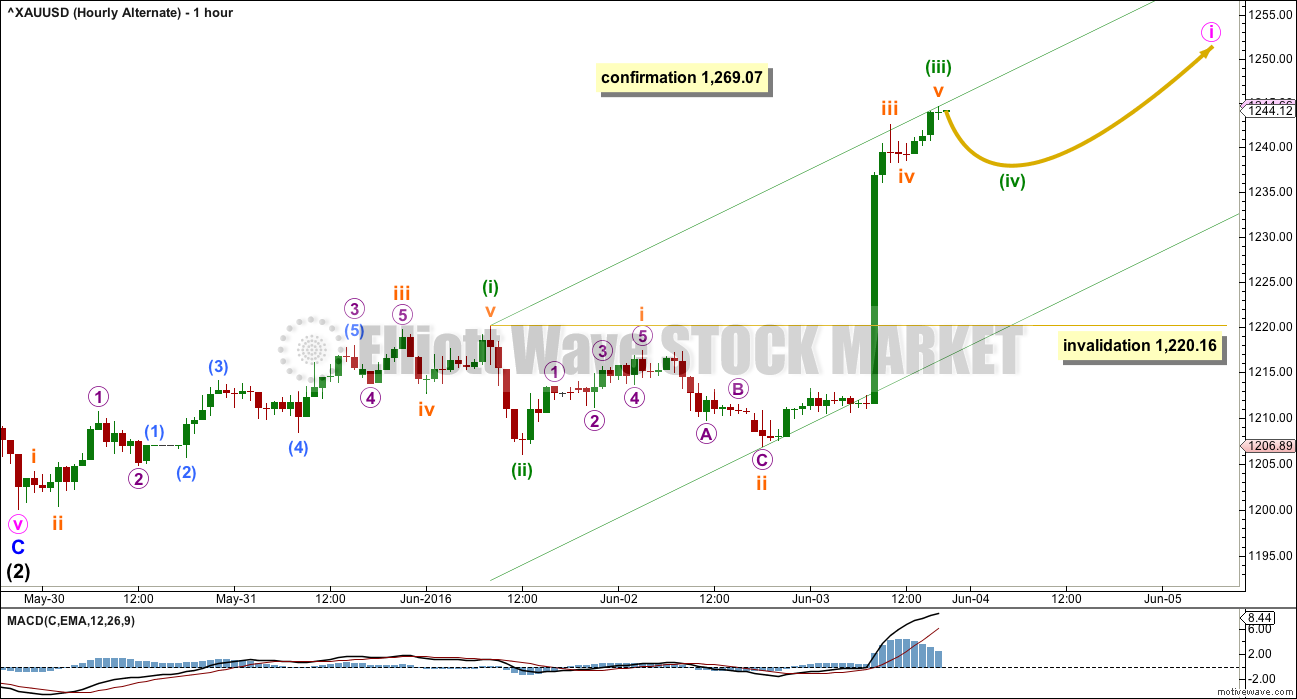
The subdivisions are slightly different at the hourly chart level. Although A-B-C of a zigzag and 1-2-3 of an impulse both subdivide 5-3-5, a second wave correction may not be a triangle for its sole structure within an impulse. This alternate wave count cannot see a triangle for minuette wave (ii).
It is possible that this sideways movement was a series of small first and second waves. The key is in the structure of the upwards wave labelled subminuette wave i. This alternate wave count must see it as a five wave structure; the main wave count must see it as a three. It does fit better as a three (a double zigzag) which slightly increases the probability of the main wave count and slightly decreases the probability of this alternate.
A new high above 1,269.07 would invalidate the main wave count and confirm this alternate.
Within minute wave i, only minuette waves (i), (ii) and (iii) would be most likely complete. Minuette wave (iv) may not move into minuette wave (i) price territory below 1,220.16.
Draw a channel about this impulse unfolding upwards: draw the first trend line from the ends of minuette waves (i) to (iii), then place a parallel copy on the end of subminuette wave ii, so that almost all movement is contained. The upper trend line may provide resistance and the lower trend line may provide support.
Minuette wave (iv) may end within the price territory of the fourth wave of one lesser degree; subminuette wave iv has its range from 1,242.62 to 1,238.31. Minuette wave (iv) may be very shallow.
Thereafter, minuete wave (v) should make new highs and may be long enough to take price above the confirmation point.
When minute wave i is complete, then minute wave ii should unfold and it may be deep.
TECHNICAL ANALYSIS
WEEKLY CHART
Click chart to enlarge. Chart courtesy of StockCharts.com.
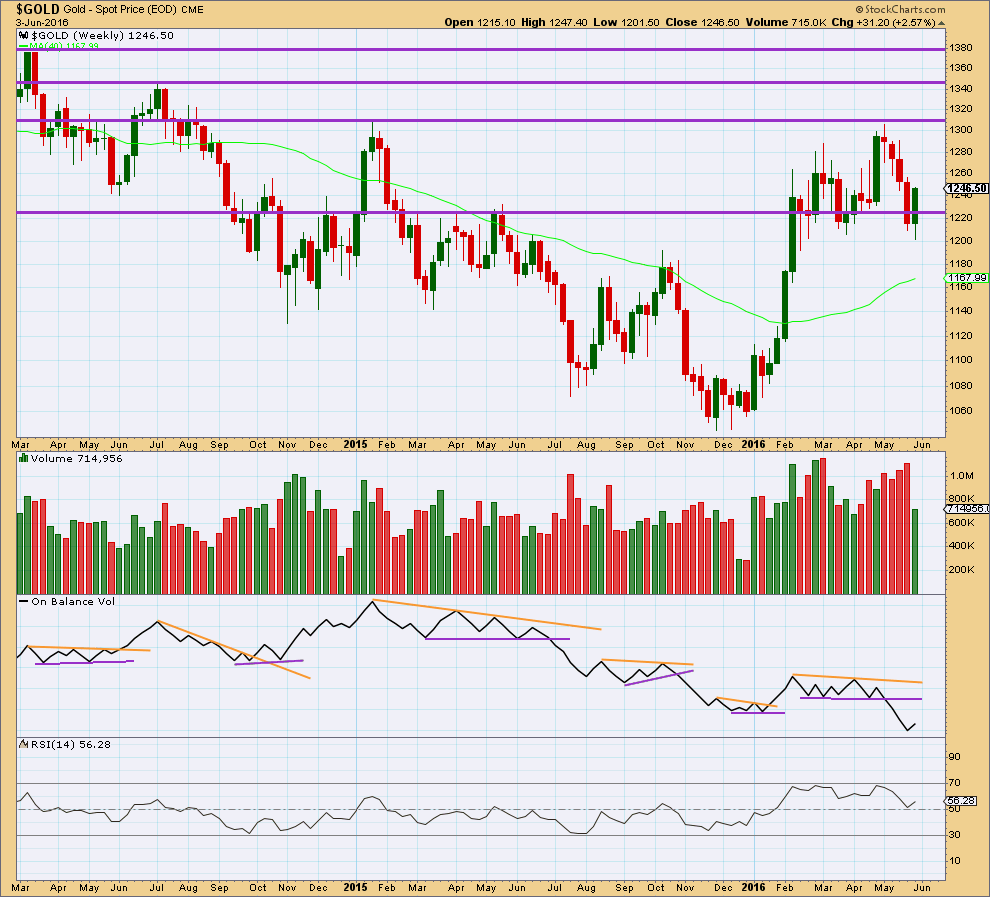
At the end of this week, a strong upwards week has considerably lower volume than prior downwards weeks. This volume profile looks bearish at the weekly chart level. This is the main reason for retaining the main wave count as more likely.
On Balance Volume is turning up at the end of the week. There is not enough sideways movement from OBV yet to draw trend lines about its current range, so it will not be useful to help indicate the next direction from price at the weekly chart level.
DAILY CHART
Click chart to enlarge. Chart courtesy of StockCharts.com.
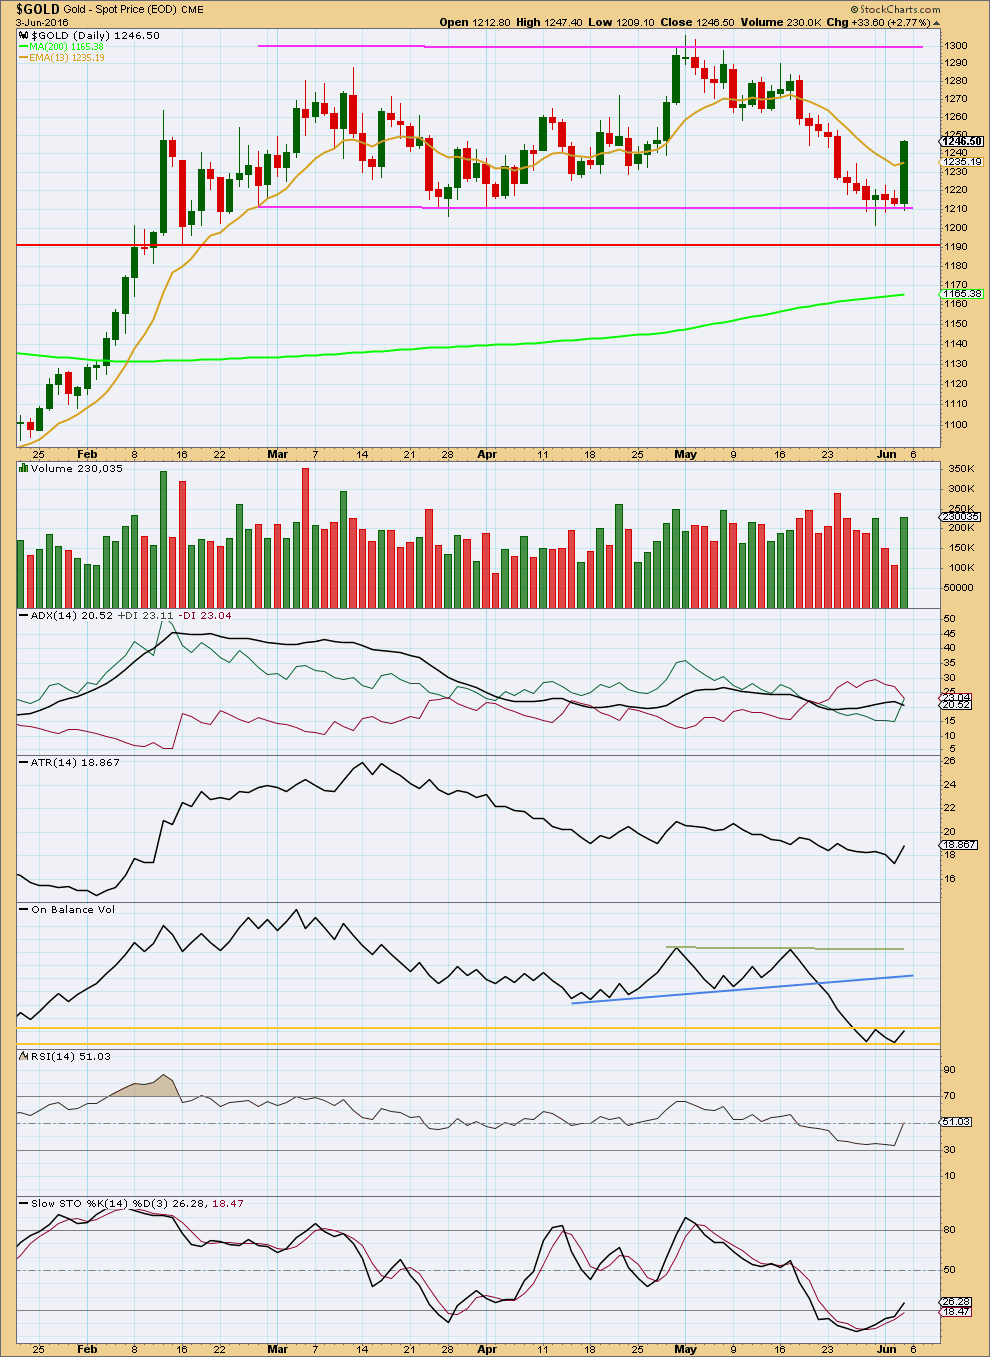
A strong upwards day for Friday comes with an increase in volume. The two strongest recent days are upwards days. This supports the alternate Elliott wave count over the main Elliott wave count. It still looks like price has found support and is moving strongly away and upwards from there, that a new upwards trend is developing.
However, it is concerning that there is strong divergence between price and On Balance Volume. While price made a strong new high on Friday above the prior high of 31st of May, OBV did not make a new high. OBV remains contained within the two gold horizontal trend lines.
If OBV breaks above the upper gold trend line, then the alternate wave count would be favoured. If that happens, I may swap it over with the main wave count.
ADX may be indicating a trend change, but the +DX and -DX lines have not yet crossed over. ADX does not yet indicate a trend is in place.
ATR increased today. It may be beginning to indicate a new trend.
RSI is now neutral and exhibits no divergence with price. There is plenty of room for price to rise or fall.
Stochastics is now returning from oversold.
This analysis is published @ 04:24 a.m. EST on 4th June, 2016.

Long Rambus post on currencies and commodities
http://www.talkmarkets.com/content/commodities/weekend-report-whats-up-in-the-markets-everything?post=96449
Janet Yellen On Deck – speech in Philadelphia is scheduled to begin at 12:30 p.m. EDT.
The marketplace is awaiting a speech later today by Fed Chair Janet Yellen. She may offer new insight into upcoming Fed monetary policy decisions following Friday’s very downbeat jobs report for May that showed a paltry 38,000 rise in the key non-farm payrolls number. Yellen’s speech in Philadelphia is scheduled to begin at 12:30 p.m. EDT.
If she still suggests interest rake hikes soon then I’d expect gold to drop.
Price had managed to rise to a high of 1248.85. This would be Minute 4 (Main) or Minuette 3 (Alt). The first two waves after the high had been established at 1240.10 and 1245.96 respectively.
Momentum should pick up now for most likely Subminuette 3 of Minuette 1 (Main), or Subminuette C (Alt). If price does not drop substantially, then the action favours the Alternate. Let’s see whether Yellen can stir things up.
GUNNER24 – The Gold Miners millionaire’s trade long-setup – June 5th
http://www.gunner24.com/newsletter/nl-060516/