The Elliott wave counts are swapped over today.
The long term target remains the same for the new main Elliott wave count. The short term target is changed.
Summary: The main wave count expects an impulse to end with a final fifth wave up at 1,255. Thereafter, a second wave correction should follow which may be deep. The alternate wave count expects downwards movement from here. In the short term, a new high above 1,248.46 would add confidence to the main wave count and a new low below 1,234.82 (before a new high) would add confidence to the alternate wave count.
New updates to this analysis are in bold.
To see last weekly charts click here.
MAIN DAILY ELLIOTT WAVE COUNT
Volume analysis favours this wave count, which is now more likely than the alternate.
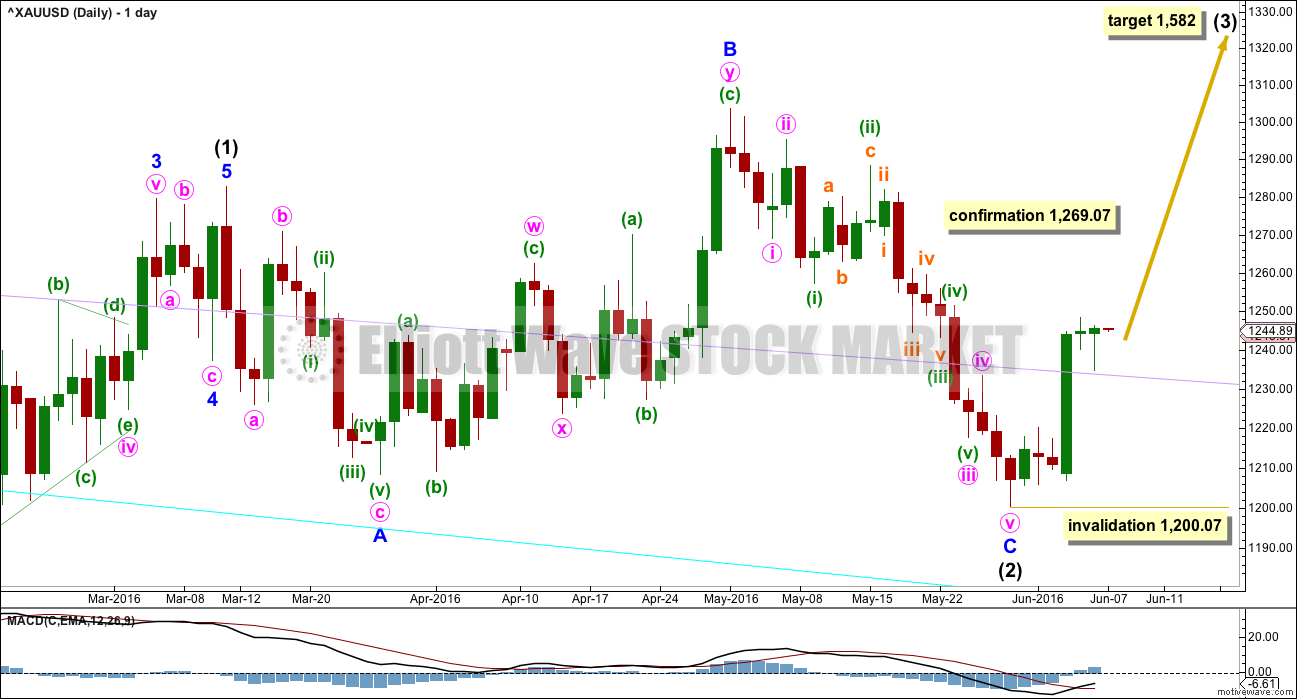
Intermediate wave (2) may be a complete expanded flat correction. It would be a shallow 0.350 correction of intermediate wave (1) lasting 56 days, just one more than a Fibonacci 55. There would be no Fibonacci ratio between minor waves A and C. Minor wave C is a complete impulse.
Within intermediate wave (3), no second wave correction may move beyond the start of its first wave below 1,200.07.
The first wave up within intermediate wave (3) is incomplete. When it is complete, then a following second wave correction should unfold and last about a week. If this wave count is correct, then the upcoming second wave correction may offer an opportunity to join the upwards trend at a good price.
At 1,582 intermediate wave (3) would reach 1.618 the length of intermediate wave (1).
MAIN HOURLY ELLIOTT WAVE COUNT
An impulse looks like it is unfolding upwards at both the daily and hourly chart levels. This increases the probability of this wave count over the alternate below.
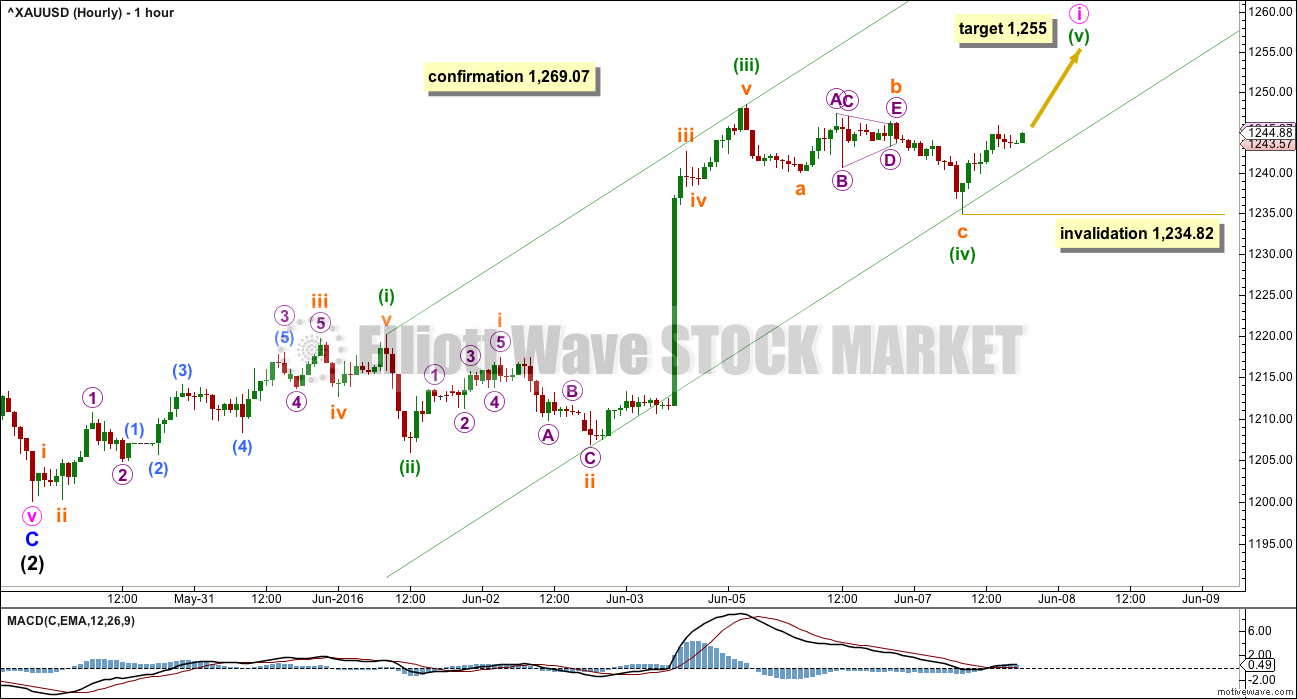
There is no Fibonacci ratio between minuette waves (i) and (iii) so far within the impulse. This makes it more likely that minuette wave (v) will exhibit a Fibonacci ratio to either of (i) or (iii). The most common ratio is equality with the first wave which would be achieved at 1,255.
If price keeps going through this first target, then the next likely target would be at 1,267 where minuette wave (v) would reach 1.618 the length of minuette wave (i).
This wave count would increase in probability further as soon as price makes a new high above the end of minuette wave (iii) at 1,248.46. At that stage, it would be fairly clear that a five wave structure is unfolding upwards.
Draw a channel about this upwards movement: draw the first trend line from the ends of minuette waves (i) to (iii) then place a parallel copy on the end of subminuett wave ii so that most upwards movement is contained. The lower edge of this channel perfectly showed today where downwards movement found support, so the channel is now reinforced.
Sometimes Gold exhibits swift strong fifth waves. Look out for this tendency here. If price breaks above the upper edge of this channel, then that would be what is happening. At that stage, targets may be too low. However, swift strong fifth waves for Gold are more commonly seen to end its third wave impulses and not often for its first wave impulses. Be aware of this possibility, but in this instance it is not the most likely scenario.
When minute wave i is complete, then a Fibonacci retracement may be drawn along its length. The 0.618 Fibonacci ratio would then be a target for minute wave ii.
ALTERNATE DAILY ELLIOTT WAVE COUNT
This wave count is now an alternate because volume and short term structure do not favour it at this stage.
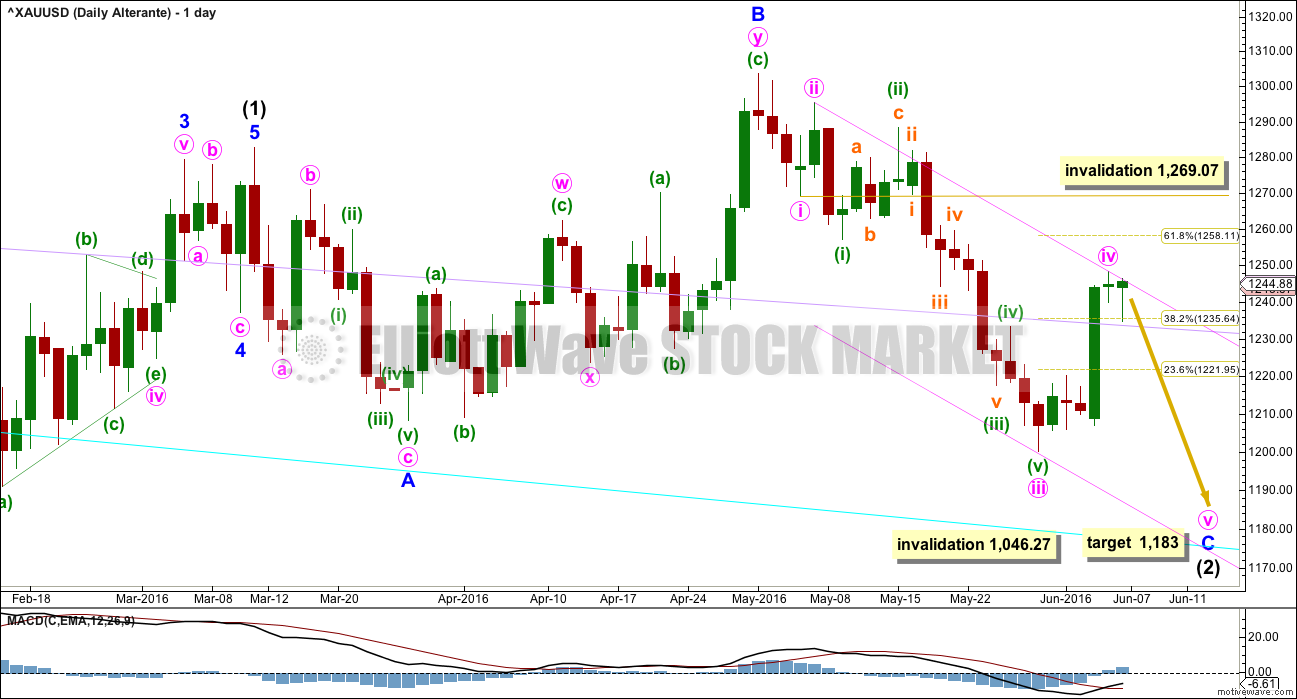
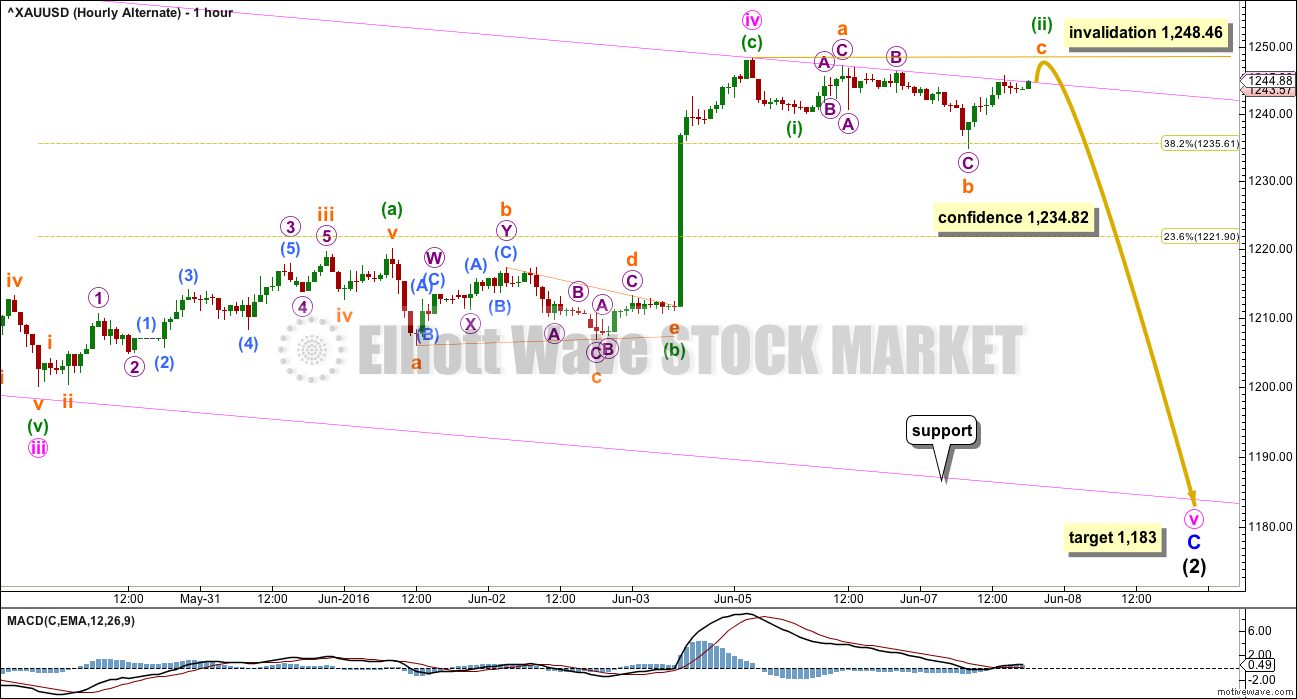
Intermediate wave (2) may still be incomplete; minute wave v downwards may still be required to complete it. At 1,183 minor wave C would reach 1.618 the length of minor wave A.
Minor wave C may be an incomplete impulse. Minute wave iv may be over. If minute wave iv continues any higher, then it may not move into minute wave i price territory above 1,269.07. That must remain the final invalidation point for this wave count.
To the downside, intermediate wave (2) may not move beyond the start of intermediate wave (1) below 1,046.27.
ALTERNATE HOURLY ELLIOTT WAVE COUNT
Minute wave ii was a quick deep 0.76 zigzag lasting 23 hours. If minute wave iv is over now as labelled, then it exhibits no alternation in structure with minute wave ii: both are zigzags. Minute wave iv no longer exhibits good alternation in depth because it is now relatively deep at 0.51 of minute wave iii.
The lack of alternation in structure reduces the probability of this wave count. The reduction in alternation in terms of depth reduces probability further.
Sideways movement labelled minuette wave (b) fits perfectly as a triangle. There is no Fibonacci ratio between minuette waves (a) and (c).
A new low below 1,234.82 now would invalidate the main wave count at the hourly chart level and provide some confidence in this alternate wave count. A new low below 1,200.07 would provide final price confirmation of this alternate wave count.
In the short term, a new high above the start of minuette wave (i) at 1,248.46 would substantially reduce the probability of this wave count. At that stage, the structure of minuette wave (c) would be seen as continuing higher which becomes problematic. It is possible that minute wave iv could yet continue higher, and the invalidation point must remain at 1,269.07.
TECHNICAL ANALYSIS
DAILY CHART
Click chart to enlarge. Chart courtesy of StockCharts.com.
I am finding for technical analysis the daily chart rather than the weekly chart more useful at this stage, so only the daily will be used.
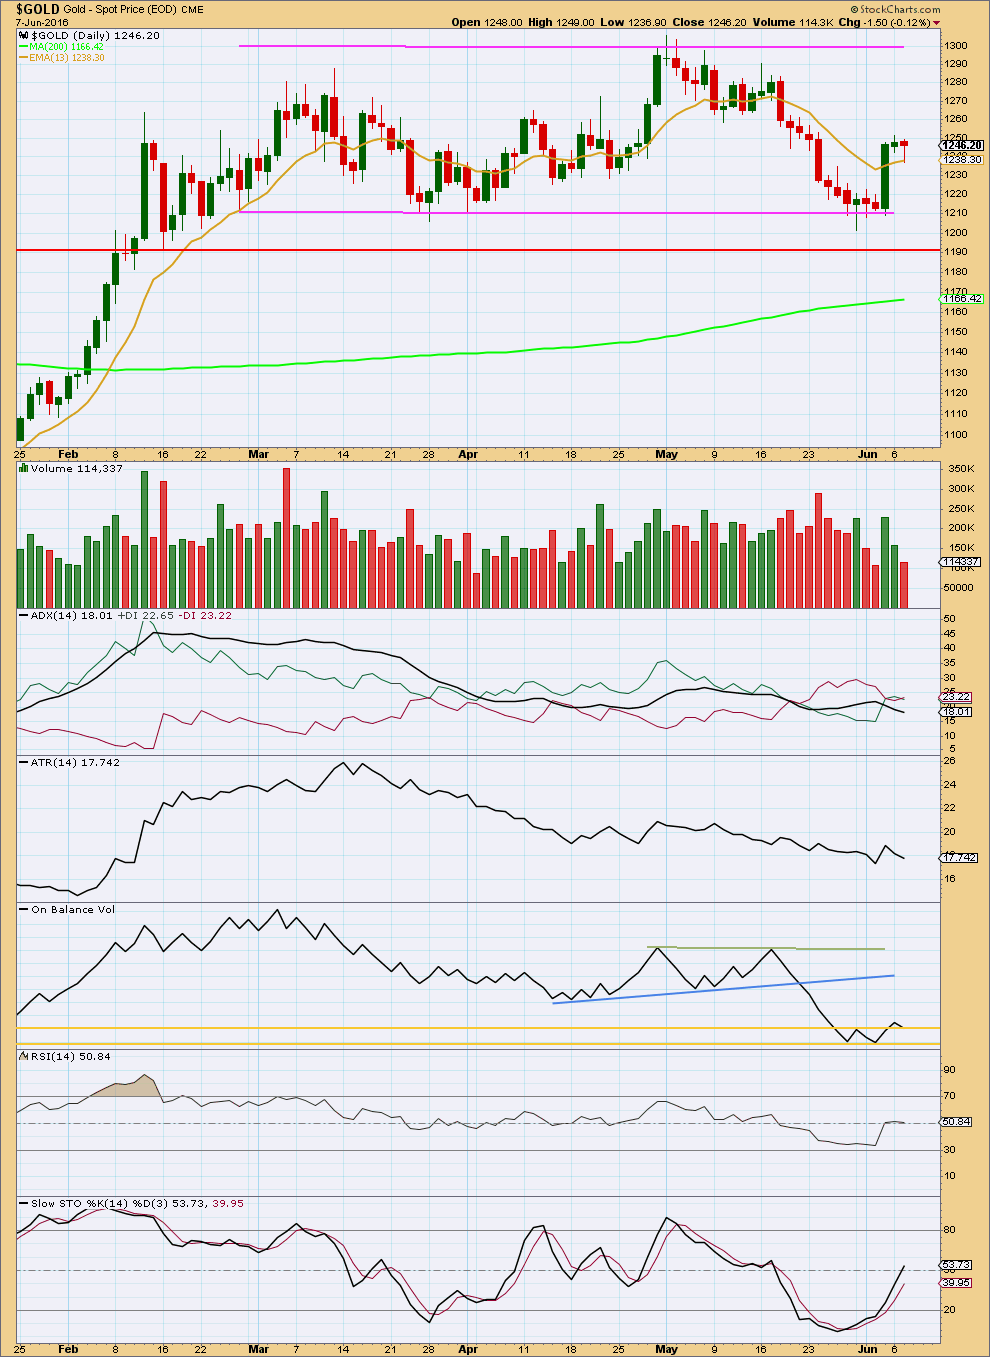
Volume over the last nine days now has two strongest days as upwards days. Price found strong support about the lower pink trend line which is about 1,210 and has bounced up from there.
The last two days complete small range days on lighter volume. This looks like a small consolidation within an upwards swing. Price today found some support about the 13 day moving average.
ADX does not indicate this market is trending. It indicates the market may still be consolidating. The ADX line is declining and the directional lines are fluctuating about each other. ATR agrees. This market is not currently trending.
A range bound approach may be used. With Stochastics returning from oversold and price returning from support, more upwards movement would be expected to continue until price finds resistance and Stochastics reaches overbought at the same time.
On Balance Volume gave a weak bullish signal with a break above the yellow horizontal line. Now OBV has come down to test support at that line. If OBV turns up from there, the strength of that line would be reinforced and that would provide a further bullish signal. This favours the main wave count.
RSI is neutral. There is plenty of room for price to rise or fall.
This analysis is published @ 07:31 p.m. EST.

Doesn’t look like Gold price will be getting below its pivot in a hurry…..
The miners are stronger than gold because more investors are buying miners at every dip. So I’m concerned that if one were to wait a week or two to buy miners after the drop down in minute wave ii, that the miners may not be any cheaper than what they are now. That has already happened several times since the gold rally started mid January.
Gold may make a new high above 1,269.07 to end minute i then a .618 retrace may have minute ii possibly bottom at 1,226.43.
Do you think GDX miners would be any cheaper if gold slowly dropped $43 over a choppy week or two?
NO. Stephen C. New London (not much cheaper)
It is frustrating waiting for retrace to buy cheaper especially if it may not happen.
The main wave count has increased in probability. It sure is looking like Gold has found it’s low for intermediate (2) and now is in the very early stages of intermediate (3).
Minute i is close to completion. One final thrust up will do it.
Then one to maybe even two weeks down with choppy overlapping movement for minute ii.
Updated hourly chart.
Gold often has very short fifth waves out of it’s fourth wave triangles. We may not get the clarity I would so like. The target may be about right.
Also noting divergence with MACD exactly as a fifth wave should… one that isn’t extended that is.
Hi Lara, the target is 1267, yet the confirmation is higher – 1269.07, I don’t understand.
Below 1,269.07 both wave counts technically remain valid.
For the main wave count an impulse up for a first wave may end below 1,269.07, leaving both wave counts valid and leaving us with a lack of clarity.
The main wave count has increased in probability, but it is not finally confirmed.
So this upwards wave may be one of two things: it may be the start of a new trend (main wave count) or it may still be a counter trend movement (alternate wave count).
1,269.07 is the price point that differentiates the two ideas.
A new high above 1,269.07 means upwards movement is a new trend. But while price hasn’t broken above that point it could still be a counter trend movement, or another way to say it is it could still be a rally within a downwards trend.
Does that make sense?
Perfect sense thanks Lara, thanks very much for the explanation, I understand now!
Gold going up from 2:50 pm but NUGT being dumped from 2:42 pm at 110.28 now at low of the day at 107.90 at 3:28 pm. Down to 106.92 at 3:32
Gold may likely have peaked at 1264.50 at 9:55 am and NUGT high was 113.58 at 9:44 am.
Is gold now near the end a 4th wave preparing for a final 5th up to 1,269.07 area?
Or did gold finish a 5 wave count up to 1,264.50 at 9:55 am?
Good question…I have no idea! I thought Lara was saying that 5 of 1 was possibly complete and the start of 2 down could be underway from todays high…even though she wanted to see 1269ish as a top?! Am I even close?
I think it’s completing a small fourth wave triangle.
That’s what it looks like on the hourly chart anyway.
A final short sharp thrust up out of the triangle would complete the whole structure.
I’m hoping my target of 1,267 is a bit low and that price can make at least a slight new high above 1,269.07 to give us clarity before minute i is over.
Then we’ll be looking for minute ii down to provide us a nice entry.
Patience will be necessary. Minute ii could well last over a week. If members are very experienced then they may like to scalp shorts on the way down, but I’ll be sitting it out waiting for a set up.
For now, the channel holds so minute i is incomplete. Only when that channel is breached on the hourly chart would I expect minute ii has begun.
She mentioned,
“I’m really actually hoping that it will move a little higher, to just above 1,269.07 so that we have clarity.”
“The channel is holding very nicely indeed.
As soon as price breaks below support I’d expect minute i is over and minute ii would have just begun. Not yet….”
Did Gold not peak at 1267.20 at about 10am? I’m very new at this, so please pardon my ignorance on trying to understand the wave counts and proper labeling!
Gold high now at 1264.50 at 9:55 am and still looks like it may go higher as maybe no parabolic top since today’s open, so 1,267 appears to still be possible, unless the $7 in the last hour was the parabolic top?
Then a .618 retrace of all minute 1 from 1,200.07 it’s start all the way up to 1,264.50 or 1,267.
The channel is holding very nicely indeed.
As soon as price breaks below support I’d expect minute i is over and minute ii would have just begun.
Not yet….
Shouldn’t you be asleep! Go get some rest! We need you for your afternoon post; prior to trading close 😉
Thanks for your reply, Lara!
LOL Well spotted.
I randomly get up from time to time, I was expecting the S&P could possibly have topped… but no. Not today Josephine.
I enjoy the commentary so thanks to those that post!
Gold is at 1,258.41.
Within Lara’s summary, she included the following:
There is no Fibonacci ratio between minuette waves (i) and (iii) so far within the impulse. This makes it more likely that minuette wave (v) will exhibit a Fibonacci ratio to either of (i) or (iii). The most common ratio is equality with the first wave which would be achieved at 1,255.
If price keeps going through this first target, then the next likely target would be at 1,267 where minuette wave (v) would reach 1.618 the length of minuette wave (i).
While the comments after her analysis targeted 1,255 to 1,256, I’m wondering if 1,267 is in the cards.
Hi Stephen, yes, looks like it so far.
I’m really actually hoping that it will move a little higher, to just above 1,269.07 so that we have clarity.
One more pop left up to complete the move imo once we break the triangle
Thanks Lara,
Can you elaborate on your summary statement:
“Thereafter, a second wave correction should follow which may be deep.”?
How quickly would we expect this to start and what would the expected duration or amplitude be?
Second wave corrections typically retrace 0.618 of the former rise. Minor 1 started at 1199.90. The expected end of Minute 1 is around 1255-1256. So, the drop should target 1221.
As mentioned in my post below, the end is nigh. In all probability, subminuette 3 is already over at 1253.58 and we are in the dreaded tortuous and convoluted subminuette wave 4. One more rise would then complete minuette 5 and hence Minute 1.
It is not easy to tell with precision how long the correction takes. Normally, second waves are quite violent but they are also known to take some time. It just depends on what form it takes. What it needs is to count 3 waves down, and we’re be all set.
Hope this helps.
Thanks Alan.
I think you’ve answered it very well. I don’t have much to add TBH.
Adam, any expectation of where minute ii may end is provisional while we don’t know where it begins, because minute i is still completing.
The only other thing to add is the channel on the main hourly chart will continue to be very useful. Keep drawing it in the same way. The lower edge so far is providing support. When that support gives way then minute ii has begun. Then draw a Fibonacci retracement along the length of minute i and use the 0.382 and 0.618 Fibonacci ratios as targets for minute ii, favouring the 0.618 ratio.
And a slight new high intra hour above 1,248.46 further increases probability of the main wave count and decreases probability of the alternate.
The plan is to enter long on the end of the second wave correction coming up.
Any long entries here may be able to make a short term profit. The probability of upwards movement has increased from this point.
My sentiments exactly.
For the main wave count we are almost there. Subminuette 3 of Minuette 5 is completing (or has completed).
Going long after the Minute 2 correction should be a very profitable trade. May even hold for some time.
That’s my plan too Alan. Love third waves, and if all goes well we may have one coming up.
But of course, I may be wrong. So managing risk will be essential. Just in case.
Gold Still Building Up Its Head Of Steam As Stocks Move Higher
Tuesday June 07, 2016 17:53
http://www.kitco.com/commentaries/2016-06-07/Gold-Still-Building-Up-Its-Head-Of-Steam-As-Stocks-Move-Higher.html
Lara please switch the names of the waves in this alternate sentence.
“A new low below 1,234.82 now would invalidate the alternate below (main above) at the hourly chart level and provide some confidence in this main (alternate) wave count.
Sorry Richard!
That is fixed now.
Well spotted. Both Cesar and I missed that one.
It’s ok Lara, minor typo in a Masterpiece analysis.
I used to find all the typos that the proof reading department missed at the companies I worked at and I wasn’t in the proof reading department.
I’d trade my proof reading skills for more Elliott Wave skills everyday of the week. LOL.