
Upwards movement continues as the Elliott wave count expects. A correction has not yet unfolded.
Summary: A third wave is underway. Use the pink channel on the daily chart to indicate when the next correction has arrived. This upcoming correction should offer a good opportunity to join the trend. The mid term target is at 24.22. Risk and the invalidation point is at 15.818.
New updates to this analysis are in bold.
MONTHLY WAVE COUNT
Click chart to enlarge.
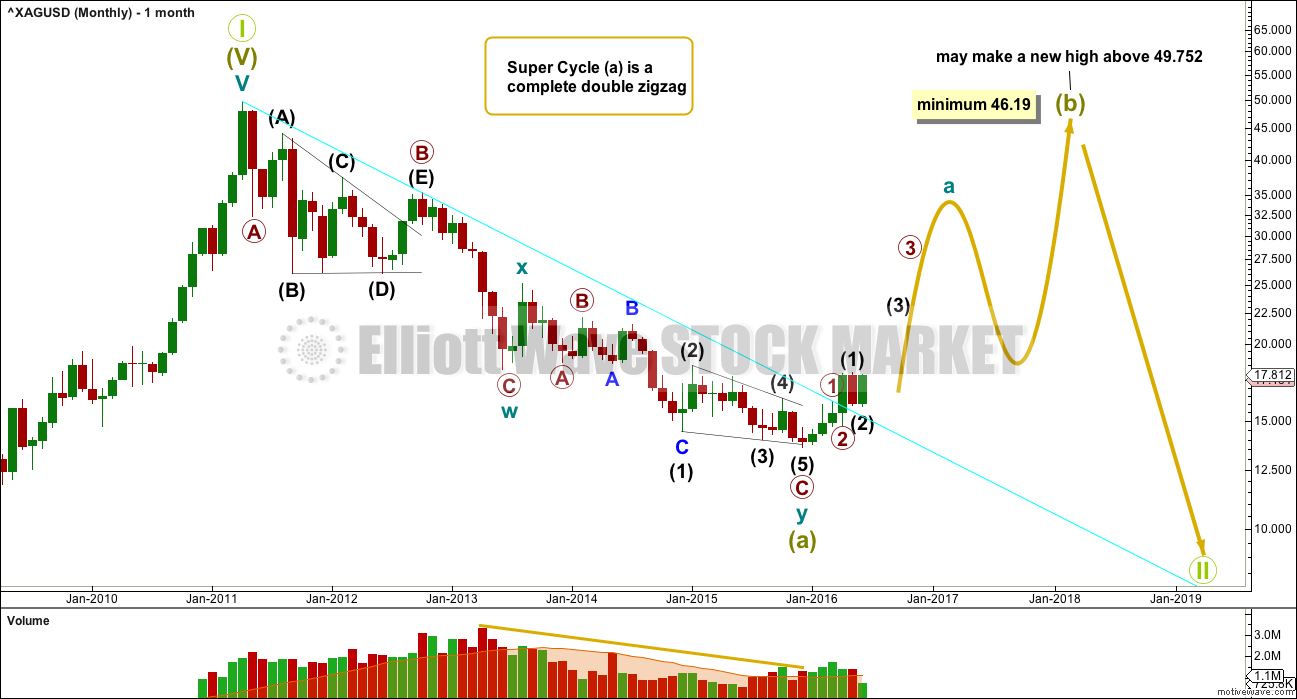
If super cycle wave (a) is a double zigzag, then within the second zigzag of the double labelled cycle wave y the structure may be complete.
There is a small overshoot of the (1)-(3) trend line at the end. This indicates the contracting diagonal structure is very likely to be complete.
If this wave count is correct, then super cycle wave (a) has subdivided as a three wave structure. That indicates Grand Super Cycle wave II may be a flat correction.
If this correction at Grand Super Cycle is a second wave (as opposed to a fourth wave), then a triangle may be eliminated.
A combination may also be eliminated because the first wave is a multiple. Combinations may only consist of a maximum of three corrective structures, so within each of W, Y and Z they may only subdivide into simple A-B-C structures (or A-B-C-D-E in the case of triangles). To label multiples within multiples increases the maximum beyond three, violating the rule.
Super Cycle wave (b) must retrace a minimum 90% of super cycle wave (a) at 46.19. Super cycle wave (b) may make a new price extreme beyond that seen for super cycle wave (a) above 49.752 as in an expanded flat.
Super cycle wave (b) may be any one of 23 possible corrective structures. It is impossible to predict at this early stage which one it will be, only to say it is unlikely to be a rare structure such as a running flat, expanding triangle or triple combination. That still leaves multiple structural possibilities. The most likely structure which would be able to meet the minimum price requirement at 23.945 is a zigzag.
The first movement up for a wave of this large degree must subdivide as a clear five at the daily chart level, and probably at the weekly chart level also.
WEEKLY WAVE COUNT
Click chart to enlarge.
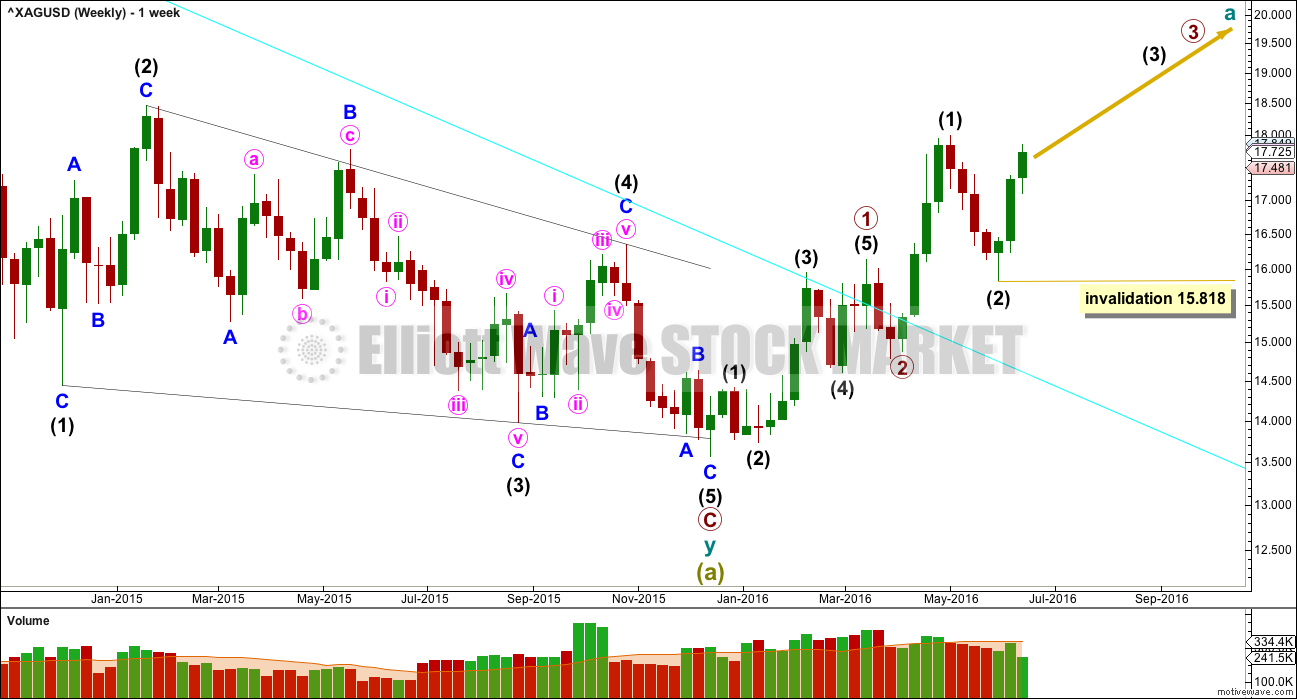
Primary wave C is an ending contracting diagonal within the zigzag of cycle wave y. All subwaves subdivide as zigzags. The third wave is shorter than the first, the fifth wave is shorter than the third, and the fourth wave is shorter than the second. The trend lines converge.
Two first and second wave corrections may be complete. Silver may be ready to move into a strong third wave up.
If this is correct, then within intermediate wave (3) no second wave correction may move beyond the start of its first wave below 15.818.
DAILY WAVE COUNT
Click chart to enlarge.
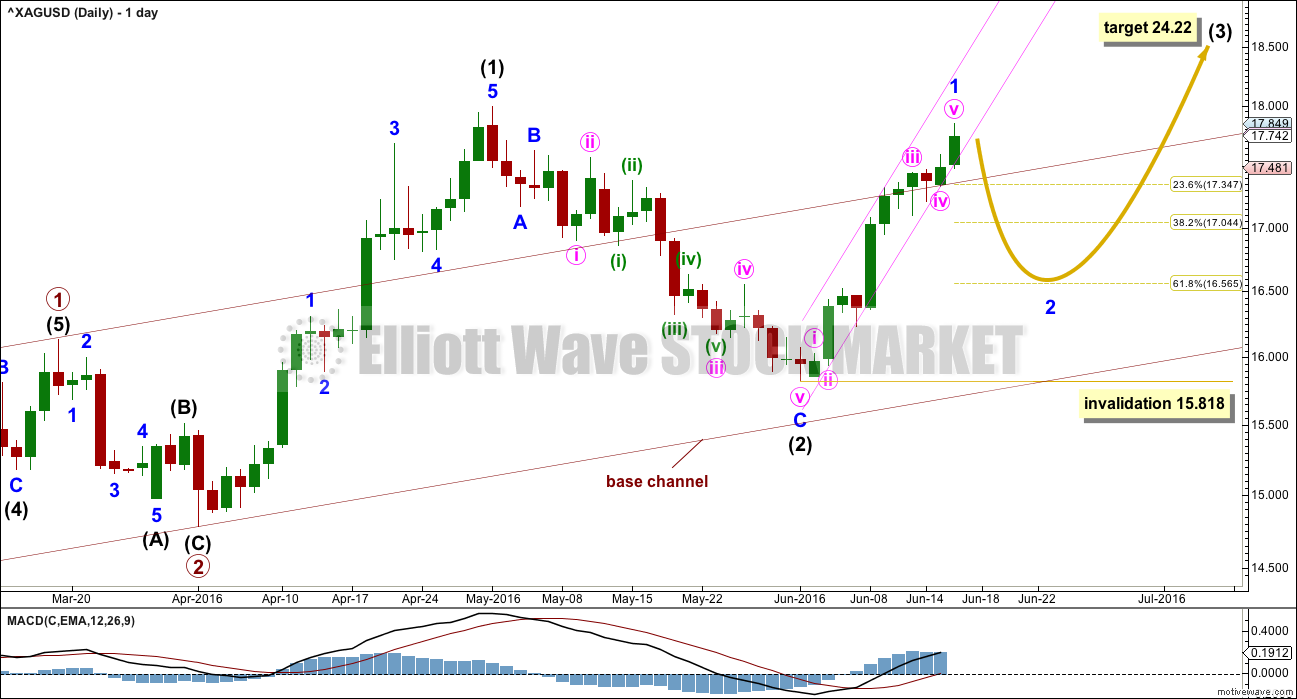
At 24.22 intermediate wave (3) would reach 2.618 the length of intermediate wave (1).
At this stage, the first five up labelled minor wave 1 may be either complete here or very soon. The structure on the hourly chart looks like it is ending with an extended fifth wave. Minute wave v looks like a typical blowoff top so far. At the hourly chart level, there is divergence between price and MACD at the last high indicating weakness. This does not tell exactly when and where price will turn though.
The base channel provided some resistance before it was breached. This trend line has been breached before yet price turned back down below it. It does not offer strong technical significance.
Use the small pink channel about minor wave 1. When this is breached by downwards movement with a full daily candlestick below and not touching the lower edge, then it would be confirming minor wave 1 as over and minor wave 2 as underway. At that stage, the 0.382 and 0.618 Fibonacci ratios of minor wave 1 would be targets for minor wave 2, with the 0.618 Fibonacci ratio favoured.
If minor wave 1 moves higher then redraw the Fibonacci retracement.
TECHNICAL ANALYSIS
DAILY CHART
Click chart to enlarge. Chart courtesy of StockCharts.com.
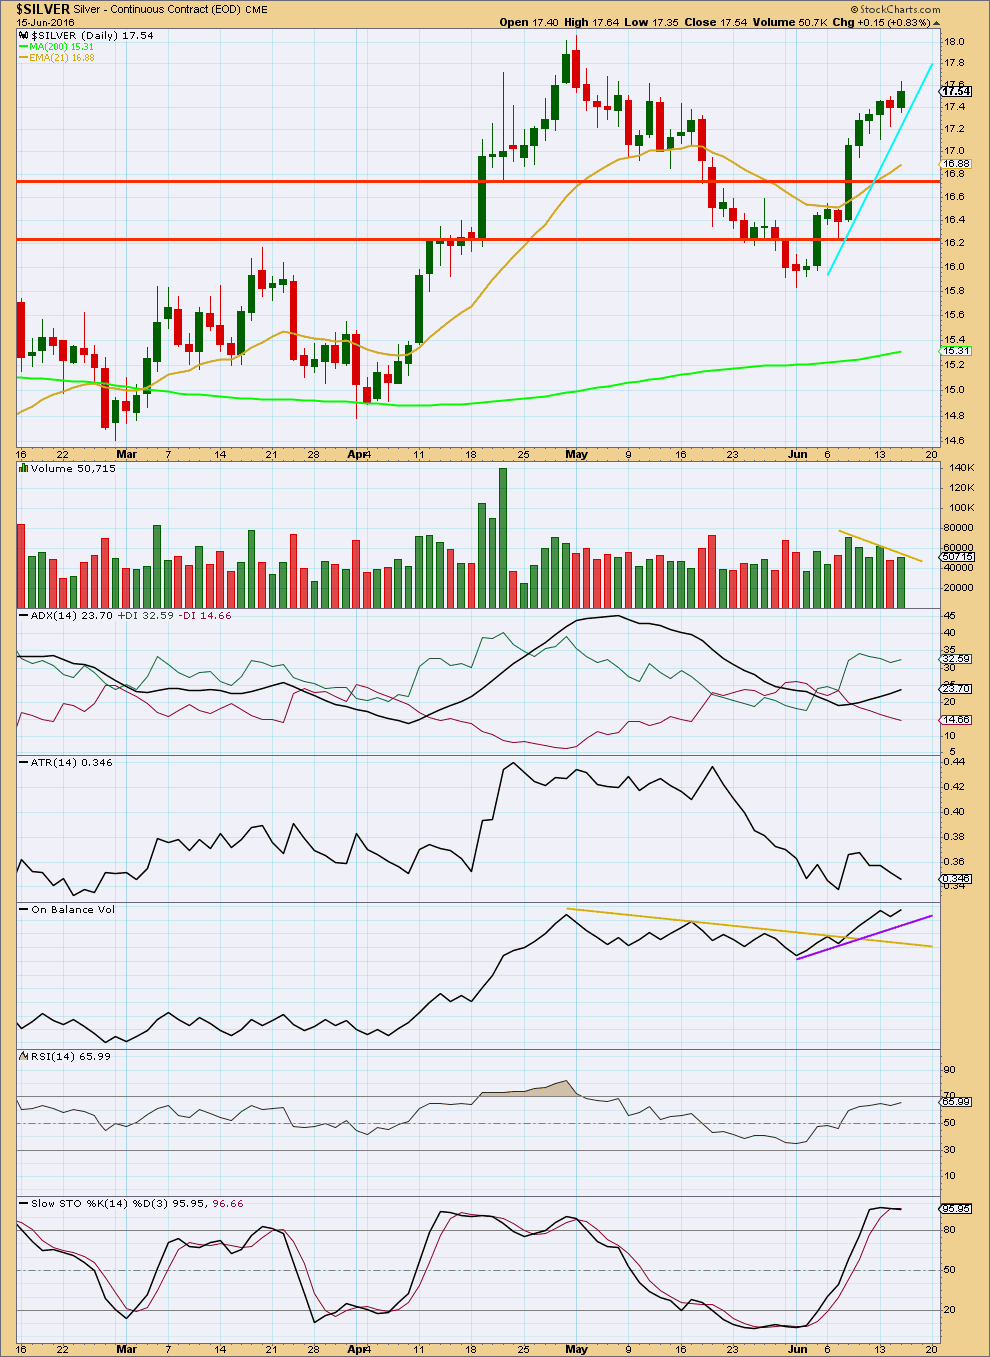
The first part of this new upwards trend began with increasing volume, but for the last five sessions volume has overall declined as price has moved higher. The rise in price is not supported by volume, so it is suspicious. A correction should be expected sooner rather than later as fairly likely.
ADX is increasing indicating there is an upwards trend in place.
ATR is declining for the last four sessions indicating the trend is weakening. Each day over the last four sessions the bulls are able to push up price by a smaller and smaller amount.
On Balance Volume is bullish. There are no upper trend lines to provide resistance here. A correction may end when OBV finds support at the purple or yellow trend lines. The purple line is too steep and has little technical significance, so it may not offer much support. However, the yellow line may offer support as it is more shallow, longer held and repeatedly tested.
RSI is not yet quite oversold. There is still a little room for price to rise further.
Stochastics is now showing some divergence with price. This is further indication of weakness, but it cannot tell price will turn here. Divergence can persist for some time before price turns.
This analysis is published @ 04:41 a.m. EST on 16th June, 2016.