
Downwards movement was expected for the week.
The week began with two downwards days then price turned and moved higher, but so far it has not made a new high.
Summary: The short term picture for Oil is unclear. Oil may make a new high in the next few days. If it does, then a trend change should be imminent. The main wave count still expects overall downwards movement to end within a range of 26.06 – 16.33. But the alternate allows for a new high first, and it has a reasonable probability.
New updates to this analysis are in bold
MONTHLY ELLIOTT WAVE COUNT
Click chart to enlarge.
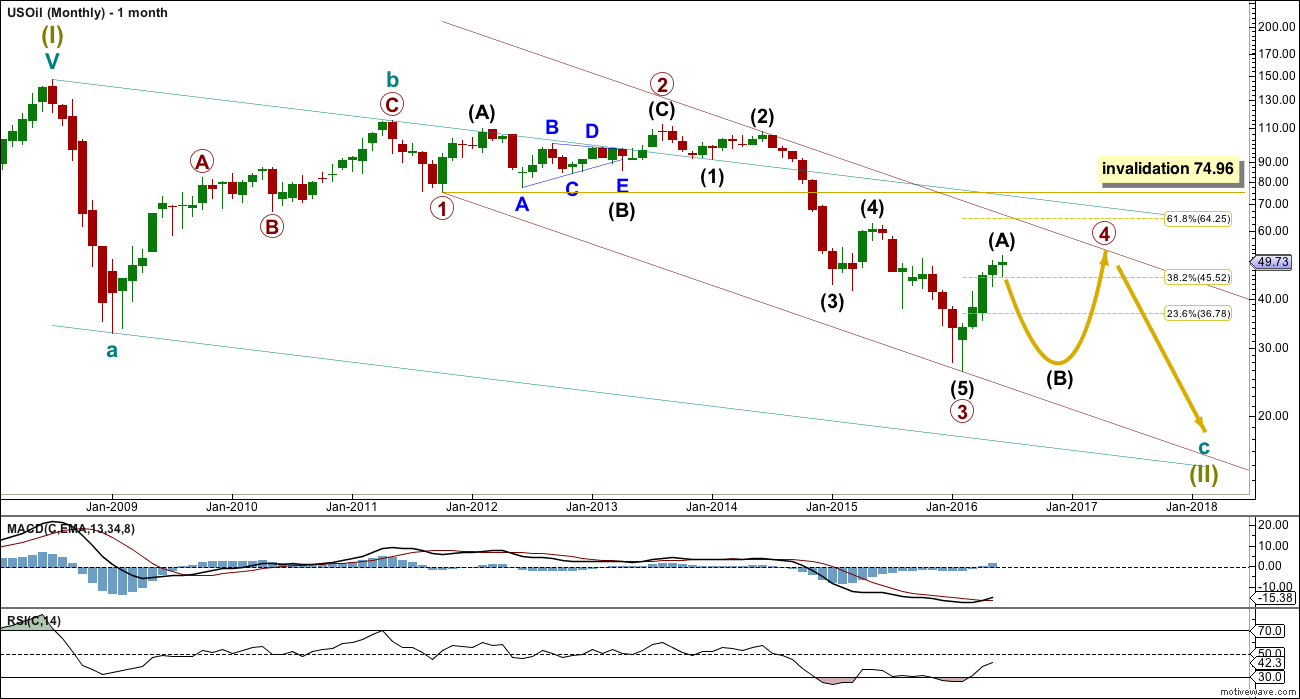
Within the bear market, cycle wave b is seen as ending in May 2011. Thereafter, a five wave structure downwards for cycle wave c begins.
Primary wave 1 is a short impulse lasting five months. Primary wave 2 is a very deep 0.94 zigzag lasting 22 months. Primary wave 3 is a complete impulse with no Fibonacci ratio to primary wave 1. It lasted 30 months.
Primary wave 4 is likely to exhibit alternation with primary wave 2. Primary wave 4 is most likely to be a flat, combination or triangle. Within all of these types of structures, the first movement subdivides as a three.
Primary wave 4 is likely to end within the price territory of the fourth wave of one lesser degree; intermediate wave (4) has its range from 42.03 to 62.58.
Primary wave 4 may end if price comes up to touch the upper edge of the maroon channel. The upper edge of this channel has been pushed up to sit on the end of intermediate wave (2) within primary wave 3.
Primary wave 4 is most likely to be shallow to exhibit alternation in depth with primary wave 2. So far it has passed the 0.382 Fibonacci ratio at 45.52. It may now move mostly sideways in a large range.
Primary wave 4 may not move into primary wave 1 price territory above 74.96.
DAILY ELLIOTT WAVE COUNT
Click chart to enlarge.
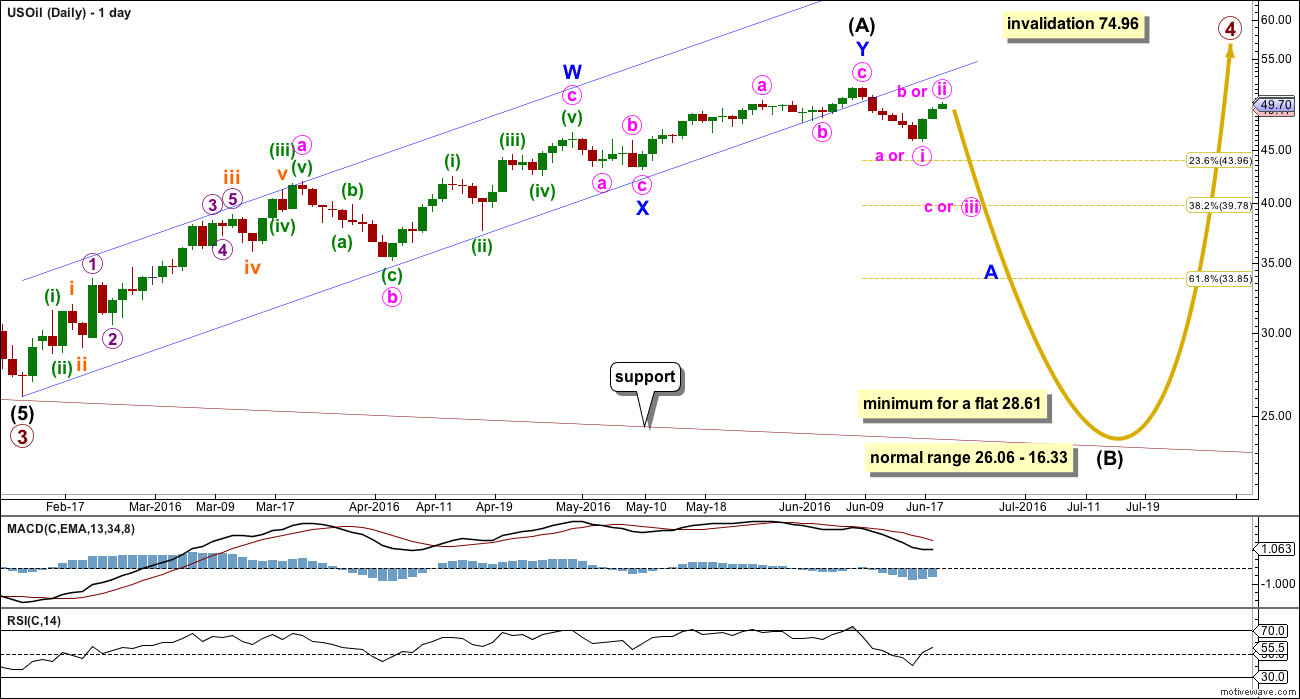
Intermediate wave (A) looks may be complete as a double zigzag. The best fit channel about intermediate wave (A) has now been breached by downwards movement. This may indicate a trend change.
If intermediate wave (A) is a three, then intermediate wave (B) is most likely to be a very deep correction. It may make a new low below the start of intermediate wave (A) at 26.06.
If primary wave 4 is to be a flat correction, then intermediate wave (B) must be a minimum 0.9 length of intermediate wave (A) at 28.61. The normal range for intermediate wave (B) would be 1 to 1.38 the length of intermediate wave (A) at 26.06 to 16.33.
If primary wave 4 is to be an expanded flat correction, then intermediate wave (B) should be 1.05 the length of intermediate wave (A) or longer, at 24.78.
If primary wave 4 is to be a triangle, then intermediate wave (B) has no minimum nor maximum. It must only subdivide as a three wave structure. It may make a new low below the start of intermediate wave (A) at 26.06 as in a running triangle.
Primary wave 4 may not move into primary wave 1 price territory above 74.96.
Intermediate wave (B) may be any of more than 23 possible corrective structures. It would most likely be a single or multiple zigzag in order to be a deep correction. It may also be an expanded flat to be deep. It may find support at the lower edge of the maroon channel.
Minor wave A would most likely subdivide as a five but may also be a three. If it is a three, then minute wave b may make a new high above the start of minute wave a as in an expanded flat correction. There is no upper invalidation point for this wave count this week for this reason.
ALTERNATE DAILY ELLIOTT WAVE COUNT
Click chart to enlarge.
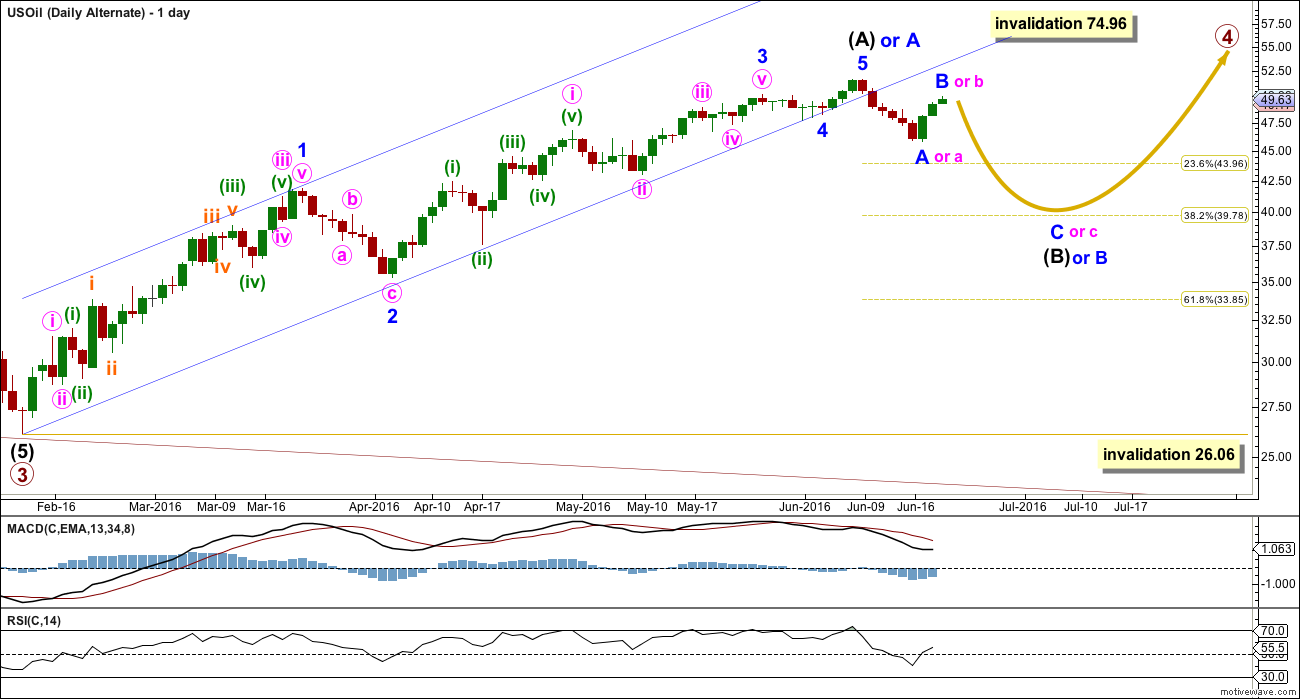
Primary wave 4 may be unfolding as a zigzag, or a zigzag upwards may be almost complete for intermediate wave (A) (as per alternate labelling on this chart this week).
It is possible that only minor wave A is a five wave structure complete upwards and minor wave B down is unfolding. If minor wave B is a flat correction or running triangle, then within it minute wave b may make a new high. There is no upper invalidation point for this wave count this week for this reason.
TECHNICAL ANALYSIS
MONTHLY CHART
Click chart to enlarge. Chart courtesy of StockCharts.com.
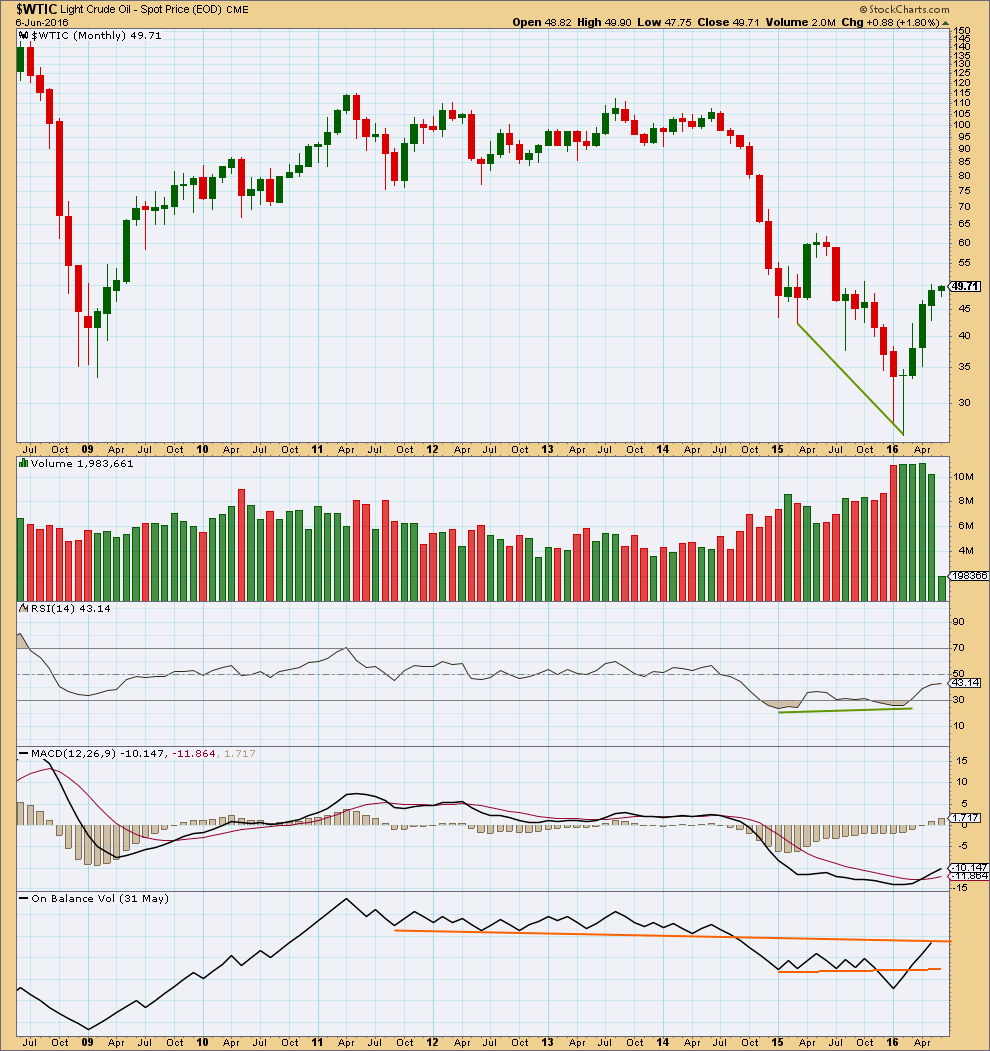
The month of May shows a decline in range and volume. This supports the idea of a mid term high in place. A pullback from here seems reasonable.
On Balance Volume may assist to hold price about here. It has come up to find resistance at the upper line.
DAILY CHART
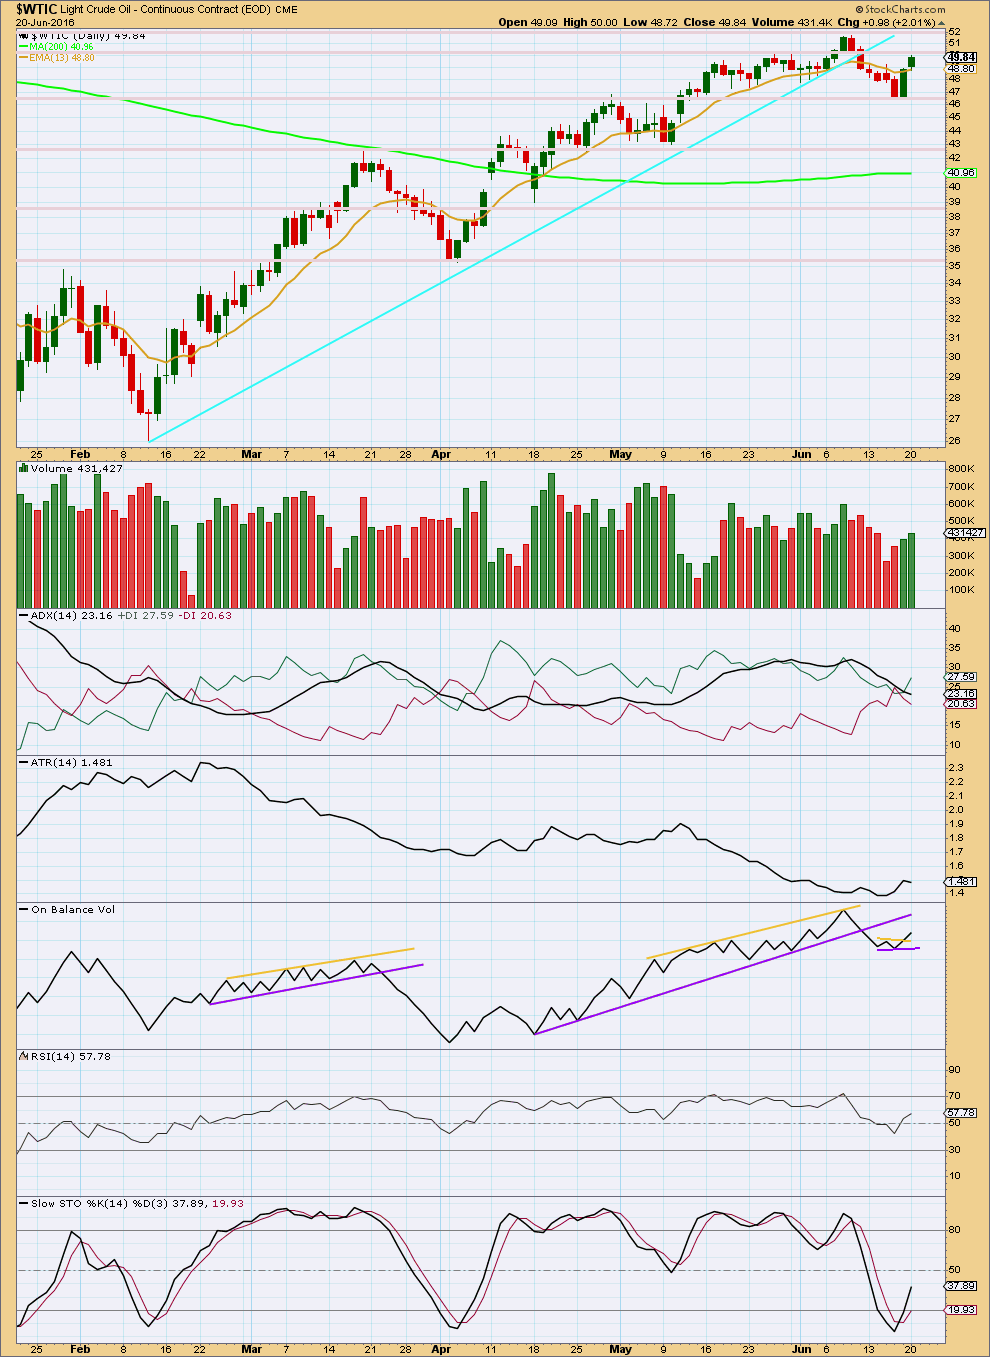
Click chart to enlarge. Chart courtesy of StockCharts.com.
Upwards movement for the last two days is supported by increasing volume. In the short term, at least some more upwards movement looks likely to test the last high and resistance at 51.67.
ADX is declining indicating the market is consolidating. ATR is overall flat to declining, so it is mostly in agreement. Price is range bound between 51.60 and 46.60.
Stochastics is returning from oversold, so an upwards swing should be expected to continue until Stochastics is overbought and price reaches resistance at the same time.
On Balance Volume has given a small bullish signal with a break above a short yellow line.
Trading a consolidating market is advised for only the most experienced traders. With the Elliott wave count seeing a B wave as unfolding and ADX indicating a consolidation, it would be wisest to avoid this market at this time.
This analysis is published @ 02:47 a.m. EST on 21st June, 2016.