
The target for a small correction to arrive was 19.384. Price moved 1.678 above the target before printing a red daily candlestick.
Summary: A short term target at 21.255 – 21.244 may be met in a few days time. If price exhibits any divergence with RSI at the daily chart level, then look out for a larger correction. This trend is now extreme for Silver. Extreme overbought levels may be resolved with the next correction. Thereafter, the longer term target remains at 24.22.
New updates to this analysis are in bold.
WEEKLY WAVE COUNT
Click chart to enlarge.
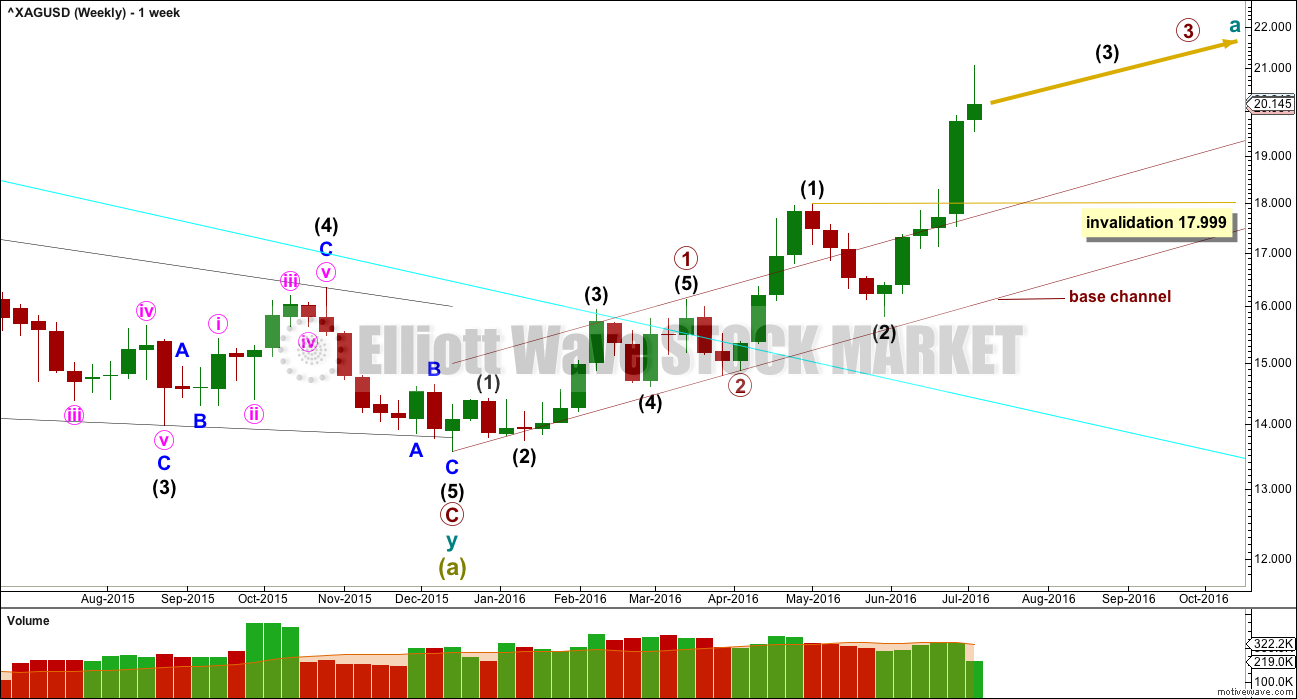
Two first and second wave corrections may be complete. Silver may be ready to move into a strong third wave up.
If this is correct, then within intermediate wave (3) no second wave correction may move beyond the start of its first wave below 15.818.
Draw a base channel about primary waves 1 and 2 as shown. The lower edge should provide support for any deep corrections along the way up. Price has broken above the upper edge confirming a third wave. The upper edge is now providing support and may continue to do so.
DAILY WAVE COUNT
Click chart to enlarge.
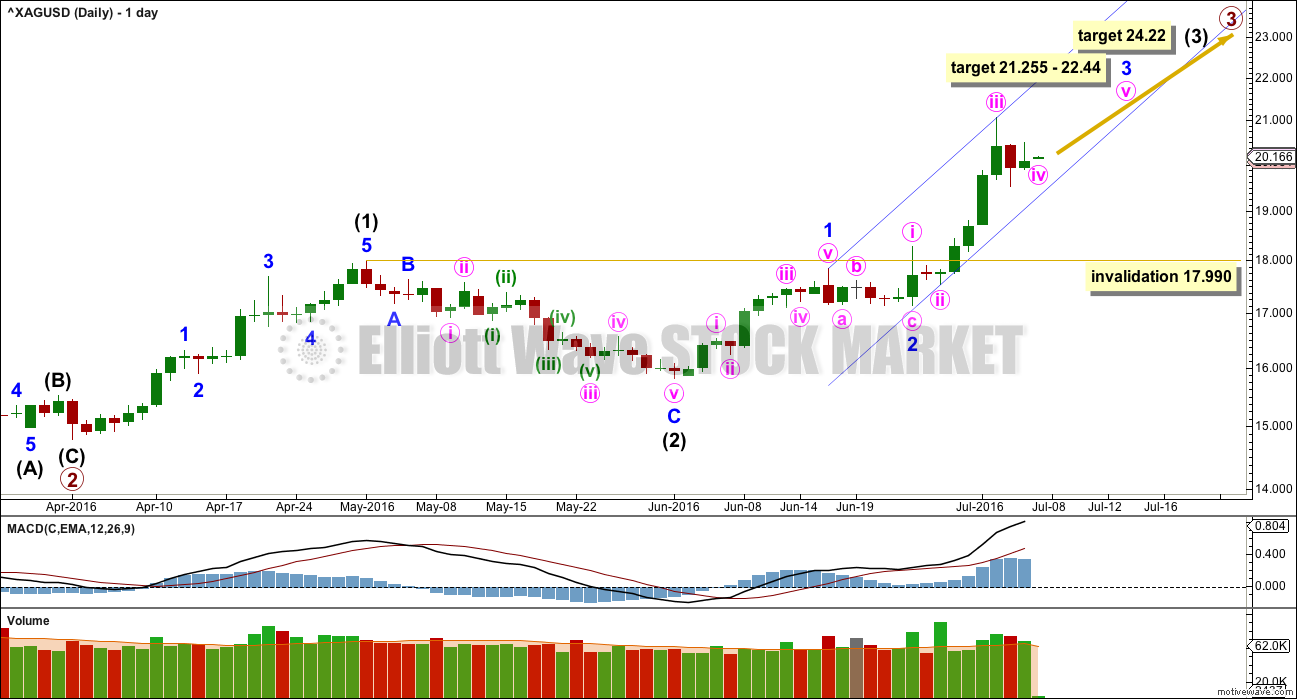
At 24.22 intermediate wave (3) would reach 2.618 the length of intermediate wave (1).
At 21.255 minute wave v would reach equality in length with minute wave i. At 22.44 minor wave 3 would reach 2.618 the length of minor wave 1. This gives a rather wide 1.185 target zone.
Within the impulse of minor wave 3, minute wave ii looks like a zigzag. So far it looks like minute wave iv is unfolding as a regular contracting triangle. The breakout should be upwards.
Intermediate wave (4), when it arrives, may not move into intermediate wave (1) below 17.990.
Add an acceleration channel to this upwards impulse: draw an acceleration channel from the end of minor wave 1 to the last high, then place a parallel copy on the low labelled minor wave 2. So far this channel neatly shows where downwards movement was finding support. Keep redrawing the channel as new highs are made. When minor wave 3 is complete, then the lower edge of the channel may show where minor wave 4 finds support.
If targets are wrong, they may not be high enough. Silver, like all commodities, has a tendency of swift strong fifth waves. They are not necessarily extended in price, but they often are. Look out for surprises to the upside for this market at this time; blowoff tops commonly occur at the ends of third waves.
TECHNICAL ANALYSIS
WEEKLY CHART
Click chart to enlarge. Chart courtesy of StockCharts.com.
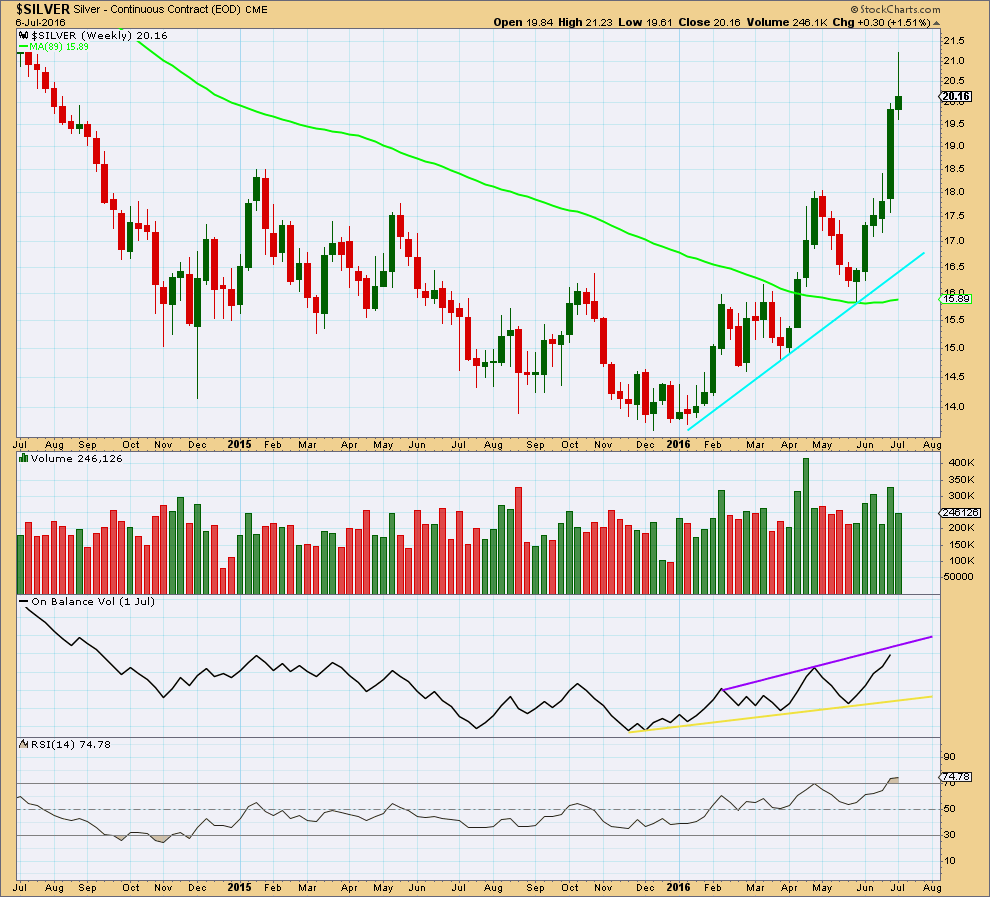
From the low in January, as price rises volume also rises and as price falls volume declines. The volume profile is bullish which supports the wave count.
A support line is added in cyan. If price again comes down to touch it, price should find strong support there.
Trend lines on On Balance Volume are redrawn. The upper purple line may now provide some resistance.
RSI is overbought but does not exhibit divergence with price. There is in indication of weakness at the weekly chart level at this stage.
DAILY CHART
Click chart to enlarge. Chart courtesy of StockCharts.com.
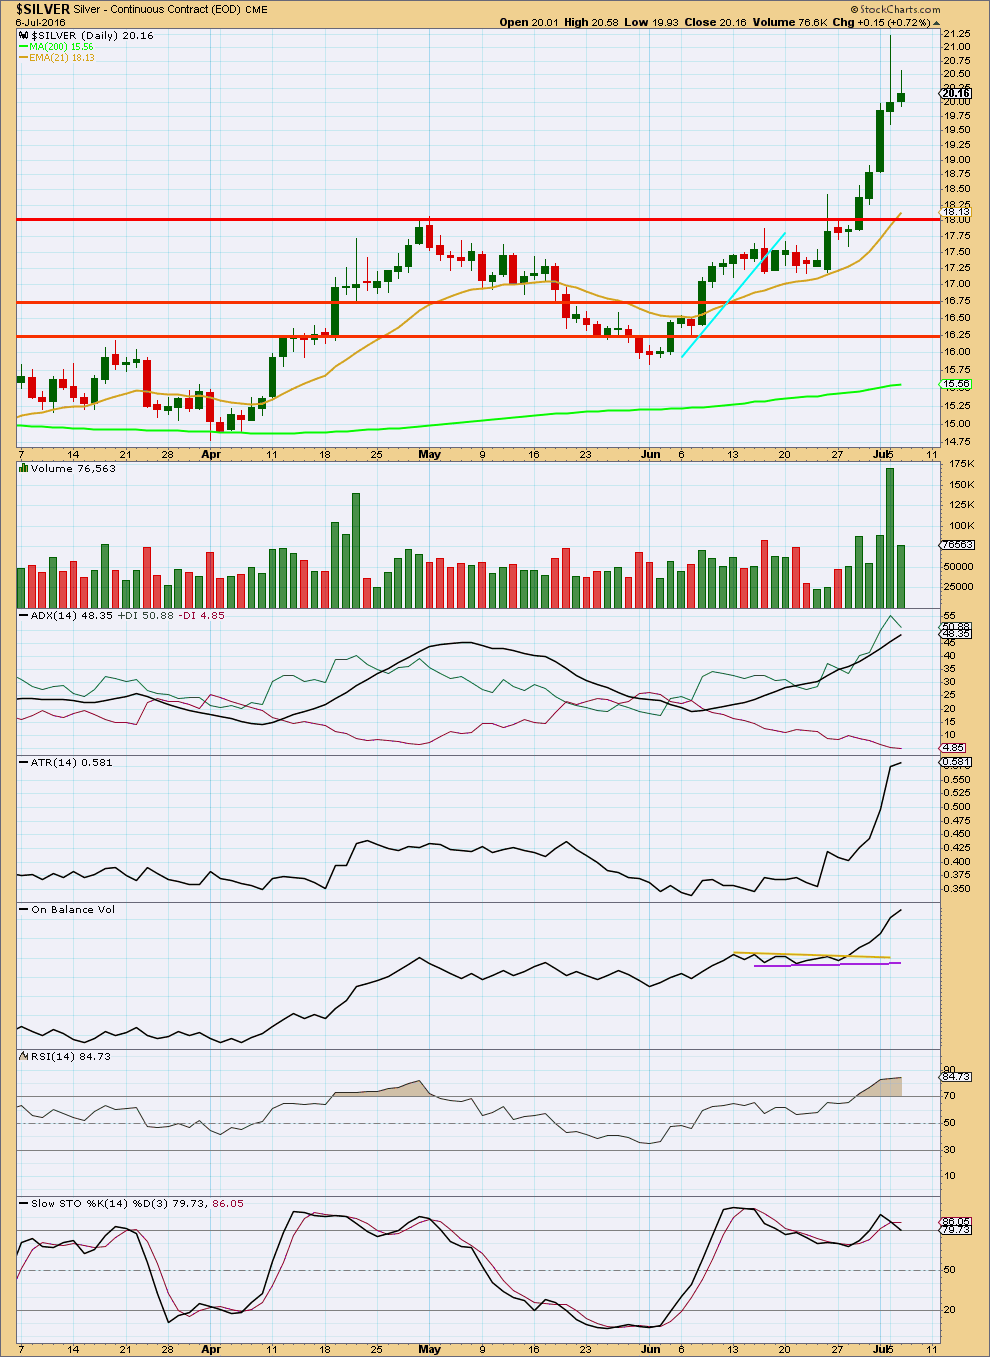
StockCharts volume data for the last few days differs from COMEX data. COMEX data comes directly from the Chicago exchange, so that will be used for volume analysis this week. Refer to volume bars on the daily Elliott wave count.
Volume increases as price rises. The rise in price is supported by volume still. So far with COMEX data it does not look like a blowoff top has arrived, so price may be expected to continue higher.
ADX is increasing, but it is extreme at above 48. If there is any sign of weakness from indicators or volume, then a larger correction may be expected. ADX still indicates an upwards trend is in place, but it may be near its end.
ATR agrees as it too is strongly increasing.
On Balance Volume at the daily chart level does not have any resistance.
RSI is also extreme but does not yet exhibit any divergence with price. If RSI does exhibit divergence, then a larger correction should be expected to begin.
There is divergence between price and Stochastics, but this is not the most reliable of indicators. Divergence with price and RSI would be more reliable. Divergence from Stochastics is a warning of a tiring trend only.
This analysis is published @ 02:54 a.m. EST.