
Last week’s analysis expected downwards movement as most likely.
Price continued higher.
Summary: The Elliott wave count at this stage is unclear. With price now within a B wave within a fourth wave correction, the multiple structural possibilities mean it is impossible to tell with any level of confidence what price may do next from an Elliott wave point of view. Classic technical analysis shows weakness to this upwards movement. There is strong resistance about 46.50. Some downwards reaction may be expected about now.
New updates to this analysis are in bold
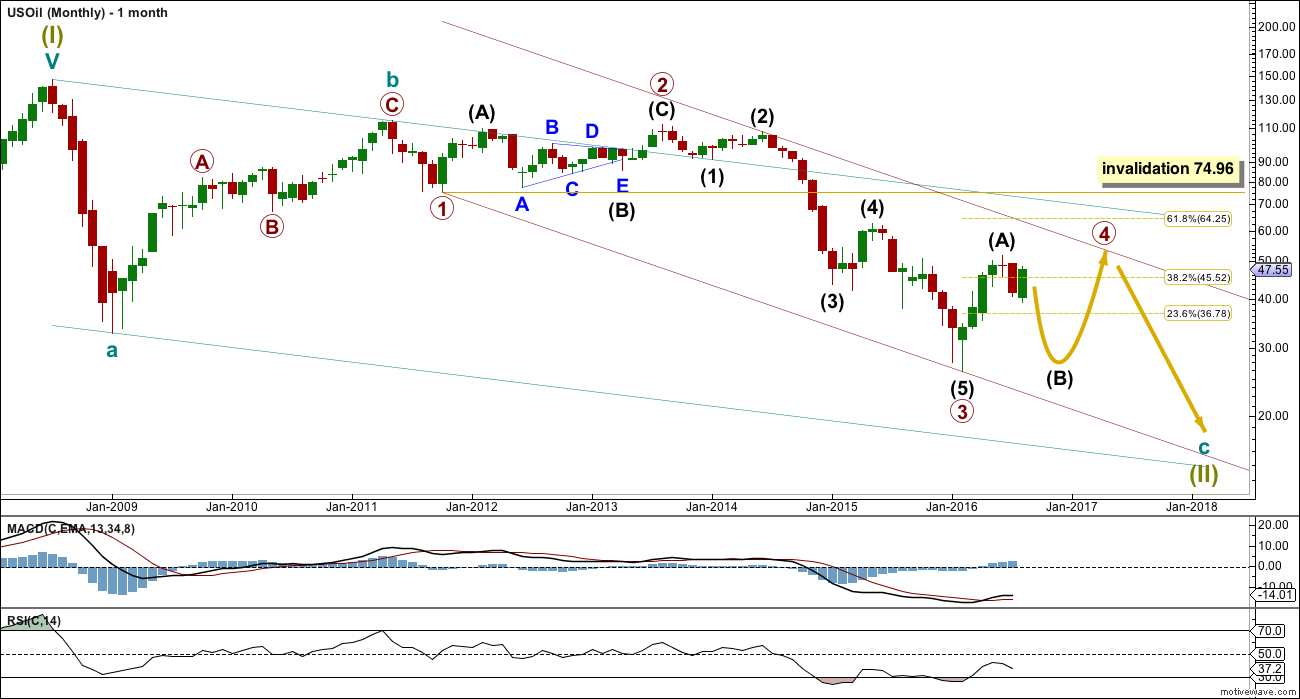
MONTHLY ELLIOTT WAVE COUNT
Click chart to enlarge.
Within the bear market, cycle wave b is seen as ending in May 2011. Thereafter, a five wave structure downwards for cycle wave c begins.
Primary wave 1 is a short impulse lasting five months. Primary wave 2 is a very deep 0.94 zigzag lasting 22 months. Primary wave 3 is a complete impulse with no Fibonacci ratio to primary wave 1. It lasted 30 months.
Primary wave 4 is likely to exhibit alternation with primary wave 2. Primary wave 4 is most likely to be a flat, combination or triangle. Within all of these types of structures, the first movement subdivides as a three.
Primary wave 4 is likely to end within the price territory of the fourth wave of one lesser degree; intermediate wave (4) has its range from 42.03 to 62.58.
Primary wave 4 may end if price comes up to touch the upper edge of the maroon channel. The upper edge of this channel has been pushed up to sit on the end of intermediate wave (2) within primary wave 3.
Primary wave 4 is most likely to be shallow to exhibit alternation in depth with primary wave 2. So far it has passed the 0.382 Fibonacci ratio at 45.52. It may now move mostly sideways in a large range.
Primary wave 4 may not move into primary wave 1 price territory above 74.96.
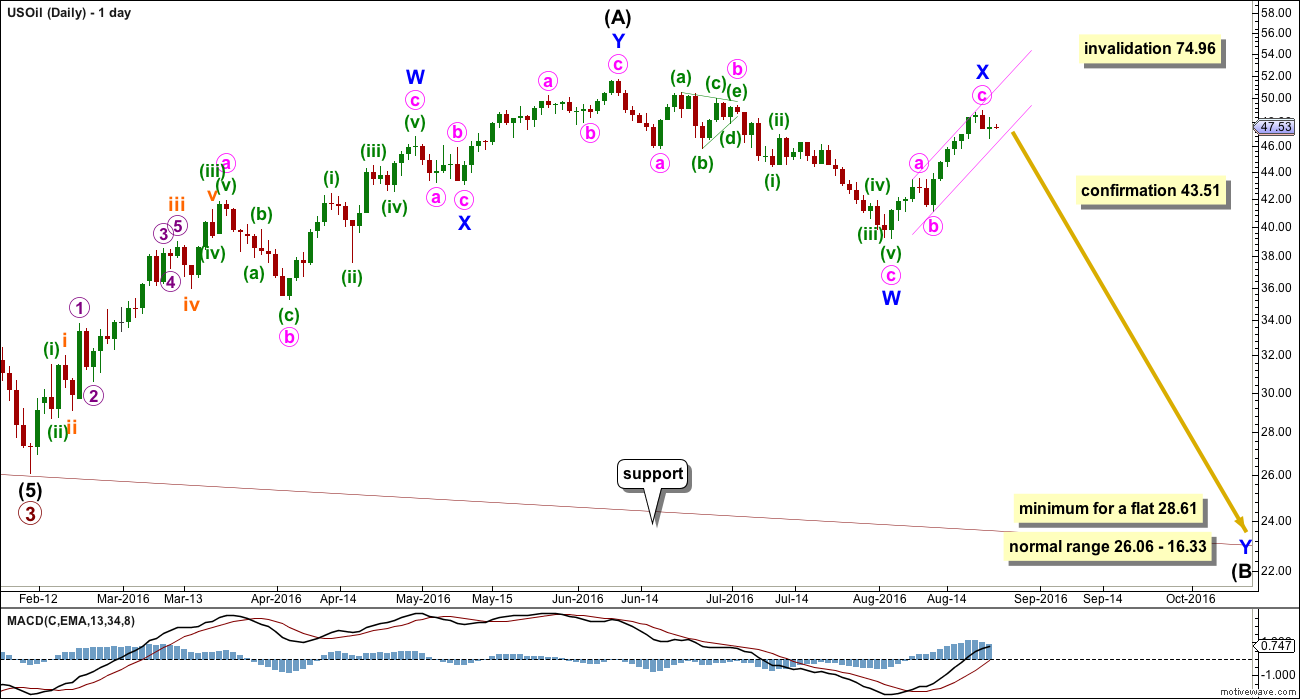
DAILY ELLIOTT WAVE COUNT
Click chart to enlarge.
Intermediate wave (A) may be complete as a double zigzag.
If intermediate wave (A) is a three, then intermediate wave (B) is most likely to be a very deep correction. It may make a new low below the start of intermediate wave (A) at 26.06.
If primary wave 4 is to be a flat correction, then intermediate wave (B) must be a minimum 0.9 length of intermediate wave (A) at 28.61. The normal range for intermediate wave (B) would be 1 to 1.38 the length of intermediate wave (A) at 26.06 to 16.33.
If primary wave 4 is to be an expanded flat correction, then intermediate wave (B) should be 1.05 the length of intermediate wave (A) or longer, at 24.78.
If primary wave 4 is to be a triangle, then intermediate wave (B) has no minimum nor maximum. It must only subdivide as a three wave structure. It may make a new low below the start of intermediate wave (A) at 26.06 as in a running triangle.
Primary wave 4 may not move into primary wave 1 price territory above 74.96.
Intermediate wave (B) may be any of more than 23 possible corrective structures. It would most likely be a single or multiple zigzag in order to be a deep correction. It may also be an expanded flat to be deep. It may find support at the lower edge of the maroon channel.
So far intermediate wave (B) looks most likely to be unfolding as a double zigzag. The upwards wave labelled minor wave X looks to be complete and was less than 0.9 the length of minor wave W. The minimum requirement for a flat correction was not met, so a double zigzag may be the reason for this.
A small narrow channel is drawn about minor wave X. When price clearly breaks below the lower edge of this channel it would indicate upwards movement is over for now and the next wave down should be underway. While price remains within the channel it is possible support at the lower edge may bounce price upwards.
A new low below 43.51 would invalidate both alternates below and provide some confidence that a new downwards wave has begun.
The second zigzag in the double would be required to deepen the correction to 28.61 or below.
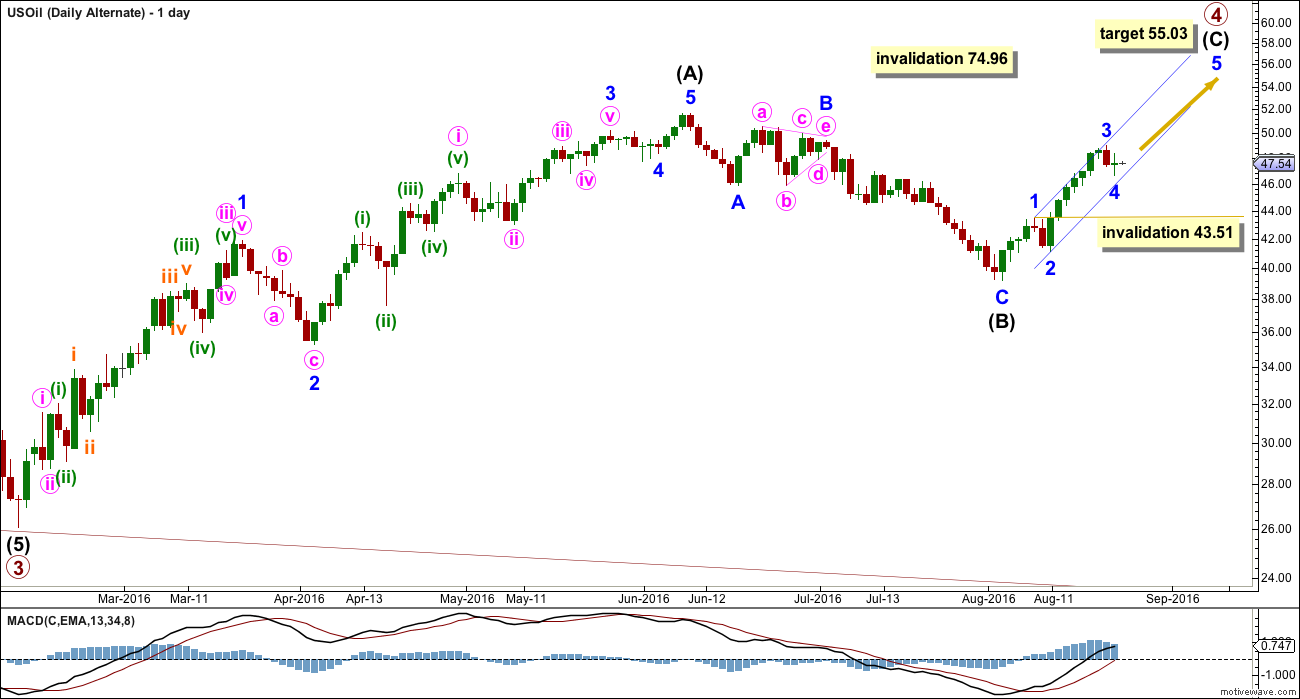
FIRST ALTERNATE DAILY ELLIOTT WAVE COUNT
Click chart to enlarge.
Primary wave 4 may be unfolding as a zigzag. This wave count is possible, and all possibilities must be considered, but because it would see no alternation in structure with the zigzag of intermediate wave (2) it has a lower probability than the main wave count.
Intermediate wave (C) must subdivide as a five wave structure. So far, within intermediate wave (C), minor waves 1, 2 and now 3 may be complete. Minor wave 4 may not move into minor wave 1 price territory below 43.51.
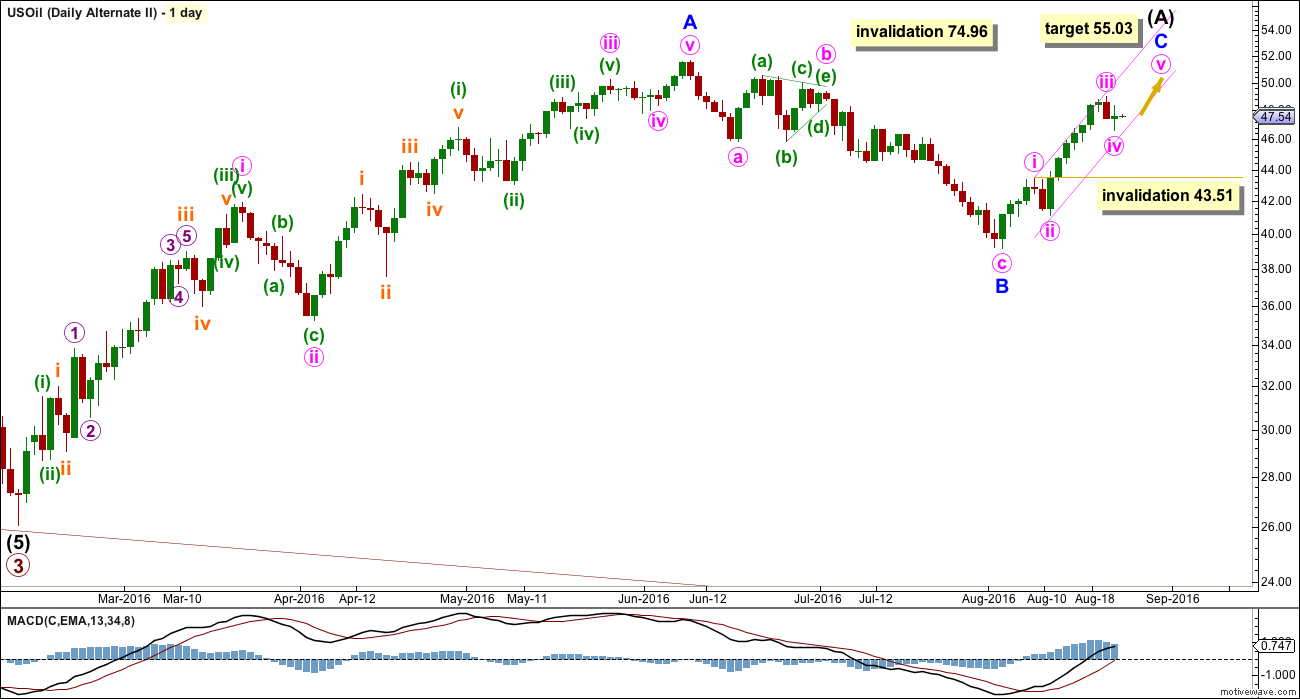
SECOND ALTERNATE DAILY ELLIOTT WAVE COUNT
Click chart to enlarge.
This wave count is the same as the first alternate but the degree of labelling within the correction so far is moved down one degree.
It may be more likely (than the first alternate) that a zigzag is completing for intermediate wave (A) within primary wave 4.
This may be a zigzag for intermediate wave (A) within a larger flat or triangle for primary wave 4.
Within minor wave C, minute waves i, ii and now iii may be complete. Minute wave iv may not move into minute wave i price territory below 43.51.
At 55.03 minor wave C would reach 0.618 the length of minor wave A.
Primary wave 4 may not move into primary wave 1 price territory above 74.96.
TECHNICAL ANALYSIS
DAILY CHART
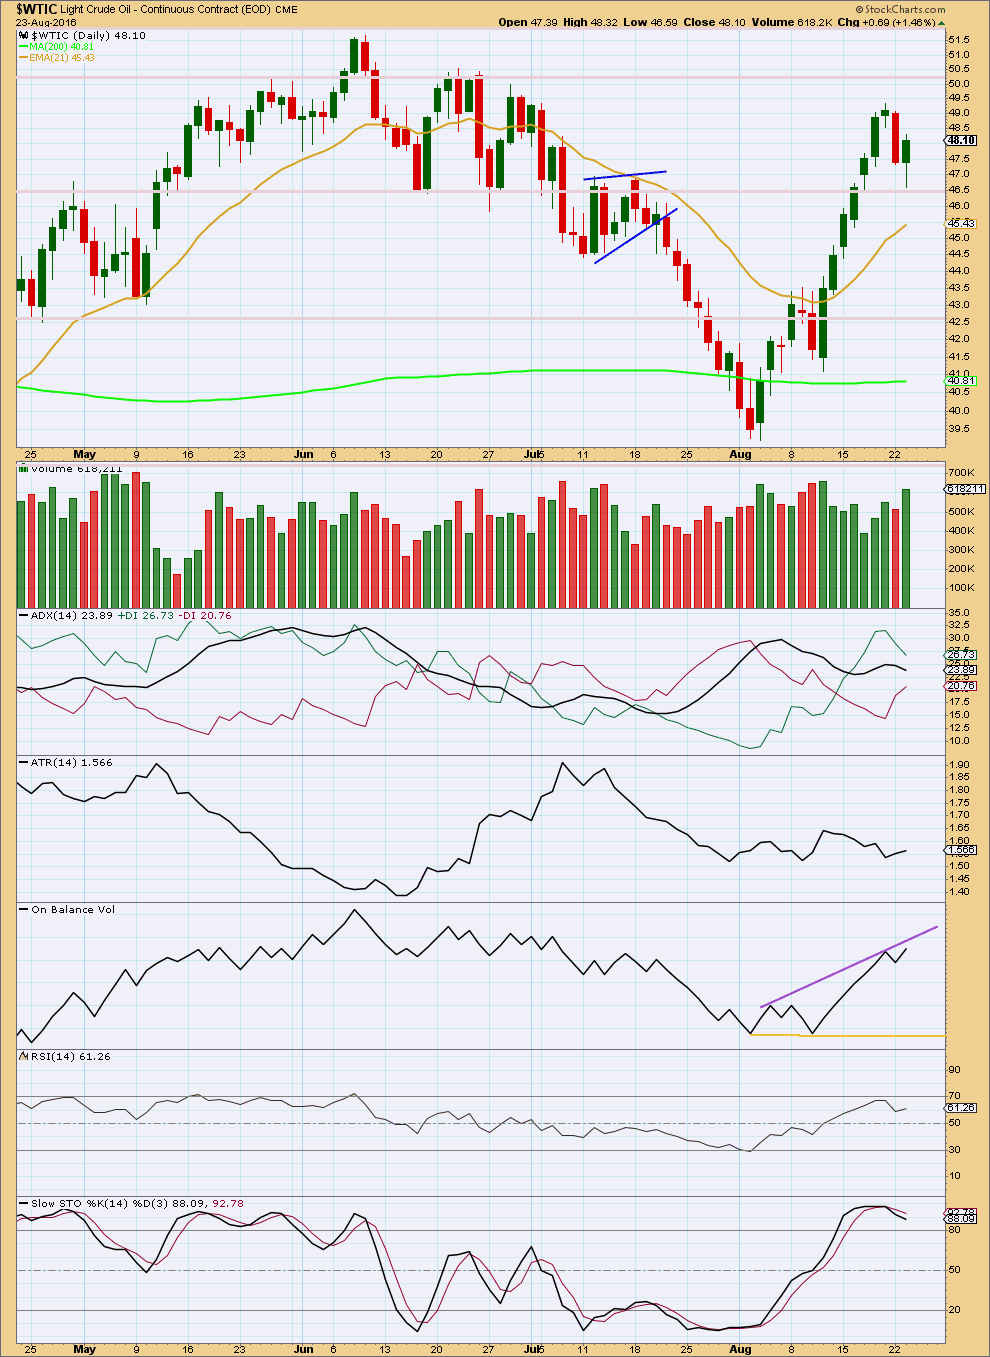
Click chart to enlarge. Chart courtesy of StockCharts.com.
The candlestick for 22nd of August completes an Evening Star and a Bearish Engulfing pattern. The Bearish Engulfing pattern is the strongest reversal pattern. After a clear upwards trend, this pattern indicates a trend change from up to either down or sideways.
The pattern is not supported by volume though; that slightly weakens it. Now an upwards day follows with a long lower wick and stronger volume. There is still support for rising price from volume.
Volume and the candlestick patterns are giving conflicting signals.
Price may have found some support about 46.50.
ADX is declining, indicating no clear trend at this time. ATR is overall flat, mostly in agreement with ADX.
On Balance Volume is showing short term bearish divergence with price: OBV has made a new high for the last session, but price has not. This indicates some weakness in price.
RSI is not extreme. There is room for price to rise or fall. There is no divergence between price and RSI to indicate weakness.
Stochastics is overbought. With ADX indicating no clear trend at this time, it should be assumed that the market is consolidating. A downwards swing about there would be expected to continue until price finds support and Stochastics reaches oversold at the same time. The next line for price to find support may be about 42.60.
This analysis is published @ 01:43 a.m. EST.