Upwards movement was expected from yesterday’s Elliott wave count, but again has not happened.
Summary: Upwards movement is still expected. The weight of evidence still indicates a longer term upwards trend is in place. The short term target is at 1,440. The long term target remains at 1,585. Risk must remain at 1,302.93.
New updates to this analysis are in bold.
Last weekly charts are here.
Grand SuperCycle analysis is here.
DAILY ELLIOTT WAVE COUNT
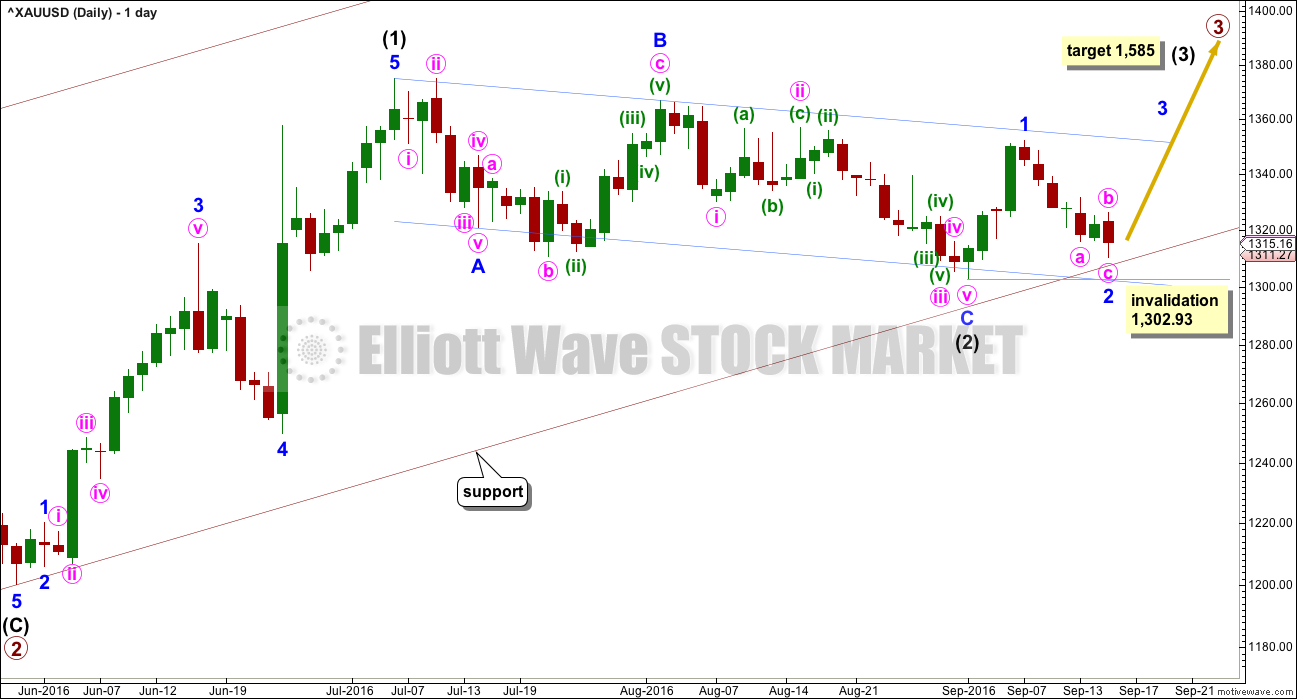
Primary waves 1 and 2 are complete. Thereafter, this wave count differs from the alternate.
This main wave count will expect primary wave 3 to be longer than primary wave 1. Because this is very common, this is the main wave count. It expects the most common scenario is most likely. At 1,585 intermediate wave (3) would reach 1.618 the length of intermediate wave (1).
Intermediate wave (2) may now be complete ending just below the 0.382 Fibonacci ratio of intermediate wave (1) and lasting 40 days. Within intermediate wave (3), minor wave 2 may not move beyond the start of minor wave 1 below 1,302.93.
Draw a channel about intermediate wave (2) using Elliott’s technique for a correction (blue lines). Price is finding some resistance on the way up about the upper edge. After breaking through resistance at the upper blue line price may then turn down to find support about there.
With this wave count expecting a third wave at two large degrees to begin, look out for surprises to the upside at this stage.
Intermediate wave (1) lasted 27 days and intermediate wave (2) lasted 40 days. Intermediate wave (3) may be reasonably expected to last longer than intermediate wave (1) in both time and price. A Fibonacci 55 days would be a first expectation.
HOURLY ELLIOTT WAVE COUNT – DETAIL
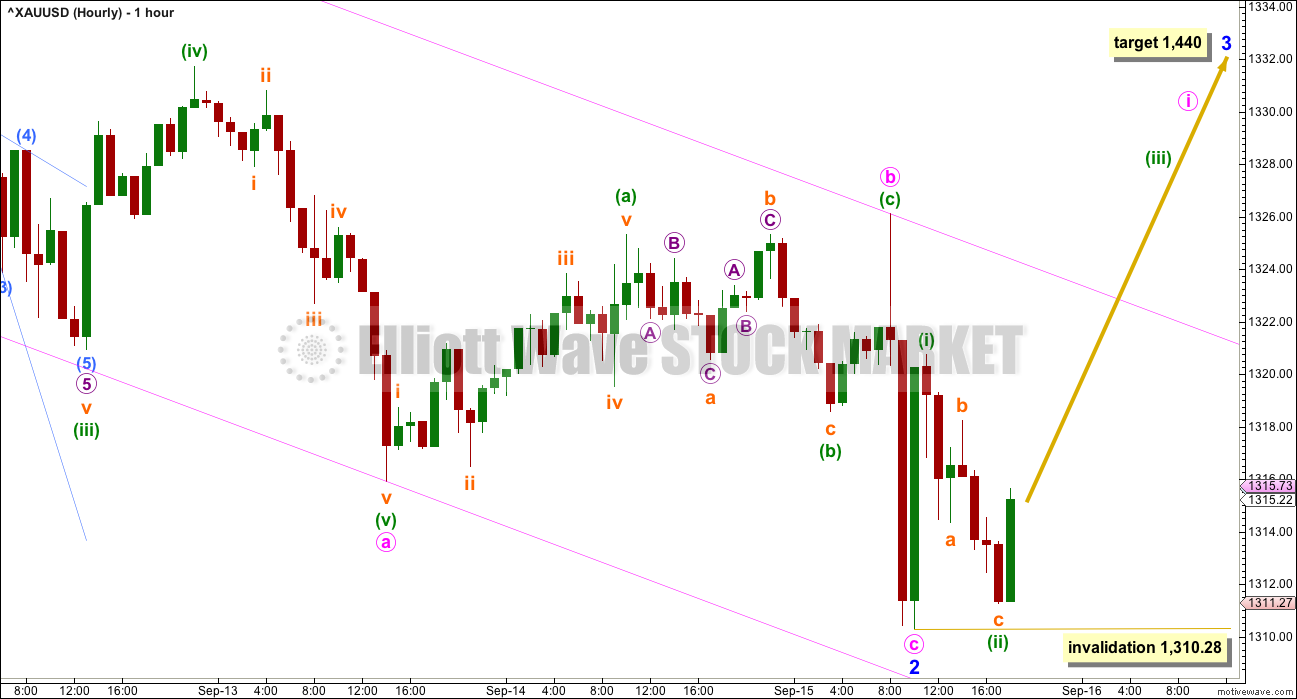
Two hourly charts will be provided today. This first hourly chart shows the whole detail of minor wave 2.
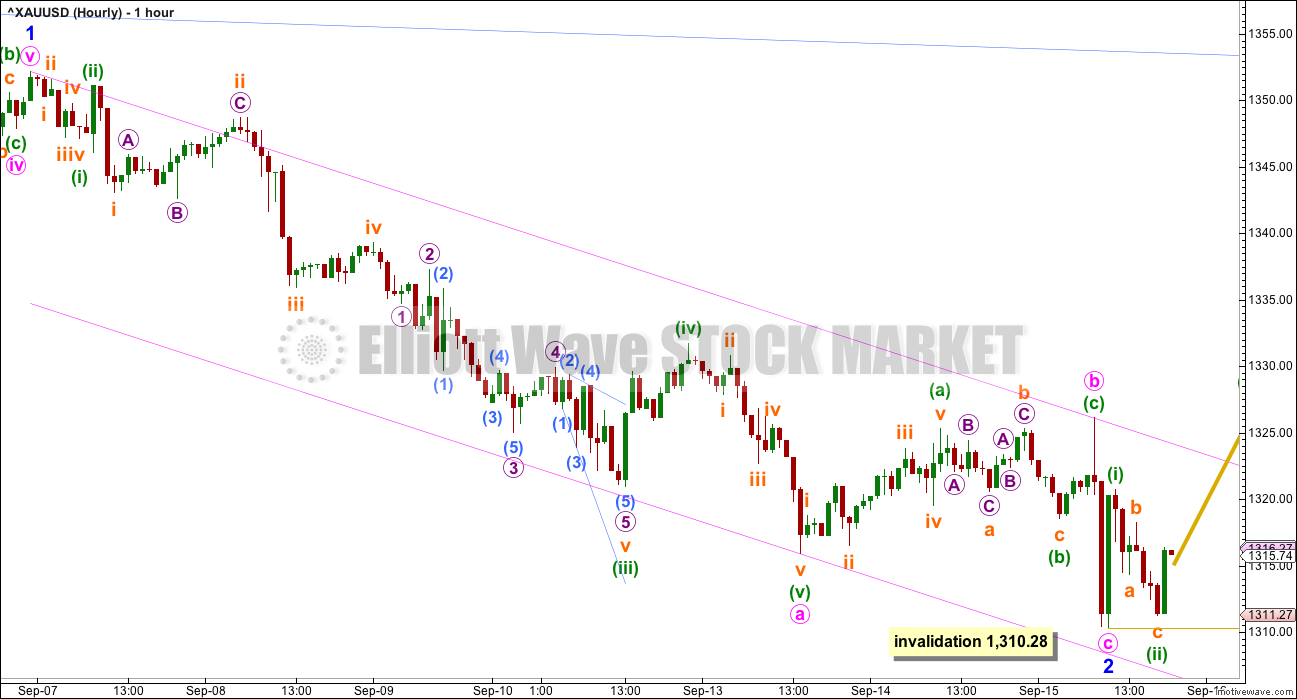
The material change today, which then flows on to see minute wave a ending lower, is the small ending diagonal of micro wave 5 within subminuette wave v within minuette wave (iii). If this diagonal ended at the low as labelled, and not the small prior swing low four hours earlier, then the last low for 13th of September is only the end of minute wave a and not minor wave 2 in its entirety.
Within minor wave 2, there is still no Fibonacci ratio between minute waves a and c.
Ratios within minute wave a are: there is no Fibonacci ratio between minuette waves (i) and (iii), and minuette wave (v) no longer has a Fibonacci ratio to either of minuette waves (i) or (iii).
Draw a channel about minor wave 2 using Elliott’s technique. When price breaks above the upper edge, that shall provide trend channel confirmation of a trend change.
At this stage, a new high above 1,326.11 would provide some price confidence in a trend change. At that stage, upwards movement could not be a second wave correction within minute wave c, so minute wave c would have to be over. This would also necessitate a breach of the channel.
HOURLY ELLIOTT WAVE COUNT
So far within upwards movement from the low for Thursday’s session a five wave impulse upwards may be complete and a deep three wave structure downwards is complete. This may be minuette waves (i) and (ii).
At 1,440 minor wave 3 would reach 2.618 the length of minor wave 1.
Within minor wave 3, minute wave ii yet to come may not move beyond the start of minute wave i below 1,310.28.
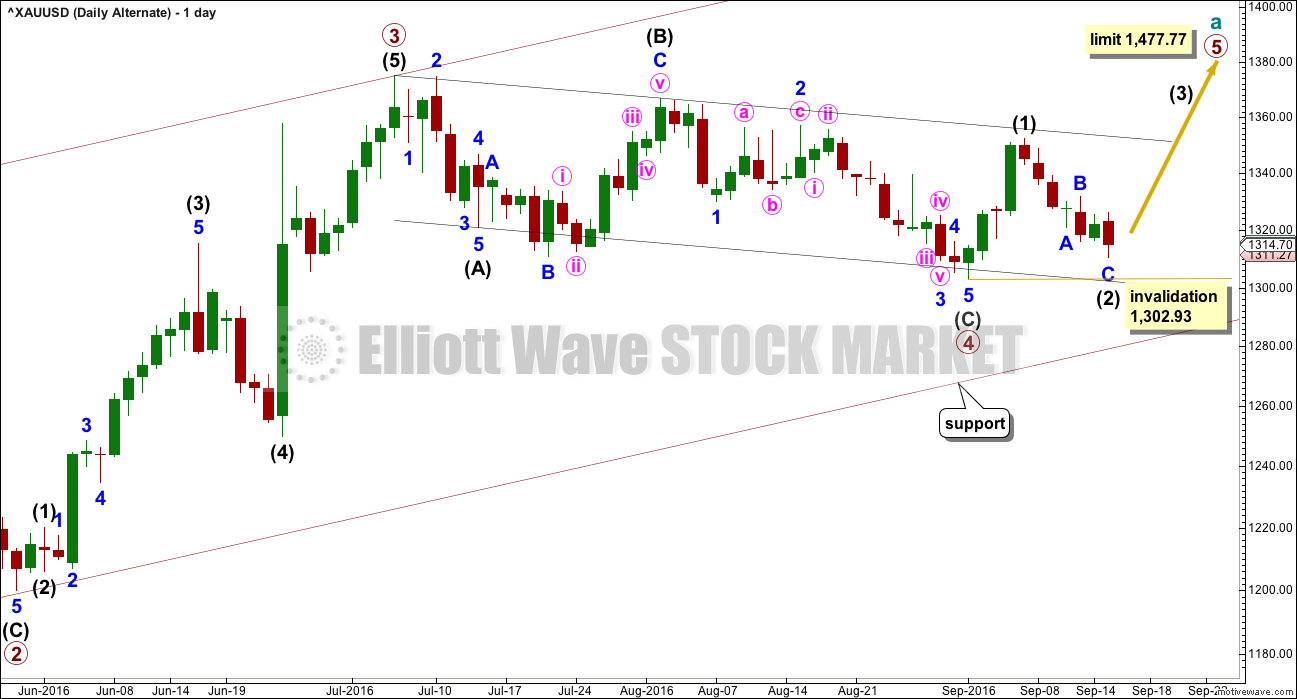
ALTERNATE DAILY ELLIOTT WAVE COUNT
It is possible that primary wave 3 is over and shorter than primary wave 1. Primary wave 3 shows stronger volume than primary wave 1 (see technical analysis weekly chart).
If primary wave 3 is over, then the current consolidation for Gold would be primary wave 4.
Primary wave 2 was a relatively shallow 0.35 expanded flat correction. Primary wave 4 may be a deeper zigzag which would exhibit perfect alternation.
Within primary wave 5, no second wave correction may move beyond the start of its first wave below 1,302.93.
Primary wave 5 would be limited to no longer than equality in length with primary wave 3, so that the core Elliott wave rule stating a third wave may not be the shortest is met. Primary wave 5 would have a limit at 1,477.77.
The hourly chart would be exactly the same.
TECHNICAL ANALYSIS
WEEKLY CHART
Click chart to enlarge. Chart courtesy of StockCharts.com.
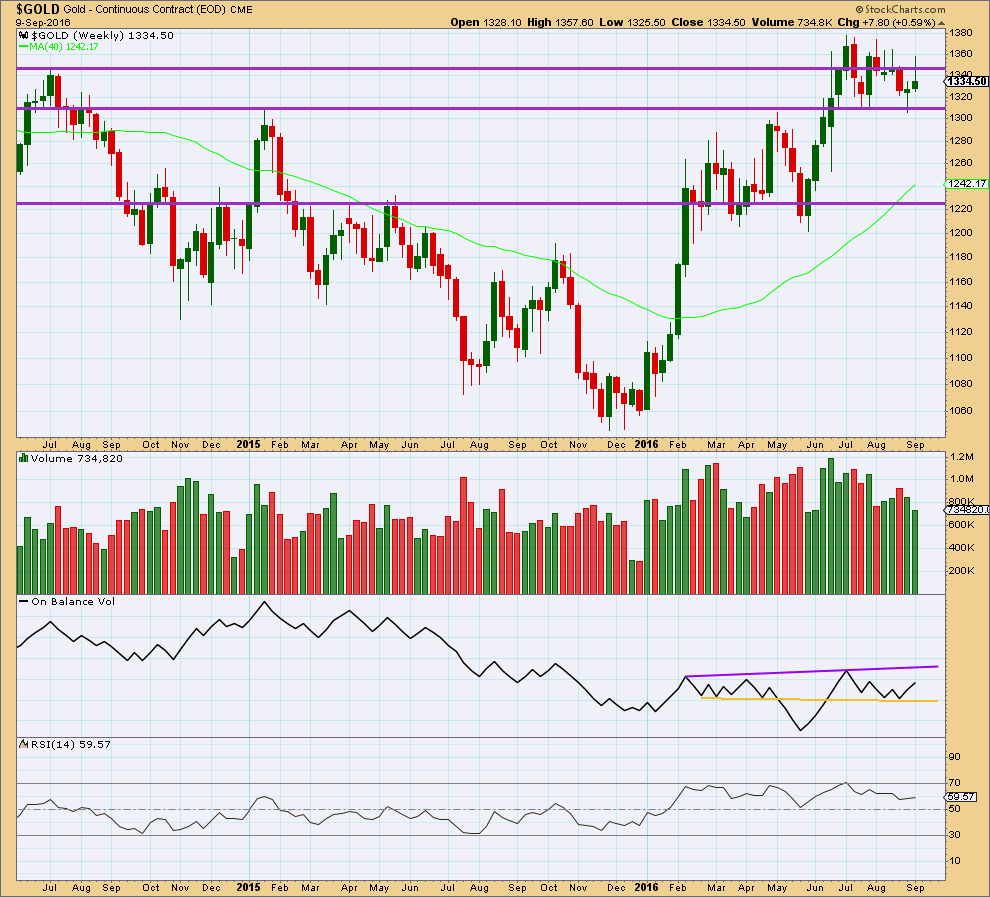
Last week moved price reasonably higher, but as yet now a new high above 1st August or 5th July has been made. The green candlestick colour is bullish, but the long upper wick is bearish. The decline in volume for an overall upwards week is bearish, but to understand what is exactly happening in terms of volume it needs to be looked inside at daily volume bars.
On Balance Volume remains bullish with an upwards move further away from the yellow support line.
RSI is still not extreme. There is room for price to rise or fall.
DAILY CHART
Click chart to enlarge. Chart courtesy of StockCharts.com.
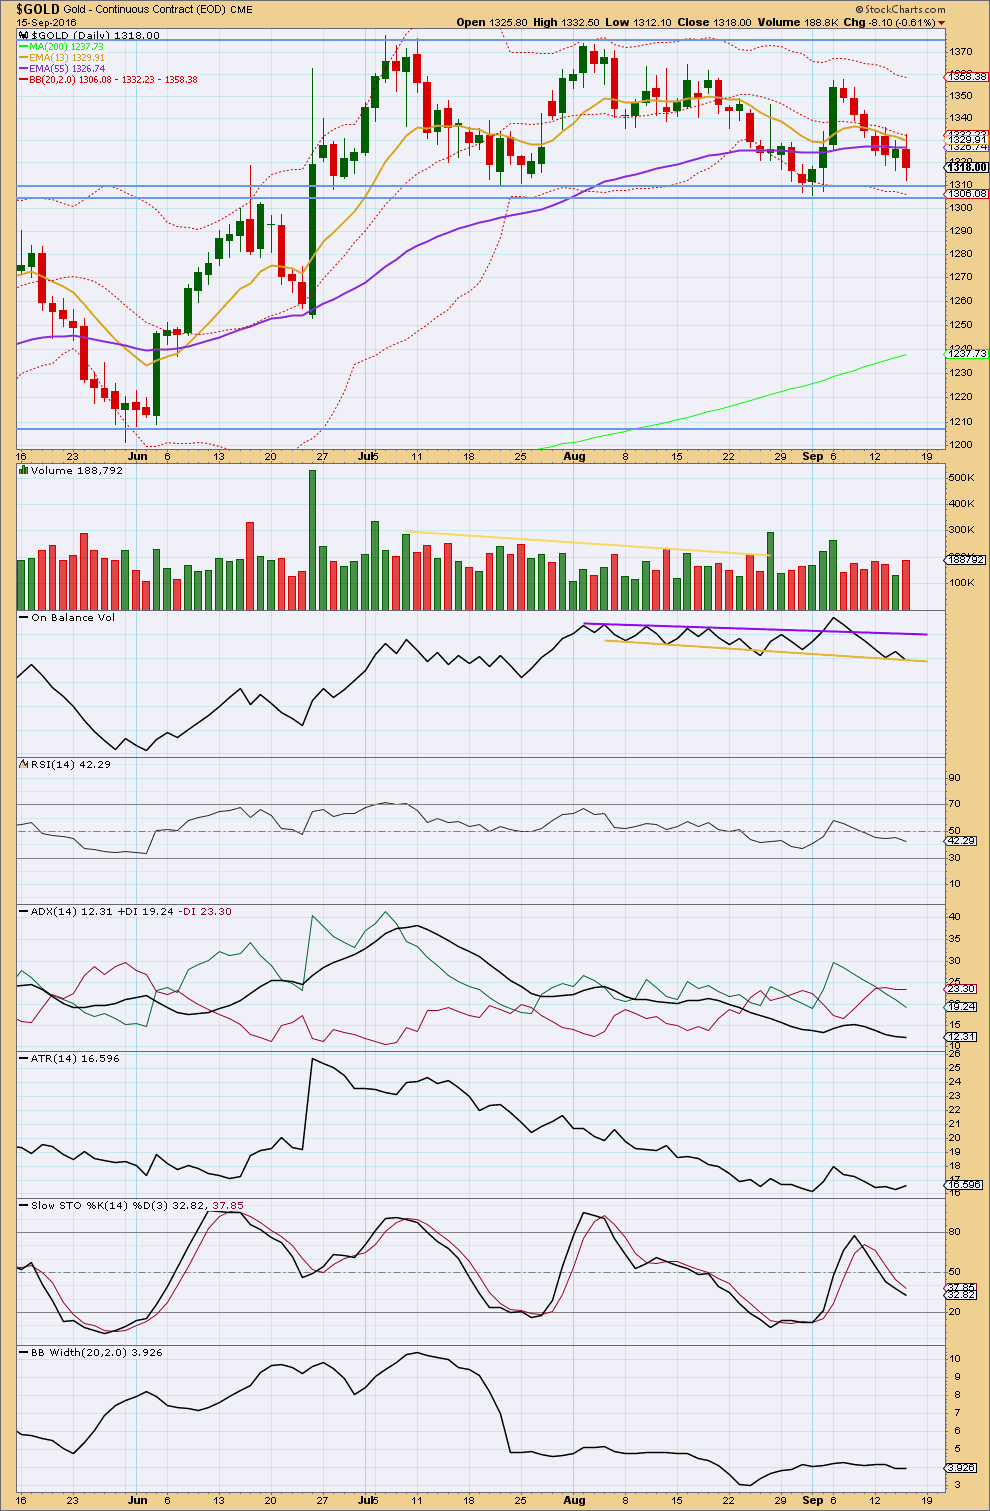
Price is now again very close to support about 1,310 to 1,305. Thursday’s downwards session comes with strongest volume for the whole downward movement, but volume for all downwards days is still substantially lighter than prior upwards days. in the short term, the increase in volume today indicates there is still a risk that price may not yet of bottomed and may continue a little lower. If it does, then very strong support should be expected at 1,310 and finally at 1,305.
On Balance Volume is still at support at the yellow trend line. This has so far held, so it is reasonable to expect it is most likely to continue to hold. This line is shallow, reasonably long held and repeatedly tested. It is not exactly clear though how this line should be drawn; there is a little leeway in the slope. This may allow for a very little more downwards movement before OBV turns up. Again, like price providing support close by, OBV indicates that downwards movement is limited.
ADX at 12.31 is lower than yesterday at 12.52, so it is still declining. ADX is indicating that this market is not trending. ATR overall still agrees because it is still flat to declining and is very low. Bollinger Bands are still tightly contracted. With all three of these indicators still in agreement that the market is not trending, it is reasonable to conclude still that this downwards movement is a counter trend movement and will end when price finds support.
RSI is below neutral. There is plenty of room for price to rise or fall. There is still no divergence between price and RSI to indicate any weakness.
The bottom line is the market is consolidating. It is range bound with resistance at 1,375 and support at 1,310 – 1,305. During the consolidation, it remains three upwards days which have strongest volume. This strongly suggests an upwards breakout is more likely than downwards.
The 200 day moving average remains pointing upwards. Price remains above it. The mid term Fibonacci 55 day moving average is also still pointing upwards and it remains above the long term average. The short term Fibonacci 13 day moving average is pointing lower, but remains above the mid and long term averages. These averages so far indicate the longer term trend remains upwards and that downwards movement is a counter trend movement.
Assume the trend remains the same until proven otherwise. At this stage, the weight of evidence points to the longer term trend remaining upwards.
This analysis is published @ 08:22 p.m. EST.

Risk is still at 1,302.
At this stage I cannot now see minute wave c as complete, if it begins at the same place. Neither an impulse nor ending diagonal fit into this new low.
So the conclusion so far is that price may move a little lower still before turning.
What i understand is market havent fooled traders yet. It will give some shock to the buyers to exit ther longs,its just my thought. What i see that due to so much of shouts all around n hawkish statements given by FOMC members and also strong firing by opposition on FOMC. It is poised for a rate hike in september. So now i have a strong feeling that if laras count is right than expect the market to rally anytime now or on monday for its minute 1 with a target around 1340 odd levels and than shocking event on wednesday will trigger minute 2. Rate hike is not important the comments after that is much more important and i believe that the comment from yellen will just be a preponed rate hike. Not much expectation of Dec rate hike. This will actually be a fundamentally positive news for gold..
Just a thought.
Thank you
Anyone else seeing issue with TD Waterhouse option quotes no bid/ask showing for anything you want to sell…
Gold dropped to 1308+.
9/14 Alan: “The strong move down (currently 1310.06 low) would be minuette 5 of minute c of Minor 2. Right now, the drop is likely to be not be over yet. At 0.886 retrace, my target is 1308.25.
If correct, the strong move up in Minor 3 should start once the drop is complete.”
Hopefully minor wave 2 is over now. !!!!!!!!
I’m just not sure Minor 2 is over. Potential bear flag forming on the 5 minute. In addition, gold will typically bounce once it reaches support. I haven’t seen the bounce. However, it may touch the 1308 level one more time before taking off… typical habits. I just don’t know.
Yesterday, GDX, JNUG, and NUGT were saved by a strong market while gold went down. However, today, we may have the market going down. Combine this with gold going down and it could lead to steep declines.
I’m currently in NUGT and hoping Alan could be like Froze Zone and find his hero costume to provide us with some valuable insight for the day today.
Gold Weekly Consolidation with bull flag.
Once gold crosses above near term Lara’s target gold is going higher to wave 3 target.
Nice chart. Expect breakout of upper rail by month end.
Confident analysis lara
Thank you. The concern now is FOMC. I know you dont entertain these news but sometimes they do effect a lot. TA is solidly bullish for the medium to long term. But somewhere the next FOMC is scaring the bulls. We can see in another way that the wave 3 is actually playing its game. Almost everyother person on the street is starting to believe that gold will have a fall now. Lets see how it goes. I believe that a rise in int rate will actually lift the price of gold.
Those news releases see a spike in volatility, and it often turns up as a third wave. Or for commodities it may also be a fifth wave.
So if there’s another five up, three down complete just before FOMC then I’d be looking out for a spike up.
There is still risk to the downside though at 1,302.
Very low odds of a rate increase due to current economic statistics and the Fed doesn’t want to be accused of “influencing” the election. There will be volatility as always.
Completely agree Dreamer, I suspect no rate hike prior to elections. How about after ,Trump has been quite critical of the fed from what I’ve seen.
GDX is still consolidating and there may be some subtle signs of an upward move:
> RSI consolidating below 50; breakout pending
> Price is consolidating in a triangle form; an upwards break may be starting
> Volume today was slightly higher on an up day although the overall daily volume profile is mixed. The weekly volume is more bullish, clearly showing higher volume on up weeks since the first of the year
> OBV has turned up at support although there is resistance not far above
> MFI shows accumulation an is moving up
The trend is up until proven otherwise
IMO Gold price is weak below pivot, may likely look to rally, don’t expect for Gold price to get to test 1325+, expecting more likely a break below 1309…. GL all~!