Last analysis expected a small sideways correction to unfold and remain above 1,327.30.
Price has moved lower in a small range, which fits expectations.
Summary: Look out now for surprises to the upside. A small sideways correction may complete about 1,338, remaining above 1,327.30. When the correction is done, another wave upwards should be about 24 in length. The long term target for the Elliott wave count for a third wave to end is at 1,585.
New updates to this analysis are in bold.
Last weekly charts are here.
Grand SuperCycle analysis is here.
DAILY ELLIOTT WAVE COUNT
Primary waves 1 and 2 are complete. Thereafter, this wave count differs from the two alternates.
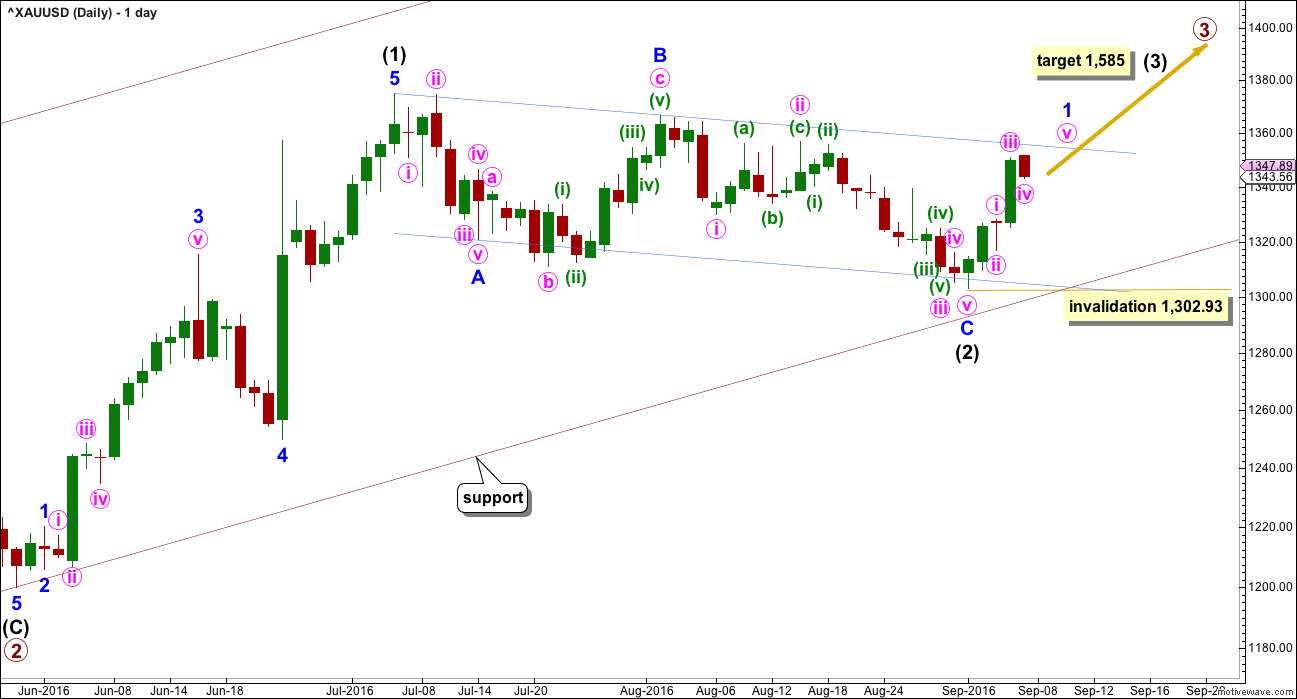
This main wave count will expect primary wave 3 to be longer than primary wave 1. Because this is very common, this is the main wave count. It expects the most common scenario is most likely. At 1,585 intermediate wave (3) would reach 1.618 the length of intermediate wave (1).
Intermediate wave (2) may now be complete ending just below the 0.382 Fibonacci ratio of intermediate wave (1) and lasting 40 days. Within intermediate wave (3), the upcoming correction for minor wave 2 may not move beyond the start of minor wave 1 below 1,302.93.
Draw a channel about intermediate wave (2) using Elliott’s technique for a correction (blue lines). Price may find some resistance on the way up about the upper edge.
With this wave count expecting a third wave at two large degrees to begin, look out for surprises to the upside at this stage.
Intermediate wave (1) lasted 27 days and intermediate wave (2) lasted 40 days. Intermediate wave (3) may be reasonably expected to last longer than intermediate wave (1) in both time and price. A Fibonacci 55 days would be a first expectation.
HOURLY ELLIOTT WAVE COUNT
Minor wave 1 is unfolding as a more common impulse.
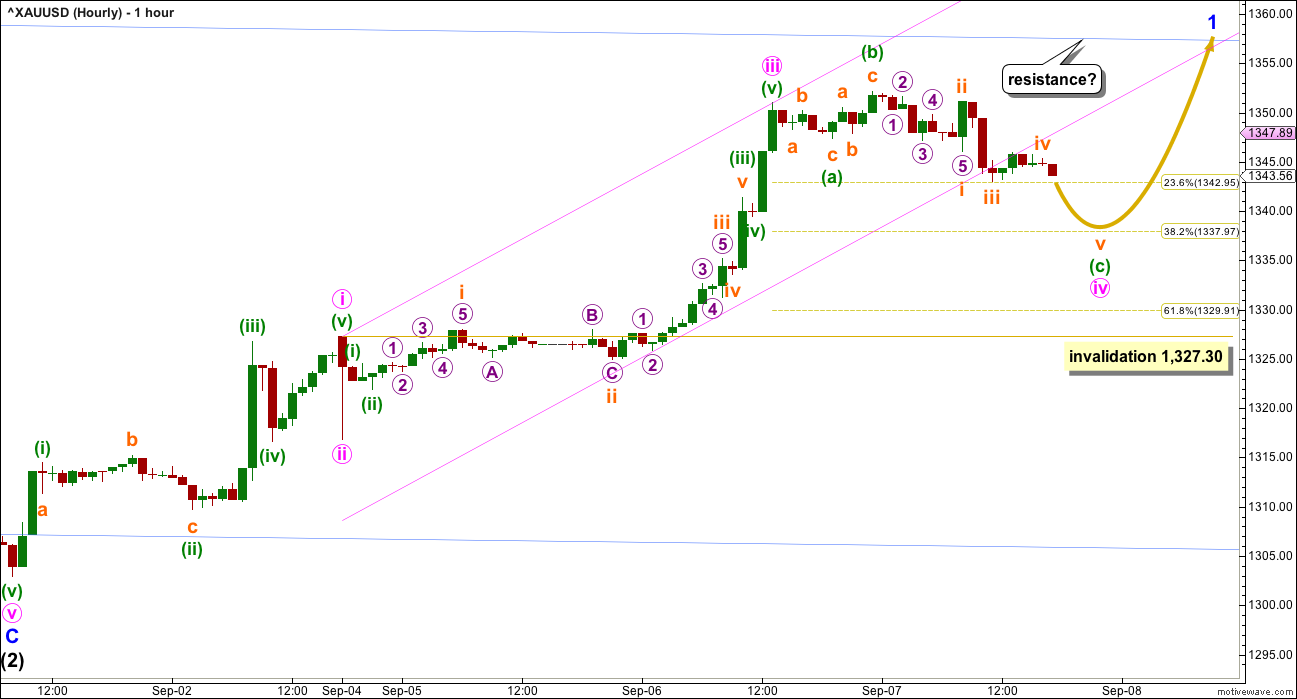
Within minor wave 1, so far minute waves i, ii and iii are complete. Minute wave iv is close to completion. There is no Fibonacci ratio between minute waves i and iii, so it is more likely that minute wave v will exhibit a Fibonacci ratio to either of minute waves i or iii. The most common ratio for a fifth wave is equality in length with the first wave, so minute wave v would most likely be 24.37 in length.
Minute wave ii was a quick shallow 0.43 zigzag. Minute wave iv is exhibiting some alternation as an expanded flat, but the depth may not exhibit alternation. Minute wave iv may end close to the 0.382 Fibonacci ratio about 1,338.
Minute wave iv may not move into minute wave i price territory below 1,327.30.
When minute wave iv is complete, then minute wave v should move at least slightly above the end of minute wave iii at 1,351 to avoid a truncation.
When a five wave impulse upwards is complete for minor wave 1, then a multi day correction for minor wave 2 should unfold. It may be relatively deep. Minor wave 2 should offer a good opportunity to join the trend at a good price.
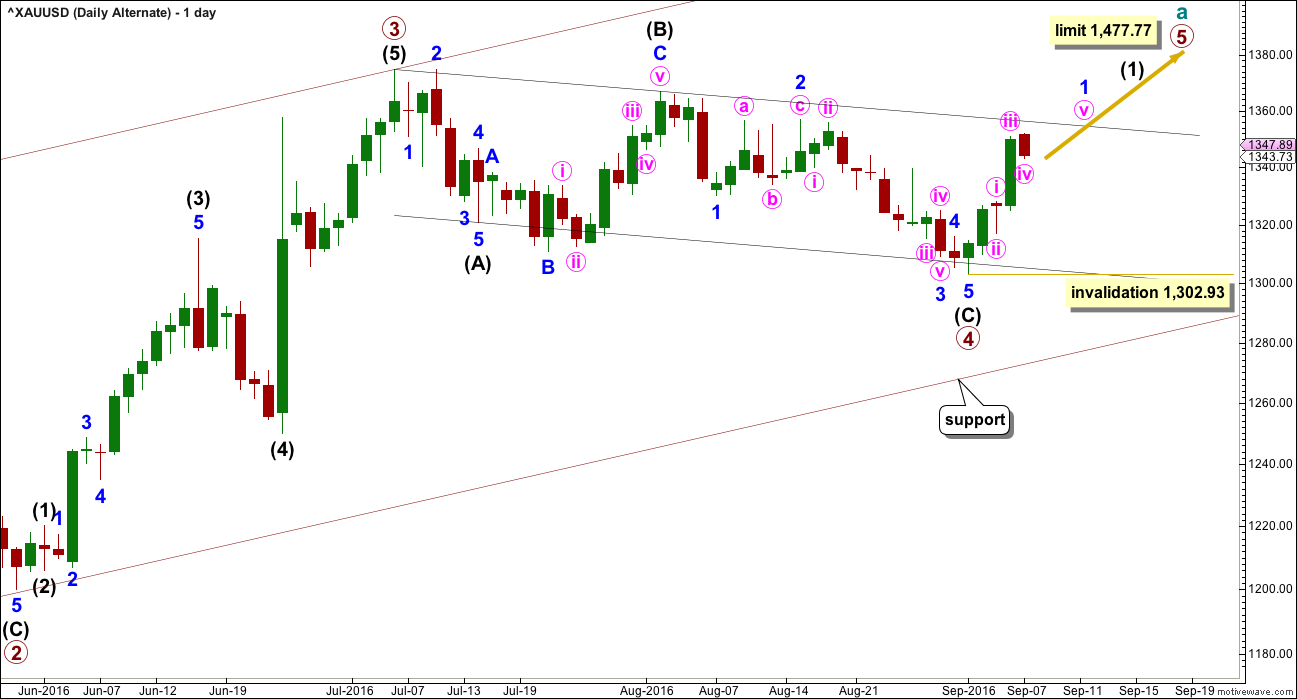
ALTERNATE DAILY ELLIOTT WAVE COUNT
It is possible that primary wave 3 is over and shorter than primary wave 1. Primary wave 3 shows stronger volume than primary wave 1 (see technical analysis weekly chart).
If primary wave 3 is over, then the current consolidation for Gold would be primary wave 4.
Primary wave 2 was a relatively shallow 0.35 expanded flat correction. Primary wave 4 may be unfolding as a deeper zigzag which would exhibit perfect alternation.
Within primary wave 5, no second wave correction may move beyond the start of its first wave below 1,302.93.
Primary wave 5 would be limited to no longer than equality in length with primary wave 3, so that the core Elliott wave rule stating a third wave may not be the shortest is met. Primary wave 5 would have a limit at 1,477.77.
The hourly chart would be exactly the same.
TECHNICAL ANALYSIS
WEEKLY CHART
Click chart to enlarge. Chart courtesy of StockCharts.com.
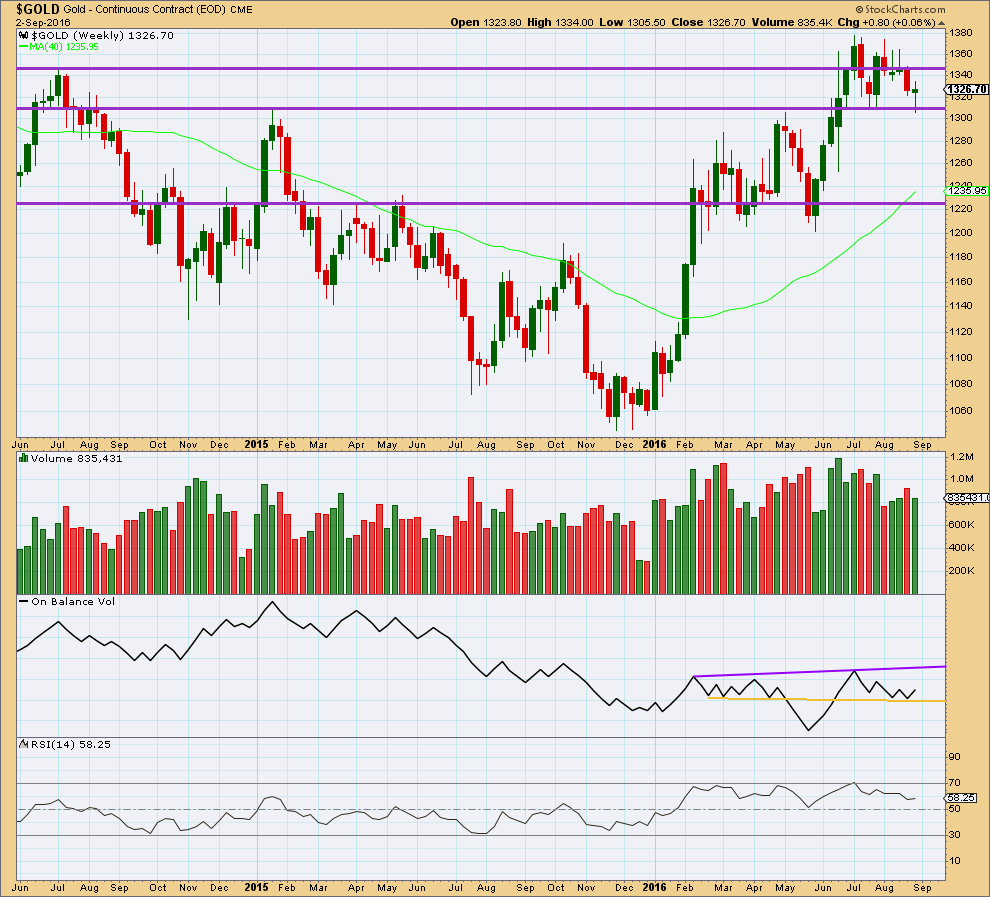
Last week made an important new low, slightly below the prior swing low of 18th of July. Price thereafter bounced up strongly from support about 1,310 – 1,305. Last weekly candlestick comes with lighter volume than the week prior.
To see what is happening here we need to look inside last week at daily volume.
The long lower wick of last weekly candlestick is bullish.
On Balance Volume is giving a bullish signal last week as it found support at the yellow trend line and has moved up and away from that line. OBV may find some resistance at the purple line.
RSI is not extreme. There is still room for price to fall or rise. There is no divergence between price and RSI at the weekly chart level to indicate weakness.
DAILY CHART
Click chart to enlarge. Chart courtesy of StockCharts.com.
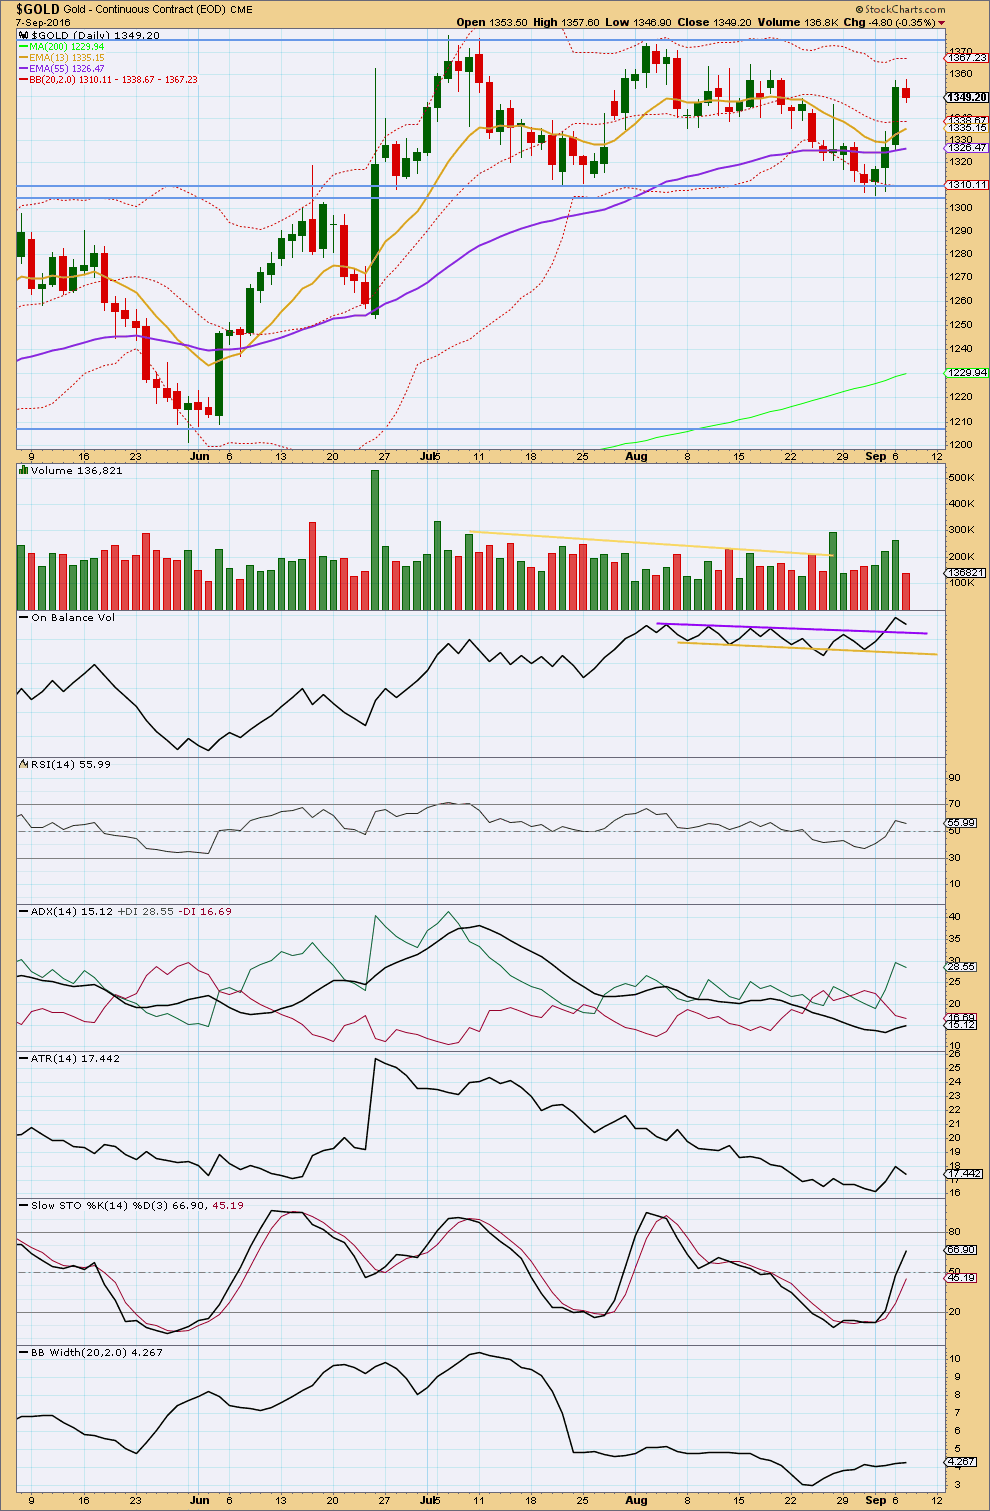
The strong volume spike shown on yesterday’s technical analysis chart has disappeared, which was expected.
Volume for three upwards days still shows a healthy increase. The rise in price has good support from volume. This supports the Elliott wave count.
Wednesday’s session completes a small red daily candlestick with substantially lighter volume. The fall in price does not have support from volume. Again, this gives good support to the Elliott wave count.
In the short term, for the last four days the volume profile is very clearly bullish. More upwards movement should be expected.
The bullish signal from On Balance Volume with a break above the purple line remains valid. If price moves lower, then OBV should find support now at this line, so this may assist to halt the fall in price.
RSI is not extreme and exhibits no divergence with price at this stage to indicate any weakness.
ADX is now above 15 and rising, indicating a trend is in the very early stages. The trend is up with the +DX line above the -DX line.
ATR has declined today, but one day of decline is not enough to indicate an end to the trend. ATR has shown some increase from the 1st of September, which may be the early stages of a new trend.
Stochastics is returning from oversold. It is not yet overbought. There is room for price to rise further.
Bollinger Bands are beginning to widen as some volatility returns to the market.
Overall, this classic technical analysis strongly supports the Elliott wave count.
This analysis is published @ 07:03 p.m. EST.

StockCharts are showing a volume spike for today. I’m pretty sure this will disappear, they usually do.
I have to wait for StockCharts to finalise their data before I can complete my analysis 🙁
I think minute iv needs one final small low before it’s done.
I’ve relabelled minute iii. Minute iv fits as a zigzag. There is alternation now in depth with minute ii, but not much in structure.
On the five minute chart I count minuette (c) as needing a final fifth wave down to complete an impulse.
Gold firing down bearish with a sell at multiple time frames starting at about 9:00 am.
NUGT just very short time frames of 1,3 and 5 minutes have fired down so far today although it did drop a lot. I bought some late today but got out at break even as too weak.
It looks to me like the banksters are predictably selling the Gold 1350.00 and Silver 20.00 pivots. The bulls are going to have to decisively take out these levels are or we could be headed to the 1275.00 area in short order imo…
Subminuette wave iv may have ended up at 5:15 am at 1,349.49 today and minute wave iv may have already finished at 9:11 am today at 1,341.49 or else still needs to drop to 1,338 target zone, however that may have already moved higher when gold moved up overnight?
Either way I’ll look up $24 for minute v target,.
I’m not clear about the two comments below?
Concerns re current wave count is disproportionality between minute 2 and 4 as well as break of channel which had contained minute 1-3.
Daniel I agree, although gold reached down to 1336 and close to Lara’s 1338 target, gold may be too bearish.
I’ve gotten multiple bearish firings on Gold from 1 to 39 minutes, which is a concern.
On the mark..great analysis
Hey Lara,
Likely seems that the wave 4 is completed now and we are in wave 5. What is your projection for wave 5 ?.
I know you have given us the territory of 24$ upmove but a small doubt coming in my mind is neither wave 1 or wave 3 was extended so does it sense that wave 5 will actually be an extended wave of minutte degree ? And could actually end above the last high ?
I hope you got my question..thank you
Minute iii looks extended, reasonably. It’s not 1.618 X minute i, but it’s not too far off that. It is longer than minute i.
Target for minute v = minute i = 1,367. That would still be my expectation.
This is a first wave still, so I wouldn’t be expecting a swift strong extended minute wave v within it. I wouldn’t be looking for that until minor 3 turns up.
If I’m wrong then my target may be too low. At this stage, as I say, expect any surprises to be to the upside.
Thank u madam
The GDX technicals are looking good:
> RSI is back above 50
> Volume was lower today supporting the small corrective move, following 3 days of higher volume for the up days
> While ADX has yet to turn up, the +DI line just crossed above the -DI line.
> OBV has moved above support
Yes, looking very good indeed. Overall that’s bullish for GDX. With Gold bullish as well, I would be looking for corrections to provide an opportunity to join the trend.
This count is based on the main count from Lara’s last GDX analysis. It appears that the first leg up from the intermediate bottom (Cycle wave x) labeled Minor wave 1 is nearing completion and then a larger correction may begin.
Minute wave 5 within Minor Wave 1 may be in progress and may end at or before 29.69 so that Minute wave 3 will not be the shortest.
Note that the Minute subdivisions of Minor wave 1 are not shown to avoid chart congestion.
Dreamer thanks again for the 2 awesome GDX charts, comes in handy.
Melanie you mentioned looking to tracking dollar with DXY.
The TOS,Think or Swim system allows adding a comparison line to the price chart as DXY, otherwise maybe use a US Dollar ETF like stockchart uses, UUP
US Dollar ETF.
Not sure if any of that is helpful, your inquiry was over my head and just offering if it helps.
Richard,
I doubt my inquiry was ‘over your head’. I currently use charts w/comparisons, ie: DXY or USD compared to UUP. Lara may at some point find time to translate her EW count to the USD chart, meanwhile, I may go back as time permits and study her US Dollar update and translate her count over to a DXY chart or Dollar futures chart and perhaps compare it to EWIs STU.
Dreamer does create ‘artistically’ accurate charts. Hear say suggests that some artists make very good traders. Perhaps Dreamer has a ‘the artist in him’…
Good Night
Haha…. I like your expression of chart interpretations. Charting is half art and half science lol
Bill
Thanks for your suggestion about using candlesticks (Heiken-Ashi format).
I switched from candle trend to Heiken-Ashi, they more visibly show the trend. I am already using MACD and RSI. I also use as other trend indicators: MFI money flow index, Fast Stochastics as well as SMA and EMA.
Richard-Hope it is of some use to you. I find it helpful. You may also find the Ultimate Oscillator interesting as there are a couple of ways to determine short term future direction with it that are somewhat reliable.
Bill thank you. I just looked at the Ultimate Oscillator and already have it covered with my combination of indicators thanks.
Hi Lara, I apologize if this question doesn’t make sense (I’m new to EW), but could the point labeled intermediate (2) in the main daily count just be wave A of a larger A-B-C structure for intermediate (2), with lower lows (below 1302.93) coming later this fall? Is there still a valid bearish count that targets 1288 or thereabouts? Thank you, Mark.
Thank you for your answer, Lara. (Sept. 6 comments)
Due to gold moving above confidence and confirmation points there no longer are any bearish counts left with enough probability worth charting unless gold drops below the invalidation point of 1,302.93 for the two daily counts. If that happens then there would be a bearish count.