A little downwards movement was expected to end about 1,338.
Price has moved lower to reach 1,335.89 so far.
Summary: Look out now for surprises to the upside. In the short term, a little more downwards movement to 1,333 – 1,330 is expected before price turns up to make new highs. The long term target for the Elliott wave count for a third wave to end is at 1,585. in the short term, the volume profile is bullish and classic technical analysis expects upwards movement.
New updates to this analysis are in bold.
Last weekly charts are here.
Grand SuperCycle analysis is here.
DAILY ELLIOTT WAVE COUNT
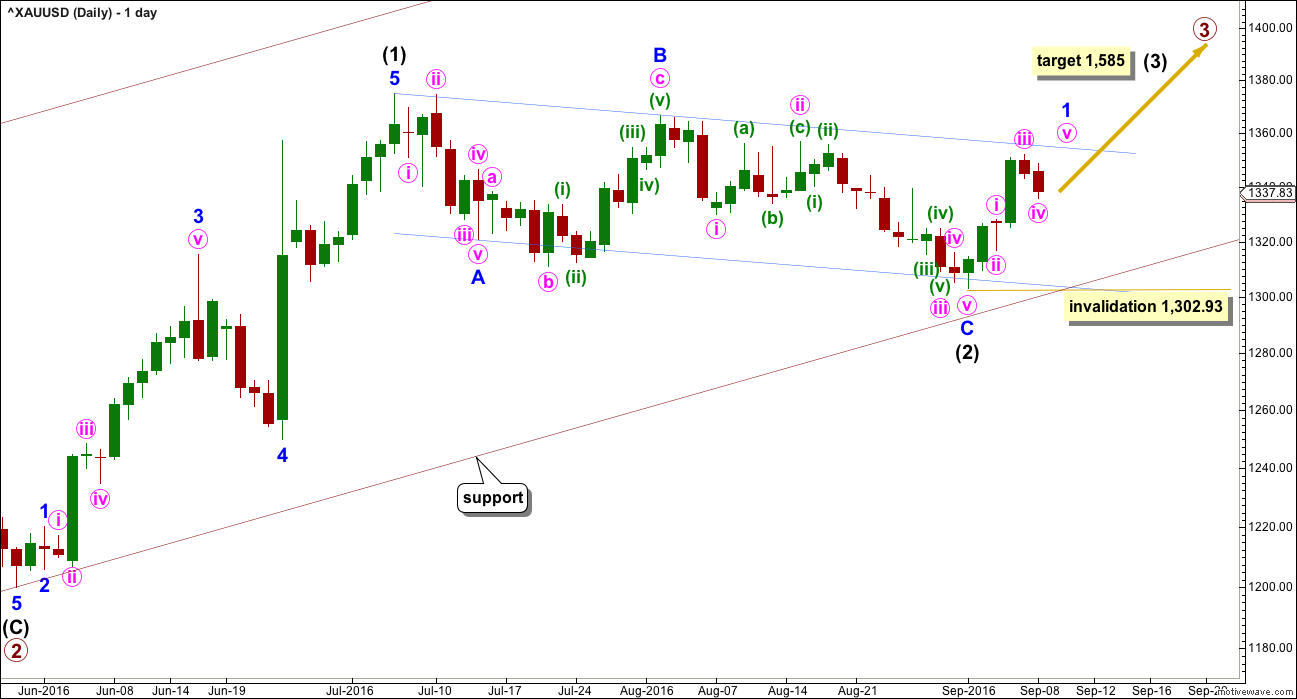
Primary waves 1 and 2 are complete. Thereafter, this wave count differs from the two alternates.
This main wave count will expect primary wave 3 to be longer than primary wave 1. Because this is very common, this is the main wave count. It expects the most common scenario is most likely. At 1,585 intermediate wave (3) would reach 1.618 the length of intermediate wave (1).
Intermediate wave (2) may now be complete ending just below the 0.382 Fibonacci ratio of intermediate wave (1) and lasting 40 days. Within intermediate wave (3), the upcoming correction for minor wave 2 may not move beyond the start of minor wave 1 below 1,302.93.
Draw a channel about intermediate wave (2) using Elliott’s technique for a correction (blue lines). Price is finding some resistance on the way up about the upper edge. After breaking through resistance at the upper blue line price may then turn down to find support about there.
With this wave count expecting a third wave at two large degrees to begin, look out for surprises to the upside at this stage.
Intermediate wave (1) lasted 27 days and intermediate wave (2) lasted 40 days. Intermediate wave (3) may be reasonably expected to last longer than intermediate wave (1) in both time and price. A Fibonacci 55 days would be a first expectation.
HOURLY ELLIOTT WAVE COUNT
Minor wave 1 is unfolding as a more common impulse.
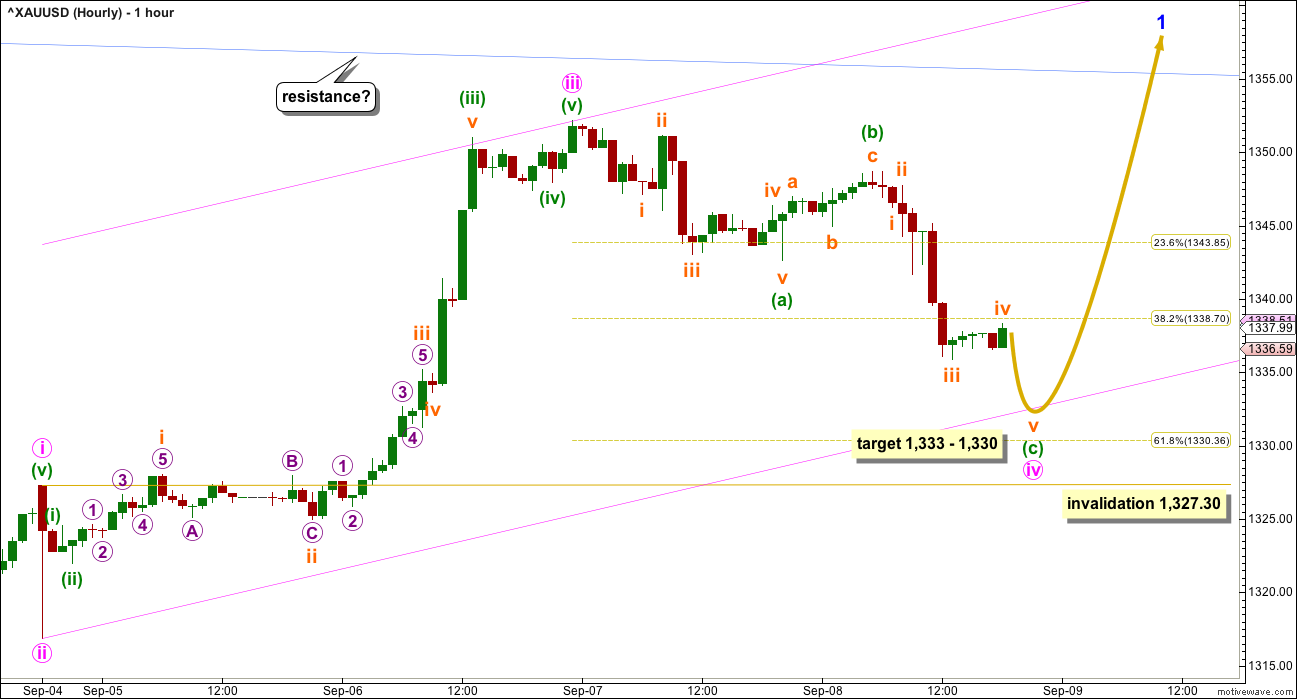
Within minor wave 1, so far minute waves i, ii and iii are complete. Minute wave iv is close to completion. There is no Fibonacci ratio between minute waves i and iii, so it is more likely that minute wave v will exhibit a Fibonacci ratio to either of minute waves i or iii. The most common ratio for a fifth wave is equality in length with the first wave, so minute wave v would most likely be 24.37 in length.
Minute wave ii was a quick shallow 0.43 zigzag. The structure within minute wave iv no longer looks right today as an expanded flat; the end of minute wave iii may have been the last high and minute wave iv may have begun there. If this is correct, then minute wave iv may not be exhibiting alternation in structure; it fits neatly as a zigzag. If minute wave iv ends close to the 0.618 Fibonacci ratio, then it would exhibit alternation in depth and duration.
Minute wave ii was very quick. Minute wave iv so far is much more time consuming. This disproportion does not have the right look anymore at the hourly chart level, but it still looks right at the daily chart level. Both minute waves ii and iv show as red candlesticks or doji on the daily chart.
Within the zigzag of minute wave iv, at 1,333 minuette wave (c) would reach 1.618 the length of minuette wave (a). This is reasonably close to the 0.618 Fibonacci ratio of minute wave iii at 1,330 giving a $3 target zone.
Minute wave iv may not move into minute wave i price territory below 1,327.30.
When minute wave iv is complete, then minute wave v should move at least slightly above the end of minute wave iii at 1,351 to avoid a truncation.
When a five wave impulse upwards is complete for minor wave 1, then a multi day correction for minor wave 2 should unfold. It may be relatively deep. Minor wave 2 should offer a good opportunity to join the trend at a good price.
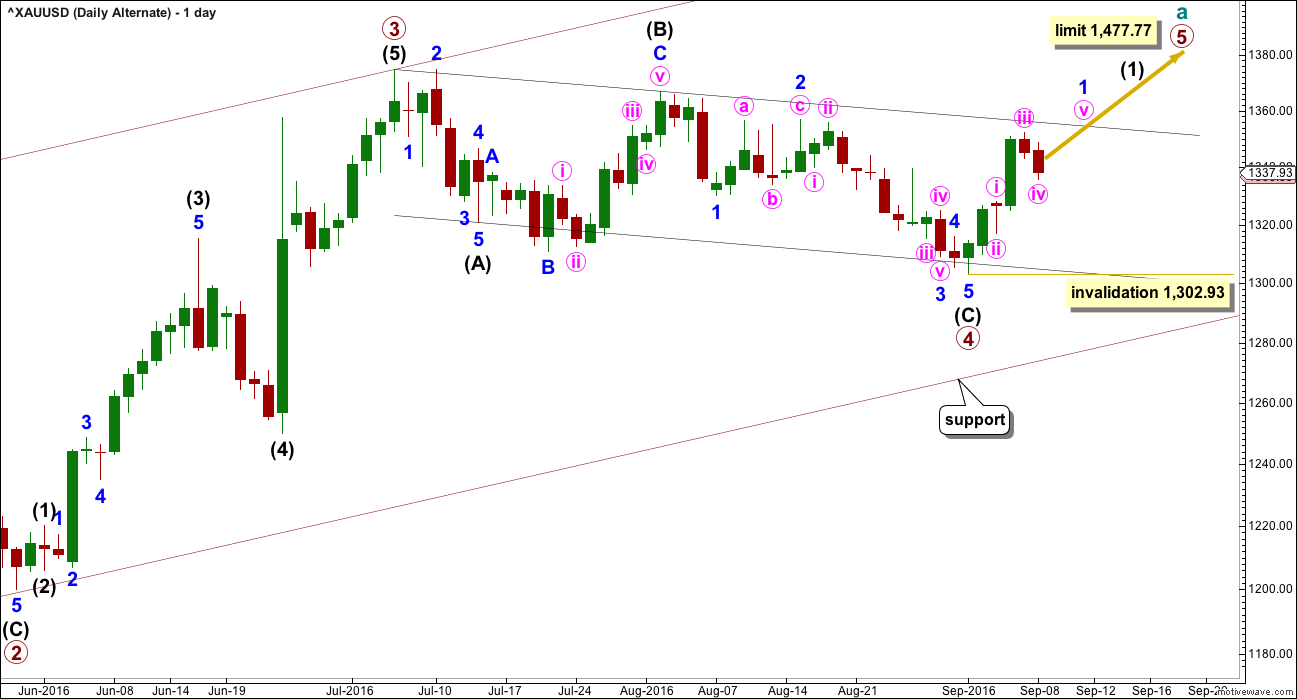
ALTERNATE DAILY ELLIOTT WAVE COUNT
It is possible that primary wave 3 is over and shorter than primary wave 1. Primary wave 3 shows stronger volume than primary wave 1 (see technical analysis weekly chart).
If primary wave 3 is over, then the current consolidation for Gold would be primary wave 4.
Primary wave 2 was a relatively shallow 0.35 expanded flat correction. Primary wave 4 may be a deeper zigzag which would exhibit perfect alternation.
Within primary wave 5, no second wave correction may move beyond the start of its first wave below 1,302.93.
Primary wave 5 would be limited to no longer than equality in length with primary wave 3, so that the core Elliott wave rule stating a third wave may not be the shortest is met. Primary wave 5 would have a limit at 1,477.77.
The hourly chart would be exactly the same.
TECHNICAL ANALYSIS
WEEKLY CHART
Click chart to enlarge. Chart courtesy of StockCharts.com.
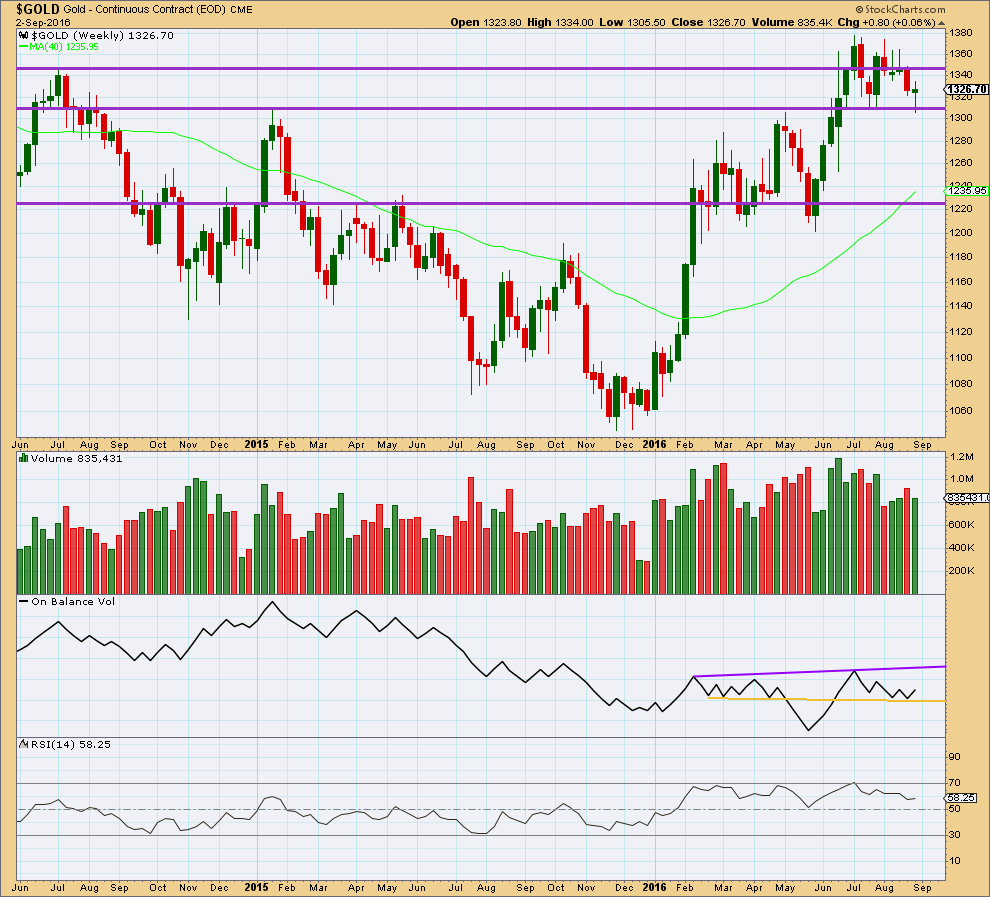
Last week made an important new low, slightly below the prior swing low of 18th of July. Price thereafter bounced up strongly from support about 1,310 – 1,305. Last weekly candlestick comes with lighter volume than the week prior.
To see what is happening here we need to look inside last week at daily volume.
The long lower wick of last weekly candlestick is bullish.
On Balance Volume is giving a bullish signal last week as it found support at the yellow trend line and has moved up and away from that line. OBV may find some resistance at the purple line.
RSI is not extreme. There is still room for price to fall or rise. There is no divergence between price and RSI at the weekly chart level to indicate weakness.
DAILY CHART
Click chart to enlarge. Chart courtesy of StockCharts.com.
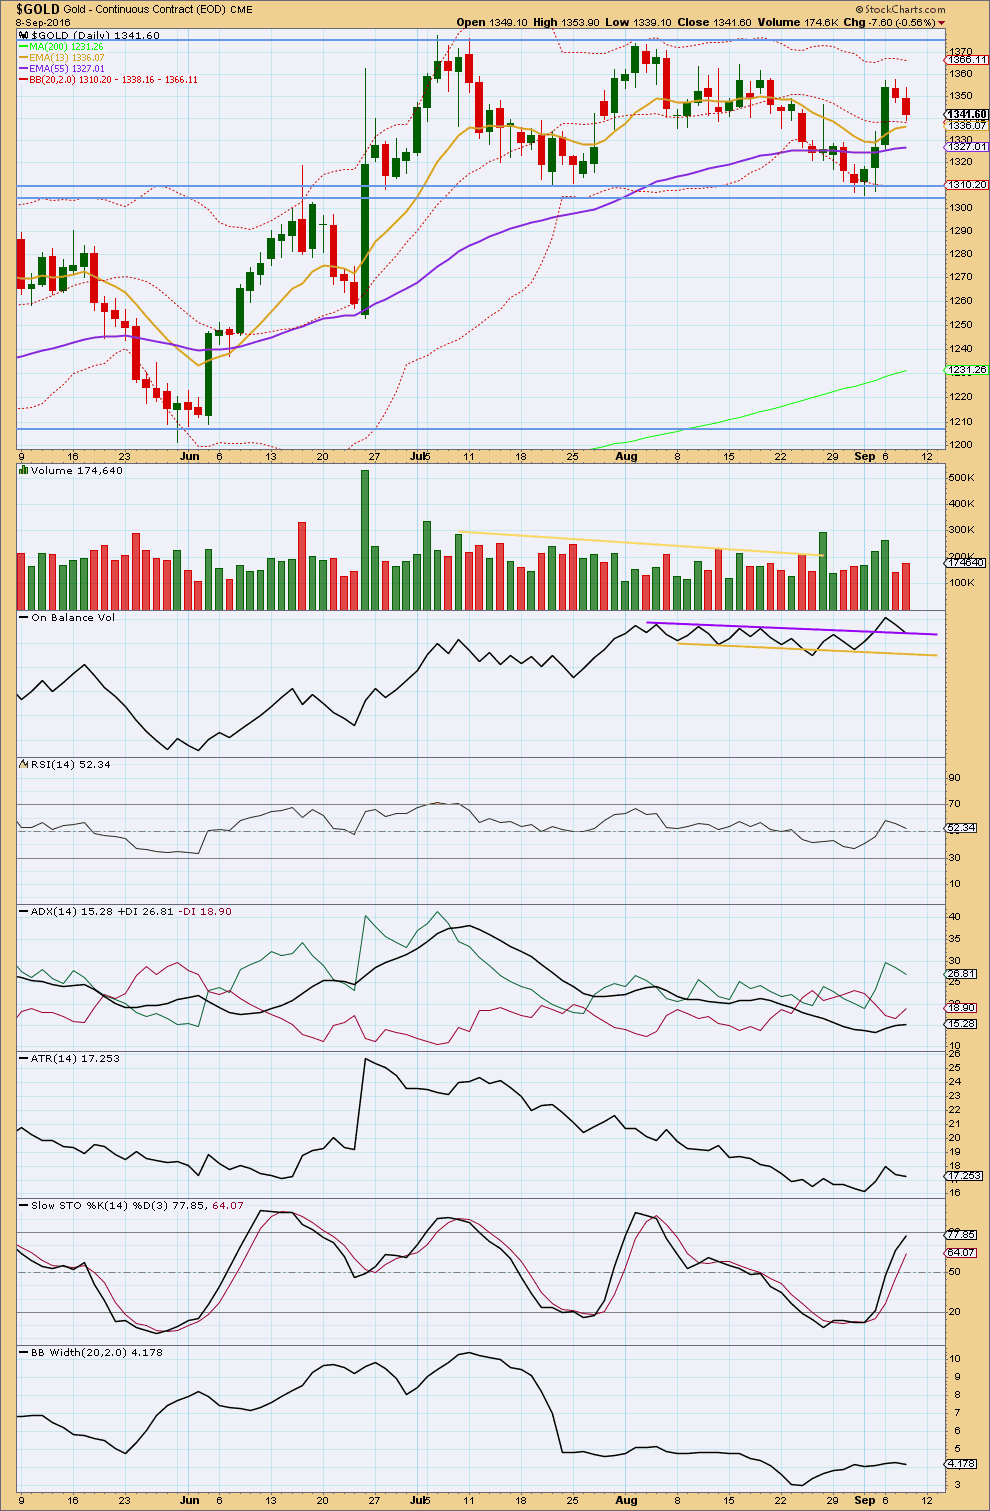
Two downwards days in a row come with lighter volume than prior upwards days. Some increase in volume for the second downwards day indicates a little more downwards movement may still unfold. Overall, the volume profile is still bullish.
On Balance Volume gave a bullish signal with a break above the purple line. Now OBV has come down to touch this line that should provide support and halt the fall in price.
RSI is close to neutral. There is room for price to rise or fall. There is no divergence between price and RSI to indicate weakness.
ADX is above 15 and increasing. The +DX line is above the -DX line. A new upwards trend is indicated.
ATR is declining for the last two days. With a small counter trend pull back this makes sense. ATR turned upwards four days ago indicating a new trend may be beginning.
Stochastics is not yet extreme, but this may remain extreme for reasonable periods of time during a trending market.
Bollinger Bands are showing a slight increase. After a period of contraction, it should be expected they will again expand as volatility returns to the market.
Price may find support here about the 13 day moving average.
This analysis is published @ 09:05 p.m. EST.

Dow drops more than 300 points, more than 1% on hawkish Fed, oil slide
Sept 9, 2016 2:22 p.m. ET
Energy shares tumble as oil prices slump more than 3%
http://www.marketwatch.com/story/us-stock-futures-tilt-lower-with-oil-prices-fed-speakers-in-focus-2016-09-09?link=MW_popular
Gold futures GCZ6, -0.65% settled down 0.5% at $1,334.50 an ounce, as the ICE U.S. Dollar Index DXY, +0.37% jumped 0.5% following Rosengren’s comments.
Lara I really appreciate your 2 comments and charts.
Your kind, insightful feedback on an important wave count change is very helpful.
I just sold my small NUGT position at a minor move up on a likely much deeper wave down and will wait until your new lower target $1,322 to buy again.
Meanwhile I will stay tuned to my favorite golden greats channel at NZ- LARA.FM
LOL Thanks Richard.
I’ve been away this week to look after family. I returned home today, an 8 hour drive. Analysis will be done tomorrow morning, it will be available Saturday afternoon / evening NY time this weekend.
Updated hourly chart.
Minor wave 2 is fitting best as a double zigzag. These are very common structures and this one looks right.
The first zigzag, minute w, fell short of the 0.236 Fibonacci ratio. It was not deep enough. So the second zigzag is moving price deeper. The 0.618 Fibonacci ratio is very likely where it may end about 1,322.
The channel is a best fit. When it’s breached by upwards movement that shall be a strong indicator that minor 2 is over and minor 3 up would have begun.
Sorry Lara my question could be wrong, but Im wondering what if Fed in less than 2 weeks will hike the rate and gold will move even lower than any 1322? more likely even lower than 1300, and we are not going to see uptrend wave 3 for a while? Do you count this kind of scenario in EW analyses? What Im trying to ask in EW analyses does anybody analyzing an economic data, statistics and financial events? Other wise daily and hourly charts could be not reliable for trade. Only long term can fit this waves. Remember brexit week? I was not in your subscription in that time but I was reading others, I know all other EW services missed important key “referendum” and all missed estimates. Thanks
Slava,
Elliott Wave does not consider fundamental analysis or “news” events. Lara will tell you that “social mood” drives the wave count, not news. That said, we all know that news can affect markets, sometimes by amplifying moves or at other times may appear to move the market against the EW count. That just means that the existing count was not the “correct” count. EW is all about probabilities. There are always multiple options and yes, that can be frustrating. That is why there is so much “junk” EW analysis on the web. Many do not follow the rules. That is why Lara is so valuable. She not only strictly follows the rules, but also has a great ability to prioritize possible wave counts to more often identify the correct count.
You may wish to click on the “education” tab on the right column for more info. You can watch the “History’s Hidden Engine” video and other instructional videos by Lara. You may also want to order the latest version of Elliott Wave Principles by Frost and Prechter. Hope this helps.
What Dreamer said.
The only think I would have to add is that Elliott wave is mutually exclusive to fundamental analysis.
From this part of your comment: “What Im trying to ask in EW analyses does anybody analyzing an economic data, statistics and financial events? Other wise daily and hourly charts could be not reliable for trade. Only long term can fit this waves.”
I’m seeing that maybe you would prefer to follow a fundamental analyst.
That would not be me.
If you find an EW analyst who is using fundamental data to guide their work, they’re doing EW wrong.
This downwards movement is now too deep and long lasting to be minute iv. That just does not have the right look anymore.
I think this is minor wave 2. Which at it’s end should present a good opportunity to either add to long positions or join the trend.
Updated daily chart.
At 2:17 pm gold just made a new day low down to 1329.19 down from 1330.48 at 10:10 am.
Watch for possible invalidation below 1327.30 as Lara said would mean Minor 1 is already over.
Given greater than 61.8% retracement of recent move in GDX although gold has not broken 1327, probability is this is minor wave 2.
I agree.
This tape seems to play the buy the dippers really well. It’s a big warning sign when GDX decisively broke and stayed below 50sma. The goal should eliminate most of leveraged hands. People follow gold gurus to buy way too many GDX options….good luck!
Just testing. I’ve tried to post for the past 8 hours and the website just refuses to let me do so. Perhaps short posts are acceptable. Longer ones aren’t.
OK, short ones work.
that’s weird Alan, I’ll let Cesar know. He may email you to get some details to try and fix the problem.
Hi Alan,
Do you get an error message? Or does nothing happen after you submit the comment?
Thank you.
Cesar
Hi Cesar.
When I submit the comment, I receive a 404 error stating that nothing has been added. Maybe it’s just my computer that has a problem. So, if you can receive this reply then everything’s fine.
***
I just submitted and it works. I did it on my iPad though. But it proves that there’s nothing wrong at your side. Sorry for the trouble.
Lara: I am fan of Candlesticks chart pattern for short term and long term period. I try to anticipate bullish/bearish patterns.
On gold’s daily chart a long green (white) candle followed with two small red candles. If today’s candle is another small red candle than expect Monday a long green (white) candle to cover the whole trading range.
That will be a bullish candle pattern.
By end of the day if thats what turns out I am buying my remaining miners.
Thanks Papudi.
The long green / white candle of September 6th was strong. It’s taken bears three days to push price lower, and they have not yet managed to fully retrace that candle.
That looks bullish.
Lara might minor 1 end somewhere between 1351 and about 1360?
You had last analysis mentioned that minor 1 might be a $24 move up from minute iv.
Then mentioned a possible 1367. You also have at least slightly above 1351.
Yes, I think so. If it’s begun at the last low then 1,359 looks like a reasonable target.
That would require price to break above resistance at the upper edge of the blue channel though. If it can’t do that then the target may be too high.
Because this is a first wave and not a third, I wouldn’t necessarily be expecting it to be swift and strong.
Two new 2x leveraged ETF’s for Silver Miners that may be good options if they attain enough volume for easy trading
http://www.direxioninvestments.com/products/daily-silver-miners-index-bull-bear-2x-shares?utm_campaign=Silver+miners-Launch+Email
Im done with this ETFs. Praying to make it back to around $31 on NUGT, before option expires next moth. But looks like I’m going to loose. Good luck with that. Looking on the news and don’t see anything what possibly could drive gold strongly up for next 3 weeks including Fed.meeting
As you know, NUGT is 3x volatile, Slava, so it really amplifies any small error. EW can’t get you the degree of precision that you need to consistently make money from something so volatile. Have you considered buying some of the quality miners instead? It would really reduce your risk.
After what I saw this month, definitely . I would sit calm even with NUGT or JNUG as long as its not an option contracts with expiration in 2 moth. That was a pure greed from my side, and Im reaping what I sawed. Thanks for comment Thomas
In my experience trades in triply leveraged instruments should generally have a time window of hours, not days, and certainly not weeks. They are far too volatile for a buy and hold (hope?) approach and the value decay is absolutely brutal. I rarely hold them for more than a few hours at the most, this is doubly true if you are trading the options on the ETF. If you are very confident about the trend, selling covered calls against your long position and hedging with puts can really cushion the volatility…especially if you use the profits from the puts to lower you cost basis. Clearly this works only with a very high degree of confidence in the main trend…
Slava, I do trade NUGT however only day trade, no overnights.
Hi Lara, please see attached chart. What do you think of this possibility? (iv) wave already ended at 1,335.6 low, and (v) wave is on the way up.
Thank you so much.
Thank you, Lara. What happens if we move below 1327.30, invalidating the main hourly count? Is that the point at which we should be looking for a much deeper (below 1302.93) correction, or are there other, less bearish, options?
If price moves below 1,327.30 then my analysis of minor 1 as incomplete would be wrong. At that stage it would be over and downwards movement would be minor wave 2.
The invalidation point would be at 1,302.93. Minor 2 may not move beyond the start of minor 1.