Upwards movement fell just short of the upper confirmation / invalidation point.
Both Elliott wave counts remain valid.
Summary: A consolidation is expected to move sideways now for about three weeks. This may be a B wave within a B wave, which do not present good trading opportunities. At this stage, a new high above 1,336.14 at any stage would invalidate the bearish alternate and confirm the main bullish wave count.
New updates to this analysis are in bold.
Grand SuperCycle analysis is here.
The last published monthly chart may be seen here.
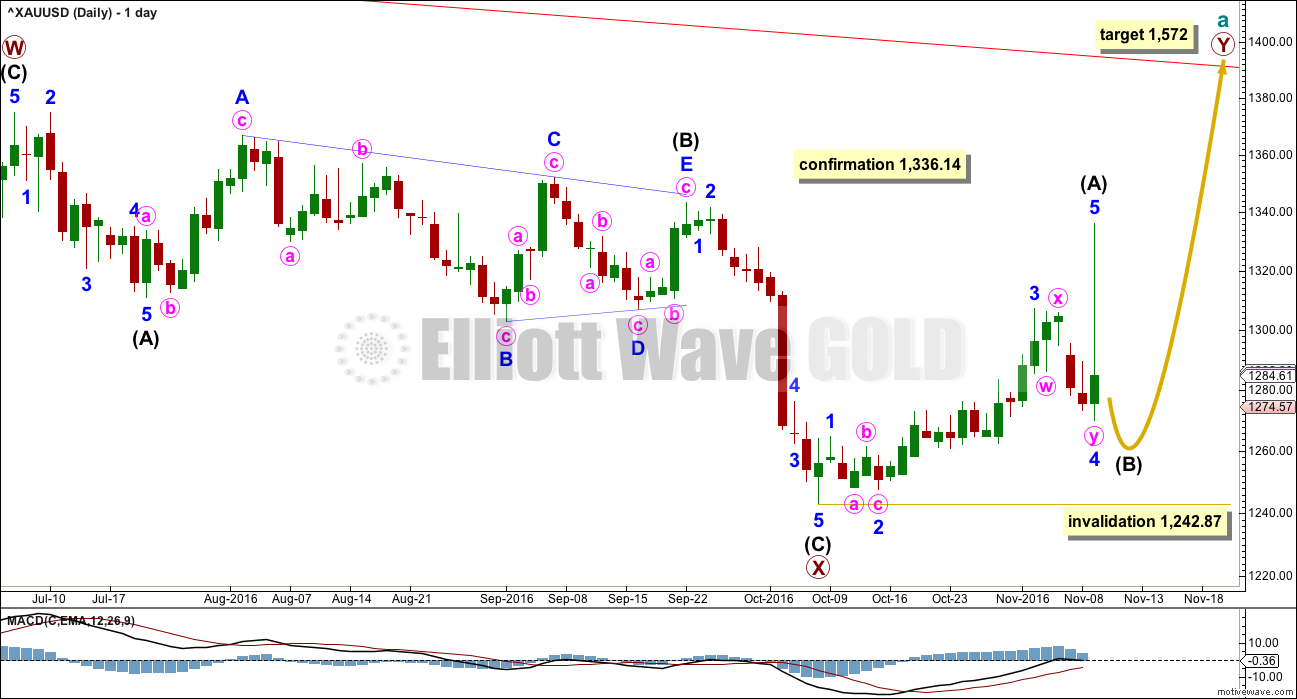
DAILY ELLIOTT WAVE COUNT
The zigzag downwards for primary wave X may be complete, at all time frames. A target for primary wave Y upwards would be about 1,569 where primary wave Y would be about even in length with primary wave W.
There is now a five wave structure upwards for this wave count labelled intermediate wave (A). Minor wave 5 ended quickly with a blowoff top that was just as quickly reversed.
Within intermediate wave (A), there is only a very little alternation between minor waves 2 and 4: minor wave 2 was a deep 0.78 single zigzag and minor wave 4 was a deep 0.63 double zigzag.
Intermediate wave (A) lasted 23 days, two longer than a Fibonacci 21. Intermediate wave (B) may be about the same duration.
Intermediate wave (B) may not move beyond the start of intermediate wave (A) below 1,242.87.
HOURLY ELLIOTT WAVE COUNT
Minor wave 5 ended with a blowoff top, typical of commodities. There are no Fibonacci ratios between minor waves 1, 3 and 5.
So far, within intermediate wave (B), a zigzag downwards may be complete for minor wave A. If minor wave A is labelled correctly as a three wave structure, then minor wave B may move beyond its start above 1,336.14.
Minor wave B may be any one of more than 23 possible corrective structures. It should be expected to be a choppy overlapping consolidation that could last several days, or it may last about two weeks or a bit longer. B waves most often do not present good trading opportunities. B waves within B waves, as this one is, most often are exceptionally complicated and choppy movements. The labelling within it will change as this structure unfolds. It is impossible at this early stage to tell with any reasonable level of confidence which structure it will be.
The normal range for minor wave B would be from 1 to 1.38 the length of minor wave A, giving a range from 1,336.14 to 1,361.17.
If intermediate wave (B) is unfolding as a flat correction, then the minimum requirement for minor wave B would be to reach 0.9 the length of minor wave A at 1,329.55.
If intermediate wave (B) is unfolding as a triangle, there is no minimum requirement for minor wave B within it; minor wave B needs to only subdivide as a three.
If intermediate wave (B) is unfolding as a combination, then the first structure in a double may be a zigzag labelled minor wave W. There would be no minimum nor maximum requirement for minor wave X upwards; it needs to only subdivide as a three.
ALTERNATE DAILY ELLIOTT WAVE COUNT
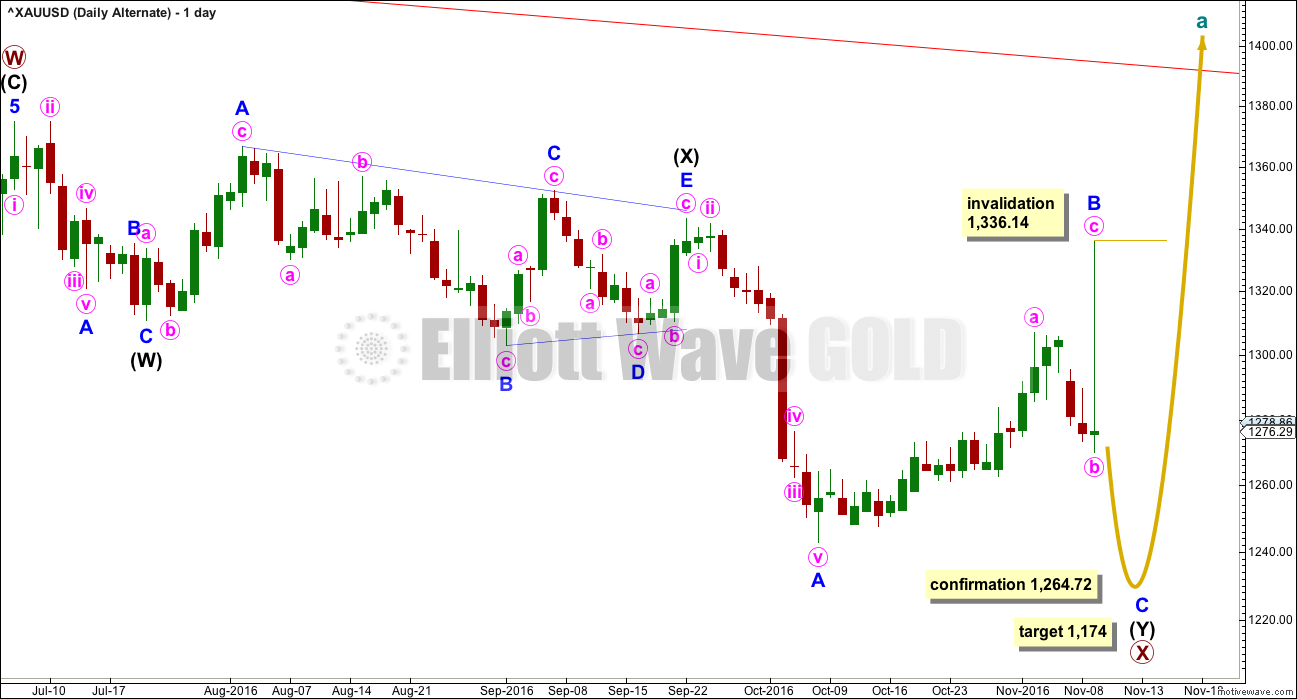
This wave count sees a correction downwards as incomplete.
Within multiple corrections labelled W-X-Y (X-Z), the rule states the maximum number of corrective structures is three. This maximum applies only to the corrective structures of W, Y and Z. Otherwise the maximum would need to be five, not three.
Within multiples, each corrective structure of W, Y and Z may only themselves be labelled as simple corrective structures: A-B-C, or A-B-C-D-E in the case of triangles. They may not themselves be labelled W-X-Y (X-Z). That would increase the maximum beyond three and violate the rule.
This rule does not apply to the joining structures labelled X. They may be any corrective structure including multiples.
The most common mistake for those new to Elliott wave or sometimes those who do not appear to have understood the rule, is to label long movements as W-X-Y-X-Z, with each of W, Y and Z also labelled as multiples. Such labelling of multiples within multiples violates the Elliott wave rule. Such analysis is of no predictive use and should not be seriously considered.
Here, the second zigzag in the double is relatively close to completion.
Minor wave B moved higher in the last session, remaining just below the start of minor wave A. Minor wave B here is seen as a three wave zigzag. The subdivisions will all fit at the hourly chart level. The blowoff top may have been minute wave c. While it is entirely possible for C waves to behave like this, it is not as common as fifth waves. This slightly reduces the probability of this wave count today.
At 1,174 minor wave C would reach 1.618 the length of minor wave A. Within minor wave C, no second wave correction may move beyond the start of its first wave above 1,336.14.
At this stage, a new low below 1,264.72 would invalidate the main wave count and provide some confidence in this alternate.
ALTERNATE HOURLY ELLIOTT WAVE COUNT
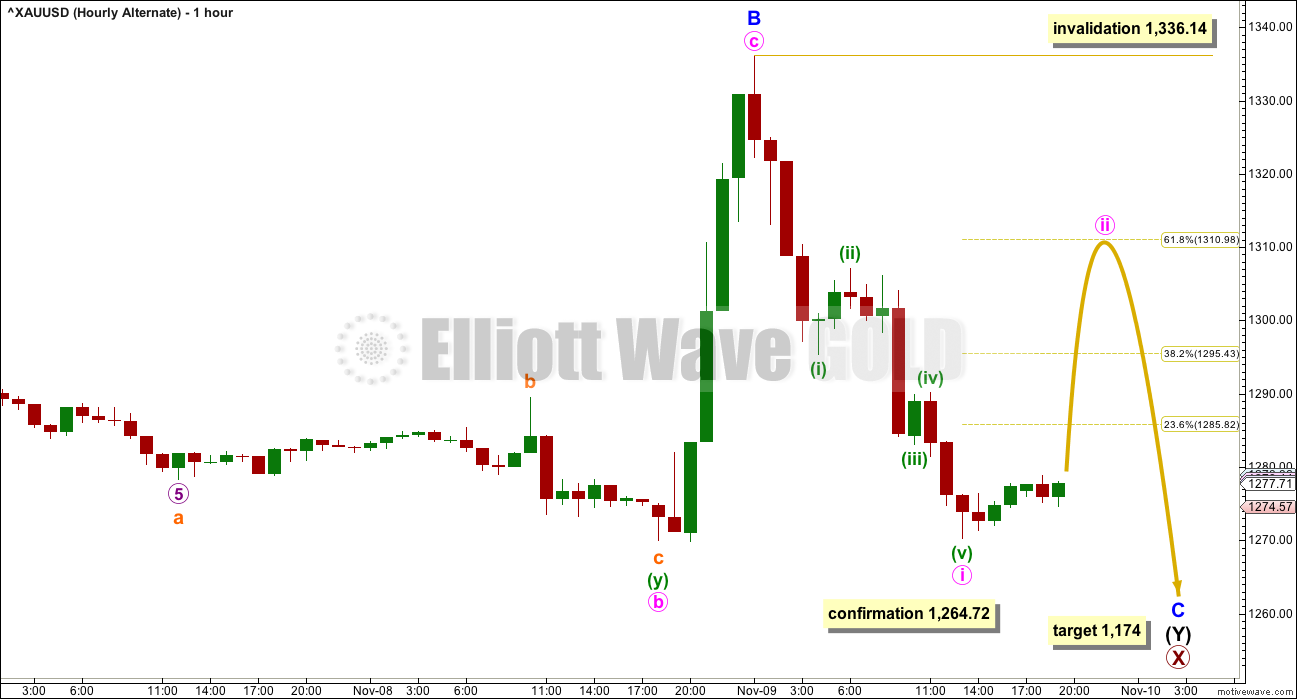
Downwards movement within minor wave C must be seen as a five wave structure for this wave count, labelled minute wave i.
This does not have as neat a fit as the main hourly wave count, but it is entirely valid. It is impossible to tell with certainty if this downwards wave is a complete three or five.
Minute wave ii may not move beyond the start of minute wave i above 1,336.14. Minute wave ii may last a few days. It may end close to the 0.618 Fibonacci ratio of minute wave i at 1,311.
TECHNICAL ANALYSIS
WEEKLY CHART
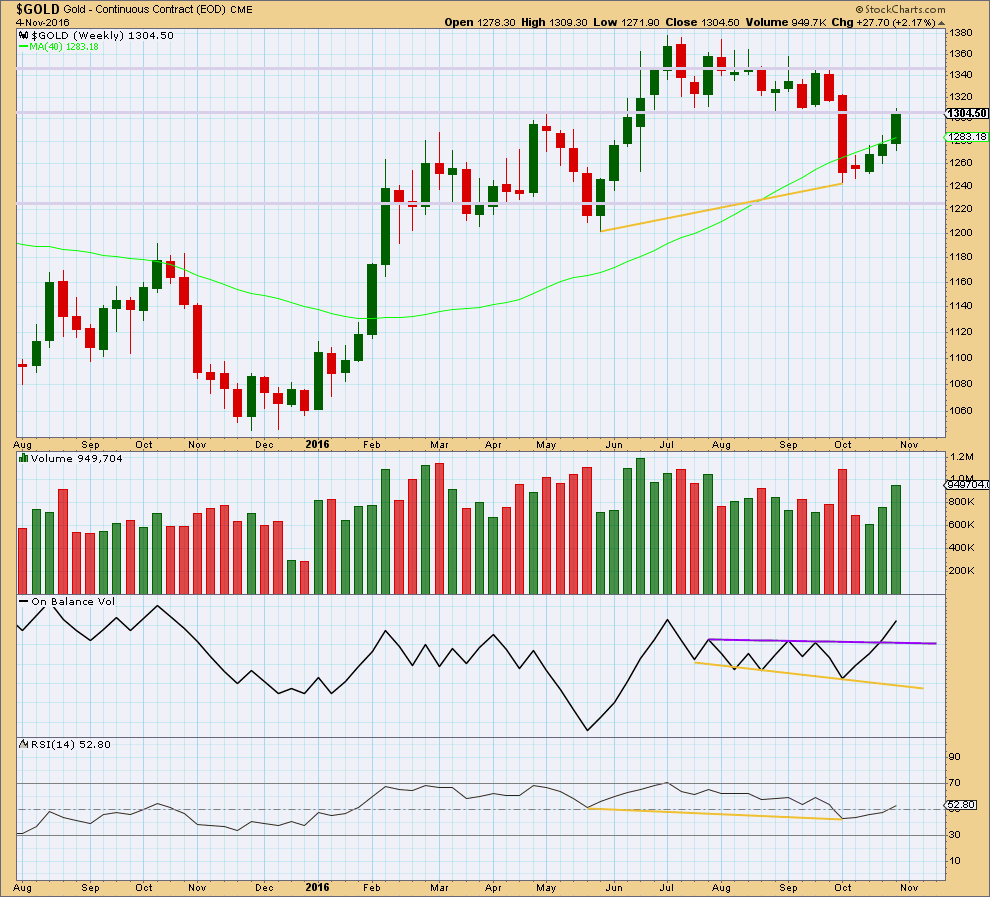
Click chart to enlarge. Chart courtesy of StockCharts.com.
Following bullish divergence between price and RSI (yellow lines), price has been moving upwards for three weeks on increasing volume.
RSI at the weekly chart level is above 50, which is bullish. It has a long way to go before it would reach extreme, so there is plenty of room still for price to rise.
Price is finding some resistance at an area of prior support at 1,305 – 1,310. If price can break above 1,310, that would be a strong bullish signal. The next line of resistance would then be about 1,350.
DAILY CHART
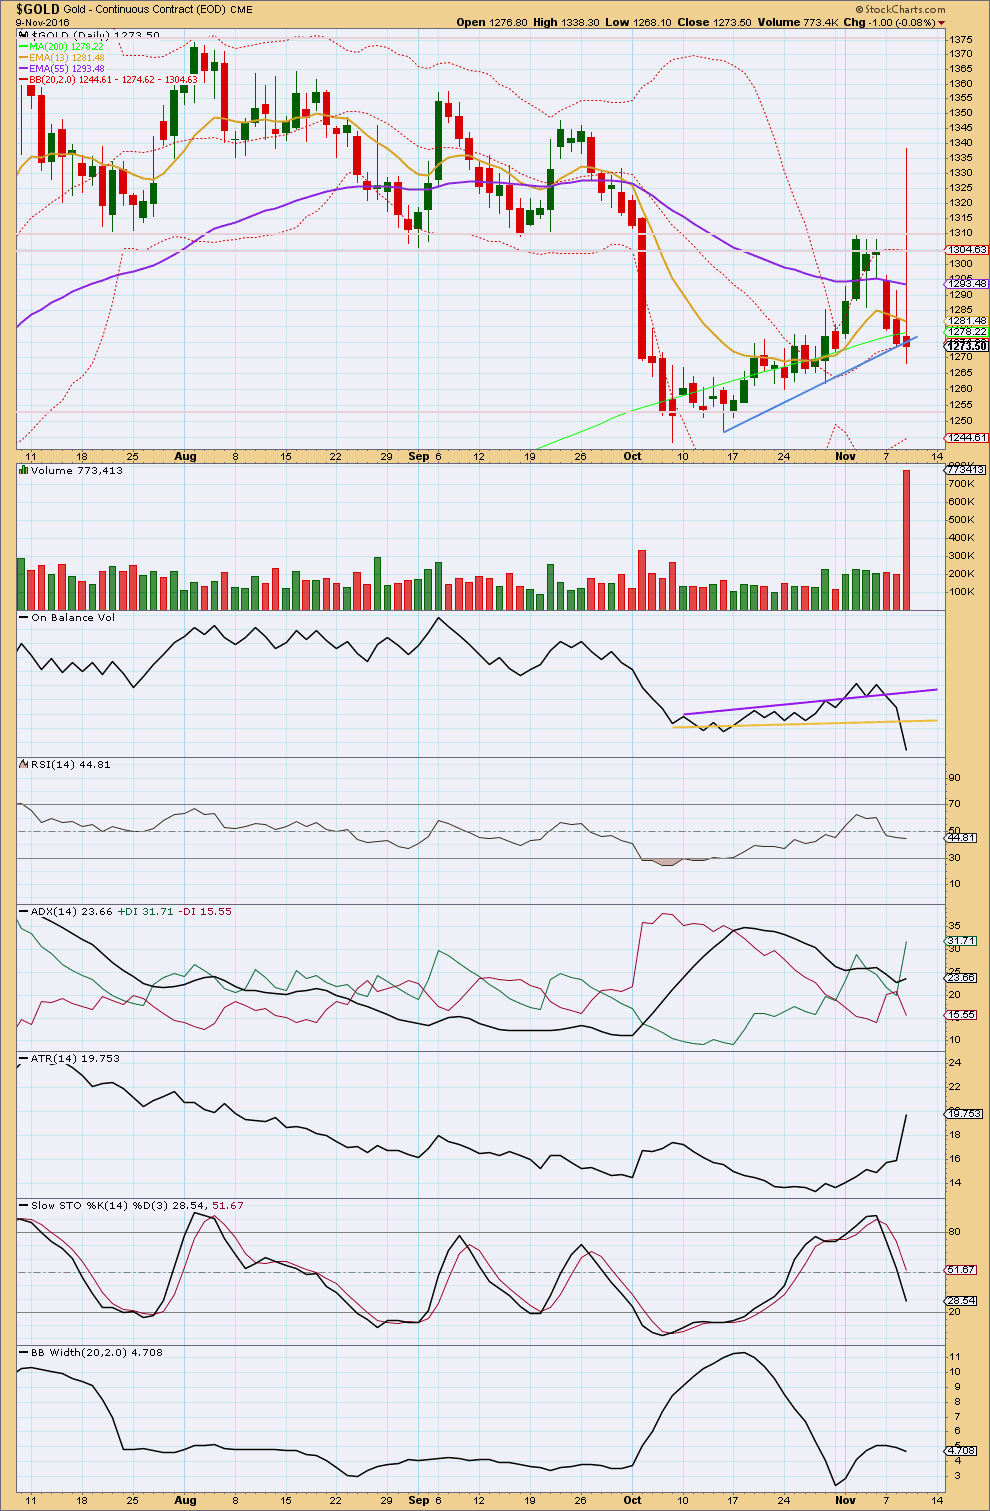
Click chart to enlarge. Chart courtesy of StockCharts.com.
The sharp volume spike for this session looks like a blowoff top. A consolidation should now be expected to follow it.
The long upper wick is very bearish. Although the bulls began the session with strength, they were unable to maintain price at the high and the bears took over completely to bring price almost but not quite to a new low.
On Balance Volume is today giving a strong bearish signal with a break below the yellow support line. This strongly favours the alternate Elliott wave count. That wave count should be seriously considered because OBV tends to work very well with trend lines, particularly when the break is as clear as this one.
RSI is just below neutral. There is room for price to rise or fall.
ADX today indicates an upwards trend is in place. ATR agrees as it has increased.
However, Bollinger Bands disagree. Despite a very strong trading session, volatility has slightly decreased as Bollinger Bands narrowed.
Stochastics is not yet oversold. There is room for price to fall further.
This analysis is published @ 08:39 p.m. EST.

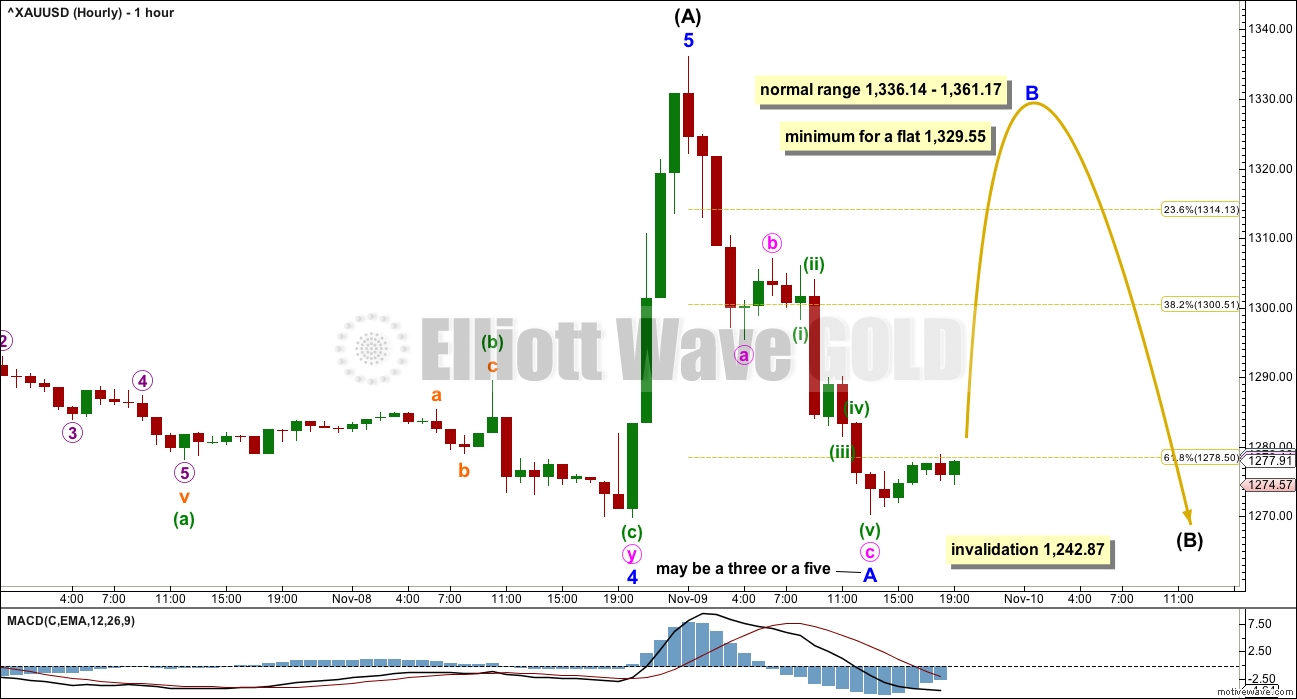
Updated hourly chart:
Minor B has moved lower. The wave down yesterday that I thought looked better as a three must have been a five 🙁
Still within a B wave of a B wave, still have to be very flexible on what structure it may be. Still expecting overall overlapping choppy movement for about three weeks.
The minimum for a flat does not have to be met if a triangle or combination is unfolding.
Lara-Wasn’t he main wave count invalidated below 1264.72?
At this stage, a new low below 1,264.72 would invalidate the main wave count and provide some confidence in this alternate. Thanks
That was before minor 5 ended.
Because minor 4 could not move into minor 1 price territory.
Now there is a five up for intermediate (A) the invalidation point must move down to it’s beginning at 1,242.87.
Minor 5 ended within just five hours, much much quicker I think than any of us expected it to be.
I am very sorry Bill and other members, I did not update that sentence on the alternate daily wave count. I now see where the confusion comes from.
It is fixed now. I’m really sorry for the confusion! That’s not good enough.
OK, it makes more sense now. Thank you,
Nicely done by Gold price; slipping through the cracks lol… IMO sustaining below 1269 would likely see Gold price break below 1260…. Tremendous, hard to catch the drift really with price been on a seesaw lately 🙂
No gold in this post, but if the stock market interests you, read on for his bullish take
https://rambus1.com/2016/11/09/wednesday-report-142/
History doesn’t repeat exactly, but it often rhymes. The last time gold had a very high volume spike on a down day in 2013, it rallied for the next 9 days. This concept seems to line up well with Lara’s idea of a flat correction that will provide a retest of the overnight high. Lets see if gold bounces back up for several days.
I went and looked at the last 5 years for gold and there was only one day with high volume anywhere close to todays massive volume spike. It was in 2013 on a down day. I’ll post a 2nd chart showing the detail.