
Last week expected an upwards trend was in place.
Price continues higher as expected.
Summary: An upwards trend is in place. The target is either 24.602 or 23.093. The invalidation point is 17.763. In the short term, a small consolidation may unfold sideways and lower before the upwards trend is ready to resume.
New updates to this analysis are in bold.
To see how this analysis fits into the bigger picture, see last monthly charts here.
This analysis is presented with a main and alternate wave count. They are presented in the order they were developed, not in order of probability.
WEEKLY WAVE COUNT
Click chart to enlarge.
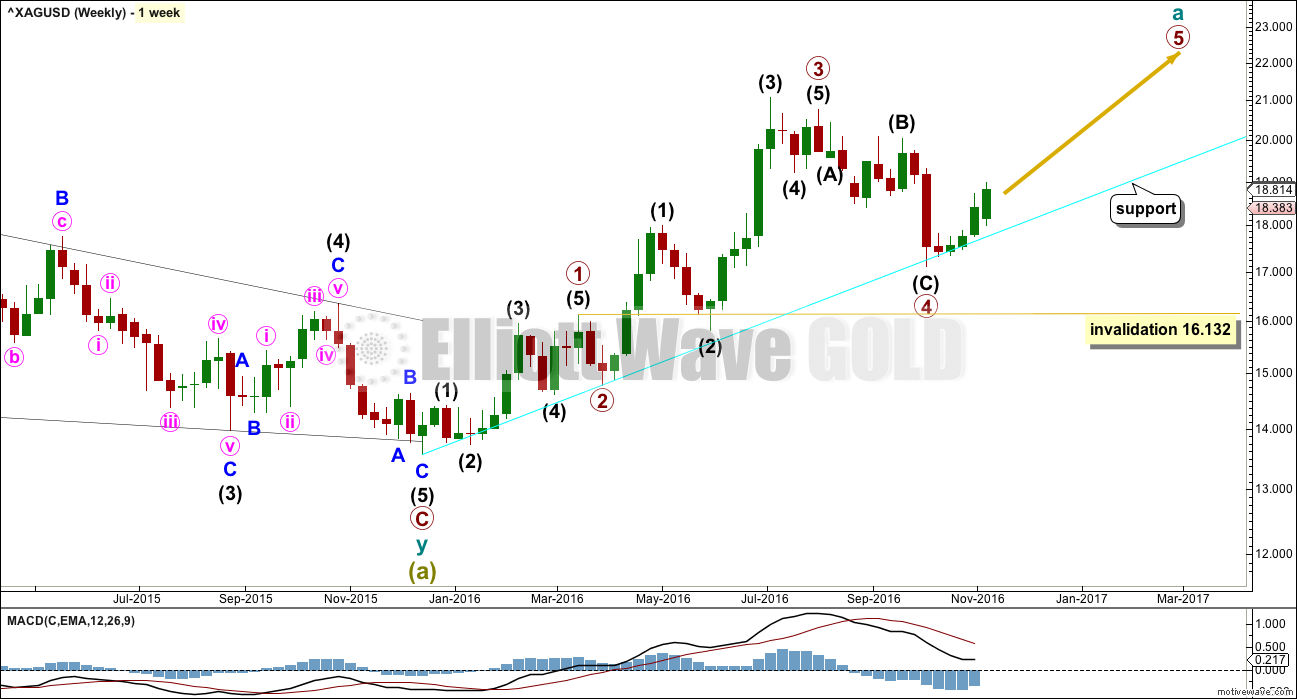
If a zigzag is unfolding upwards, then within it cycle wave a should subdivide as a five wave structure. So far primary waves 1 through to 4 may be complete.
Within primary wave 5, no second wave correction may move beyond its start below 17.409.
The disproportion between primary waves 2 and 4 reduces the probability of this wave count. Primary wave 2 lasted just two weeks. Primary wave 4 lasted nine weeks.
The lack of alternation further reduces the probability of this wave count. Both primary waves 2 and 4 are zigzags.
The cyan trend line is providing strong support. It is drawn from the start of cycle wave a to the low labelled primary wave 2 and extended out on a semi-log scale. Copy it over to the daily chart.
DAILY WAVE COUNT
Click chart to enlarge.
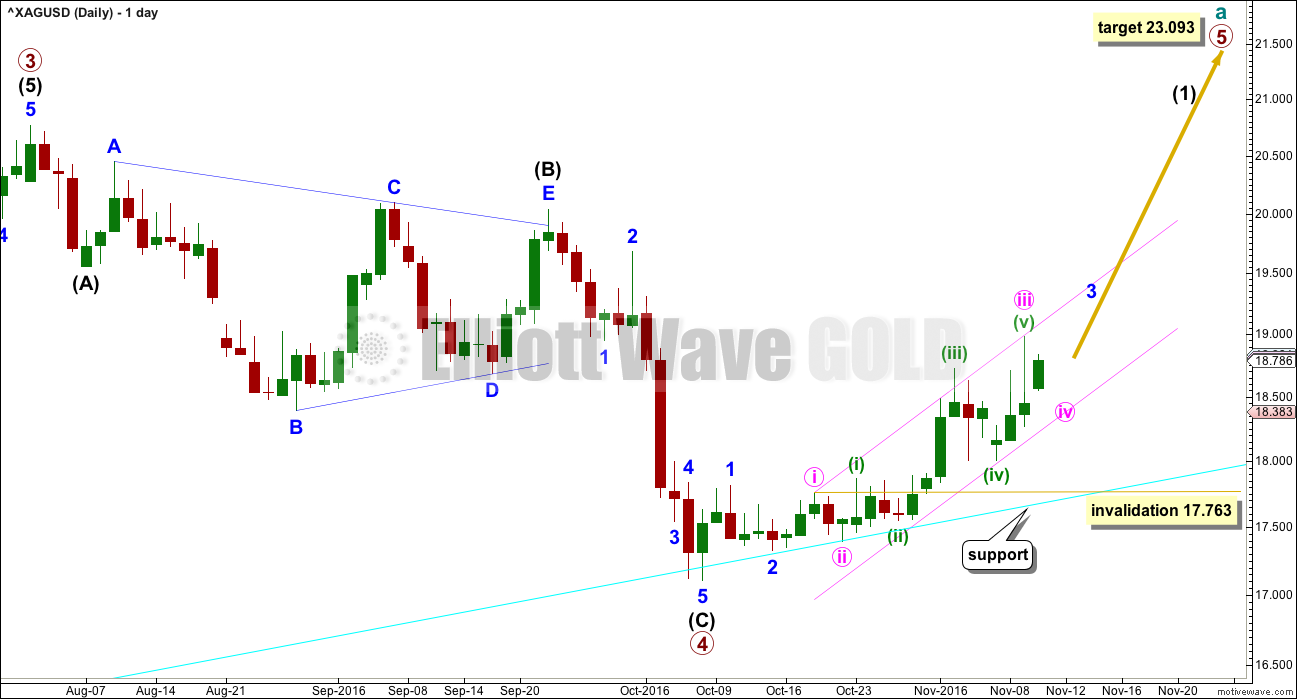
Primary wave 3 ends with a truncation. This slightly reduces the probability of this wave count. A truncation may occur after a movement that is “too far, too fast”, which is a description that may fit the upwards wave labelled intermediate wave (3).
At 23.093 primary wave 5 would reach equality in length with primary wave 3. Both primary waves 3 and 5 would be extended. If this target is wrong, it may be too low. Primary wave 5 may end with a blowoff top and be a very strong swift extended wave.
Within upwards movement, an impulse may be unfolding for intermediate wave (1). The middle of it for minor wave 3 may be incomplete.
It is possible that minute wave v of minor wave 3 may end with a very strong upwards movement. Look out for surprises to the upside for this wave count.
Minute wave iv may unfold over a few days of sideways movement. It may find support at the lower edge of the pink channel. Minute wave iv may not move into minute wave i price territory below 17.763.
ALTERNATE WEEKLY WAVE COUNT
Click chart to enlarge.
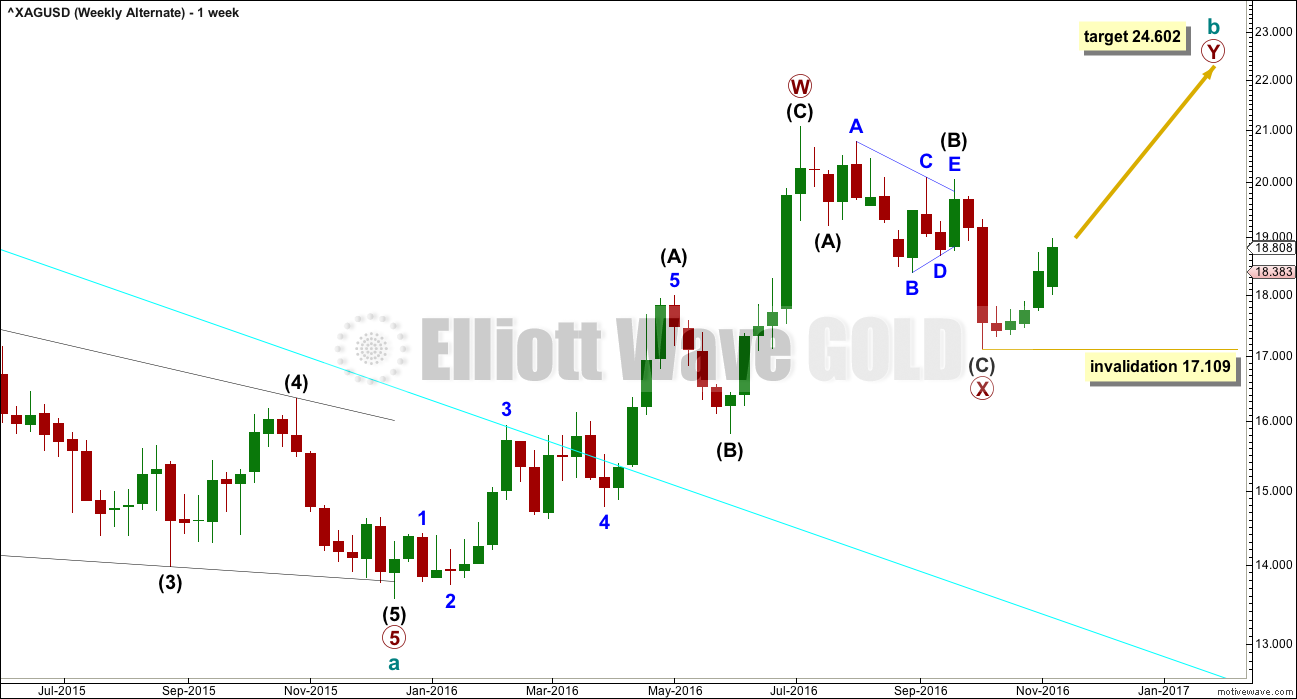
Upwards movement fits better as a completed zigzag than it will as an incomplete five, at this stage. At the daily and weekly chart level, this alternate wave count has a better fit and better look for Silver.
Within primary wave Y, no second wave correction nor B wave within a zigzag may move beyond its start below 17.109.
At 24.602 the second zigzag in the double labelled primary wave Y would reach equality in length with the first zigzag of primary wave W.
ALTERNATE DAILY WAVE COUNT
Click chart to enlarge.
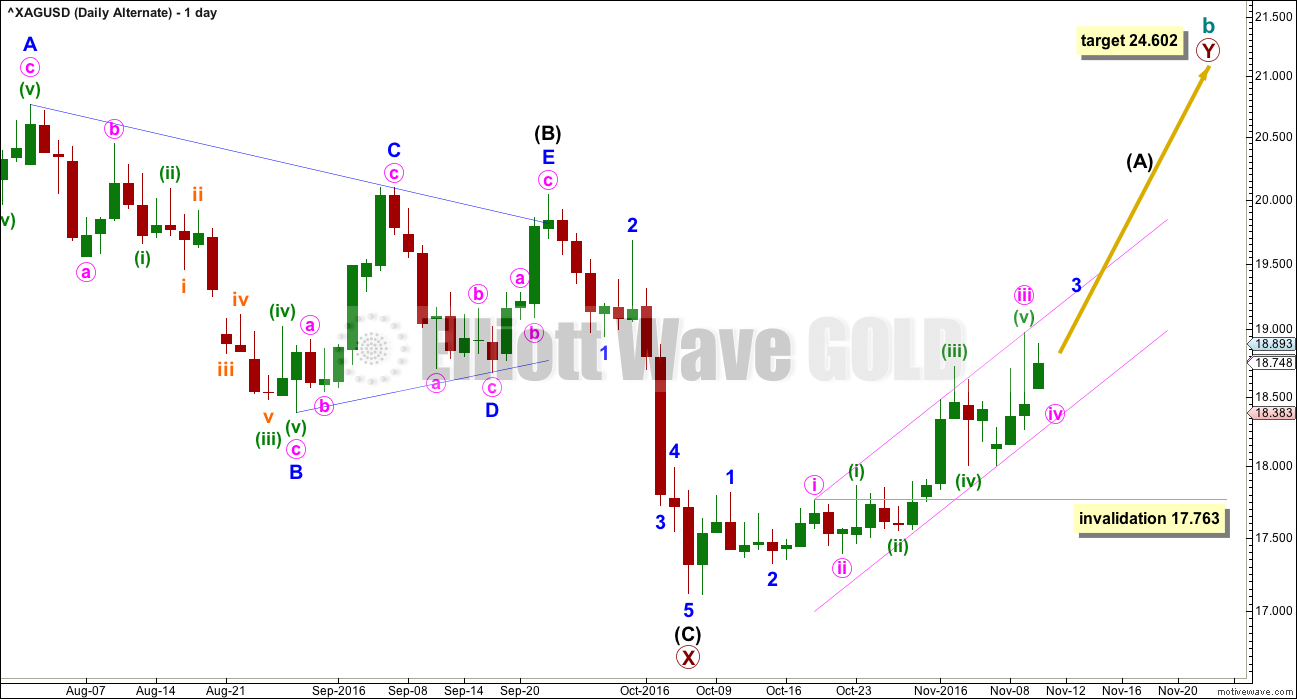
At 24.602 primary wave Y would be equal in length with primary wave W.
Primary wave Y should unfold as a zigzag. Within primary wave Y, intermediate wave (A) must be a five wave structure, most likely an impulse.
Within the impulse unfolding upwards, minute wave iv may not move into minute wave i price territory below 17.763.
In the short to mid term, this wave count expects the same direction next. These two wave counts will not diverge for several weeks.
TECHNICAL ANALYSIS
WEEKLY CHART
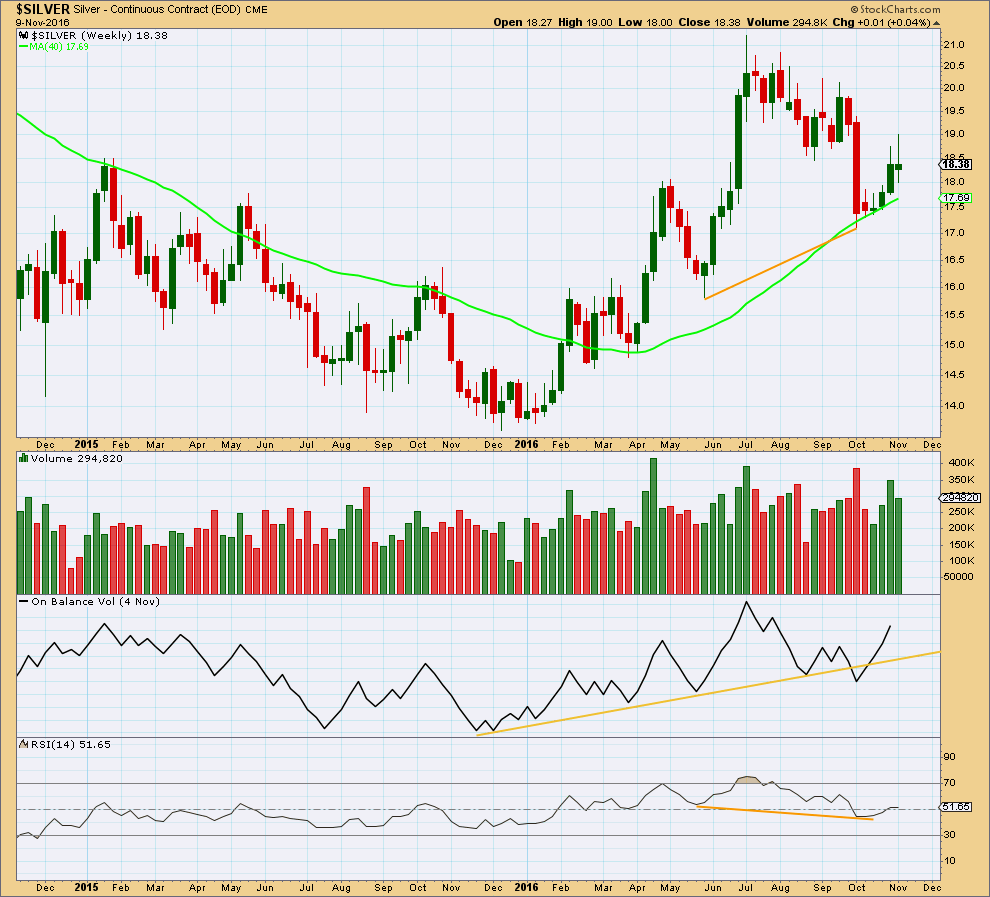
Click chart to enlarge. Chart courtesy of StockCharts.com.
Volume is increasing as price is rising. The rise in price is supported by volume.
On Balance Volume gave a bullish signal when it crossed back above the yellow support line.
At the last low there was bullish divergence between price and RSI (orange trend lines).
DAILY CHART
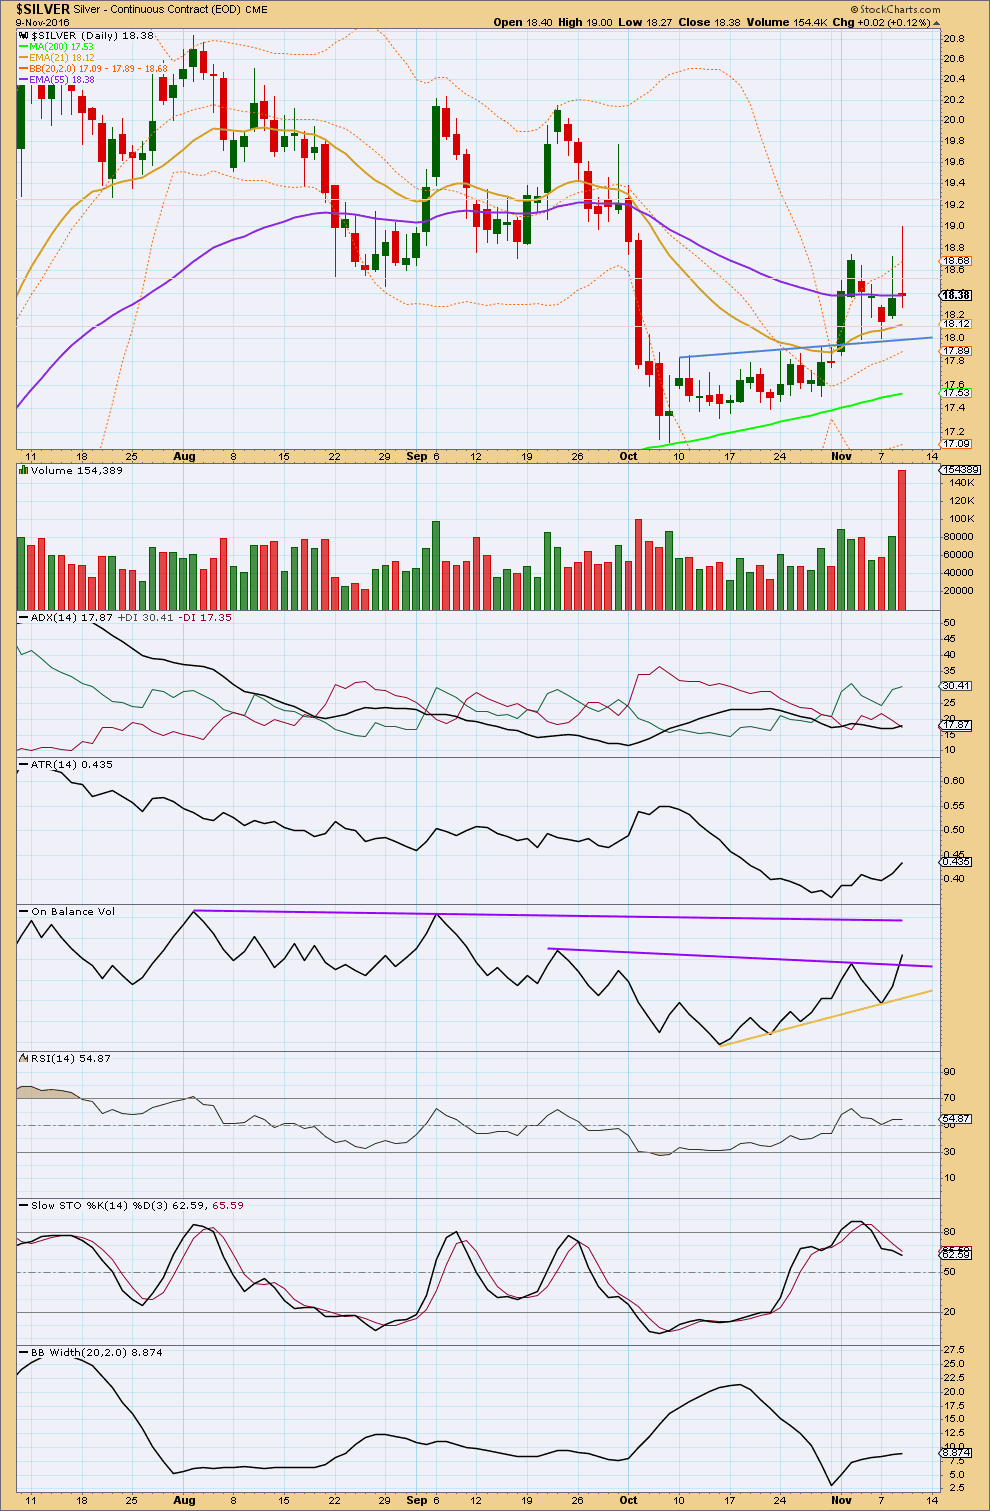
Click chart to enlarge. Chart courtesy of StockCharts.com.
The last session with very strong upwards movement has a strong volume spike. This looks like a typical blowoff top for Silver. A downwards and sideways reaction may be reasonably expected here.
ADX is increasing and is above 15. The +DX line is above the -DX line, so an upwards trend is indicated. ATR agrees; it is also increasing. Bollinger Bands agree; they are expanding. This market is trending upwards.
On Balance Volume has given a bullish signal today with a break above the purple resistance line.
RSI is not extreme. There is room for price to rise.
Stochastics is showing divergence with price after reaching overbought. Some small consolidation about here may be expected.
This analysis is published @ 04:22 a.m. EST.