
Another downwards week leaves all three Elliott wave counts valid, but one looking extremely unlikely.
Summary: Bears are still looking tired. Look out for a trend change for Silver. When price turns up, if it remains below 18.979, then a bear market for Silver will remain possible. A new high above 18.979 would confirm a new upwards wave, which should last about six months.
New updates to this analysis are in bold.
To see how this analysis fits into the bigger picture, see last monthly charts here.
Main and alternate wave counts this week are presented in order of probability.
MAIN WEEKLY WAVE COUNT
Click chart to enlarge.
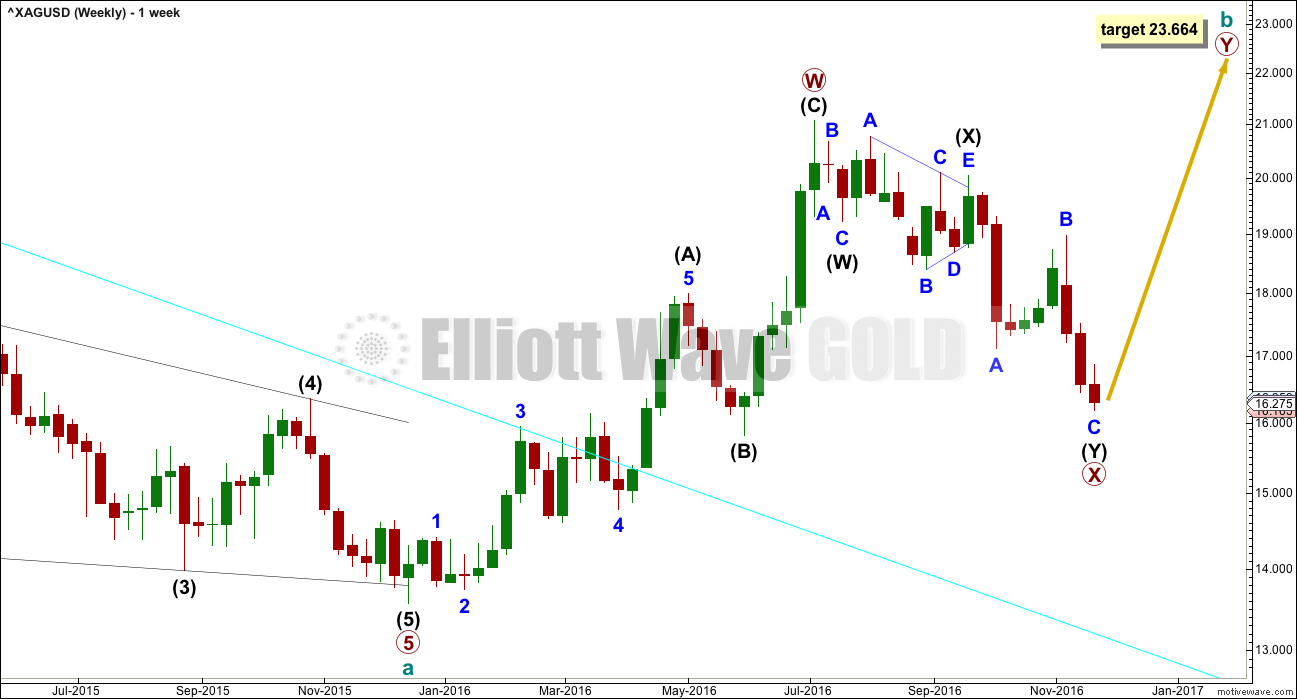
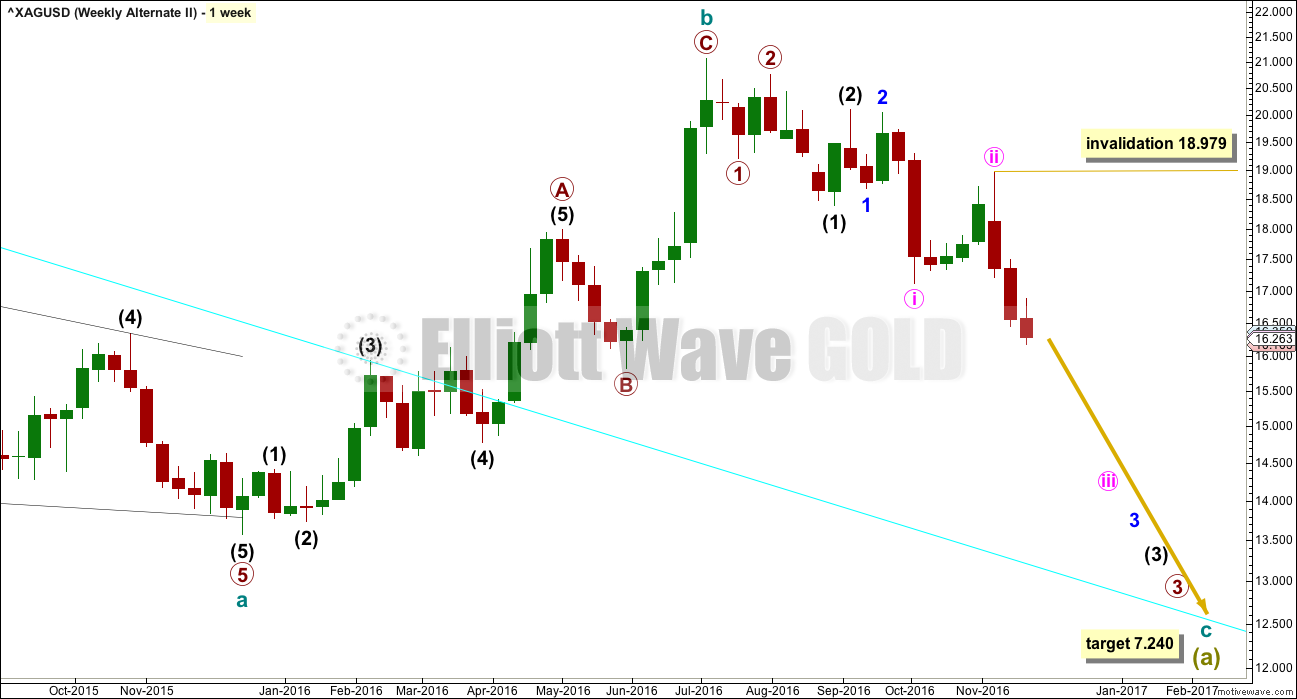
Upwards movement fits better as a completed zigzag than it will as an incomplete five, at this stage. At the daily and weekly chart level, this wave count has a better fit and better look for Silver.
Primary wave X may have continued lower as a double zigzag.
Cycle wave b may be either a double zigzag or a double combination. If it is a double zigzag, then primary wave Y may be about equal in length with primary wave W, which would give a target at 23.664. As primary wave X is at this stage not extremely deep, it looks more like an X wave within a double zigzag.
If primary wave X continues lower, then this target must also move correspondingly lower.
X waves within combinations are more often very deep. There is no rule stating a maximum limit for an X wave. They may make new price extremes beyond the start of the correction.
MAIN DAILY WAVE COUNT
Click chart to enlarge.
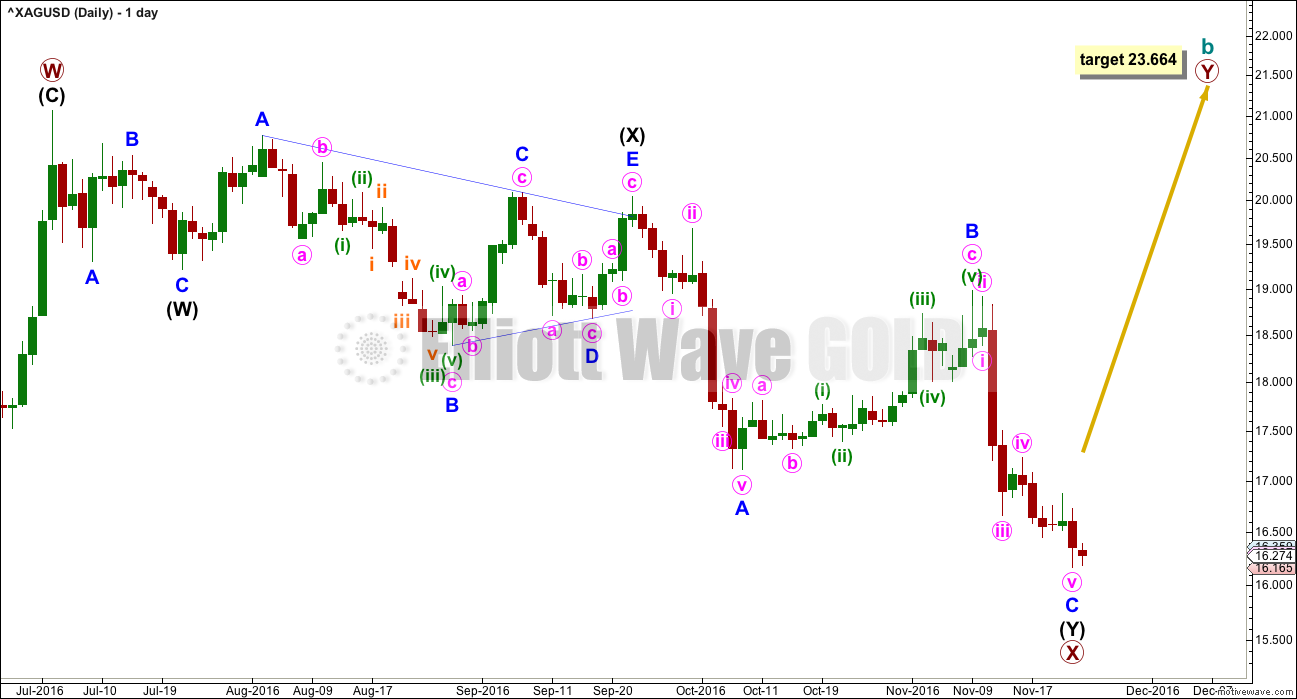
The structure of minor wave C may now be complete. This wave count expects a trend change either here or very soon indeed.
There is no Fibonacci ratio between minor waves A and C within intermediate wave (Y).
ALTERNATE WEEKLY WAVE COUNT
Click chart to enlarge.
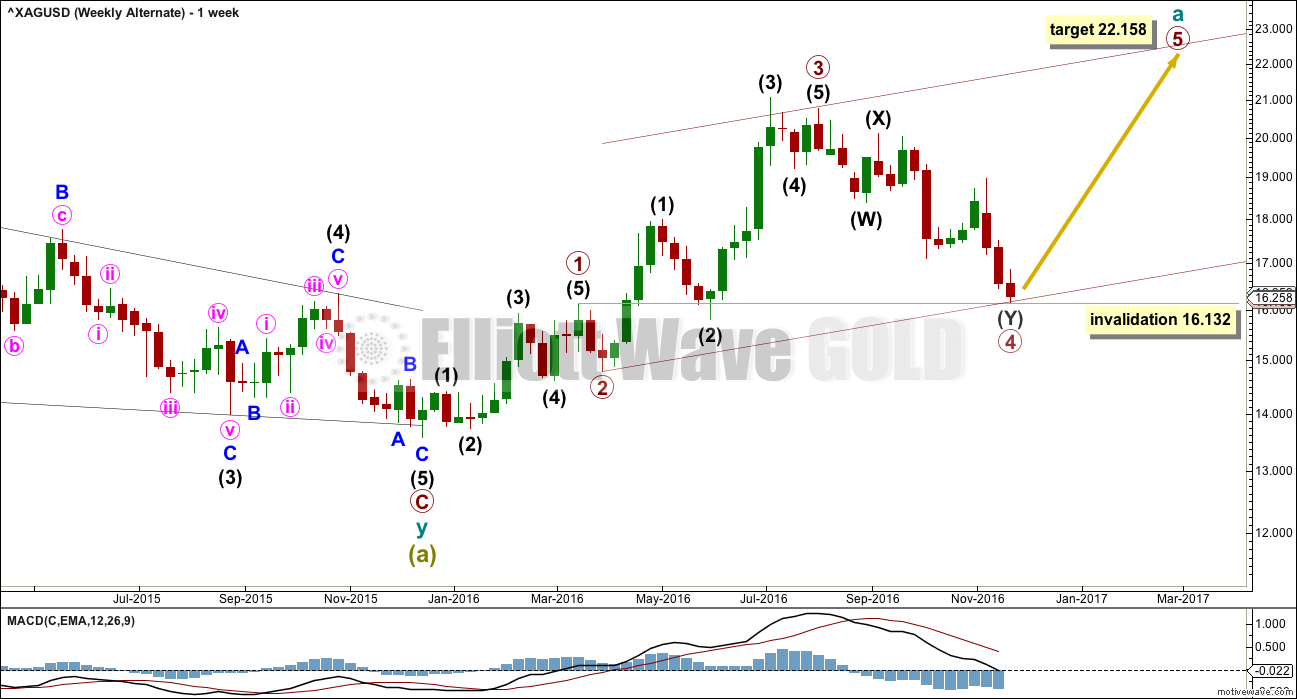
If a zigzag is unfolding upwards, then within it cycle wave a should subdivide as a five wave structure. So far primary waves 1 through to 4 may be complete.
If primary wave 4 continues lower, it may not move into primary wave 1 price territory below 16.132.
The disproportion between primary waves 2 and 4 reduces the probability of this wave count. Primary wave 2 lasted just two weeks. Primary wave 4 lasted 16 weeks.
The lack of alternation further reduces the probability of this wave count. Primary wave 2 is a single zigzag and primary wave 4 is a double zigzag.
This wave count remains technically possible this week, but it looks very wrong.
ALTERNATE DAILY WAVE COUNT
Click chart to enlarge.
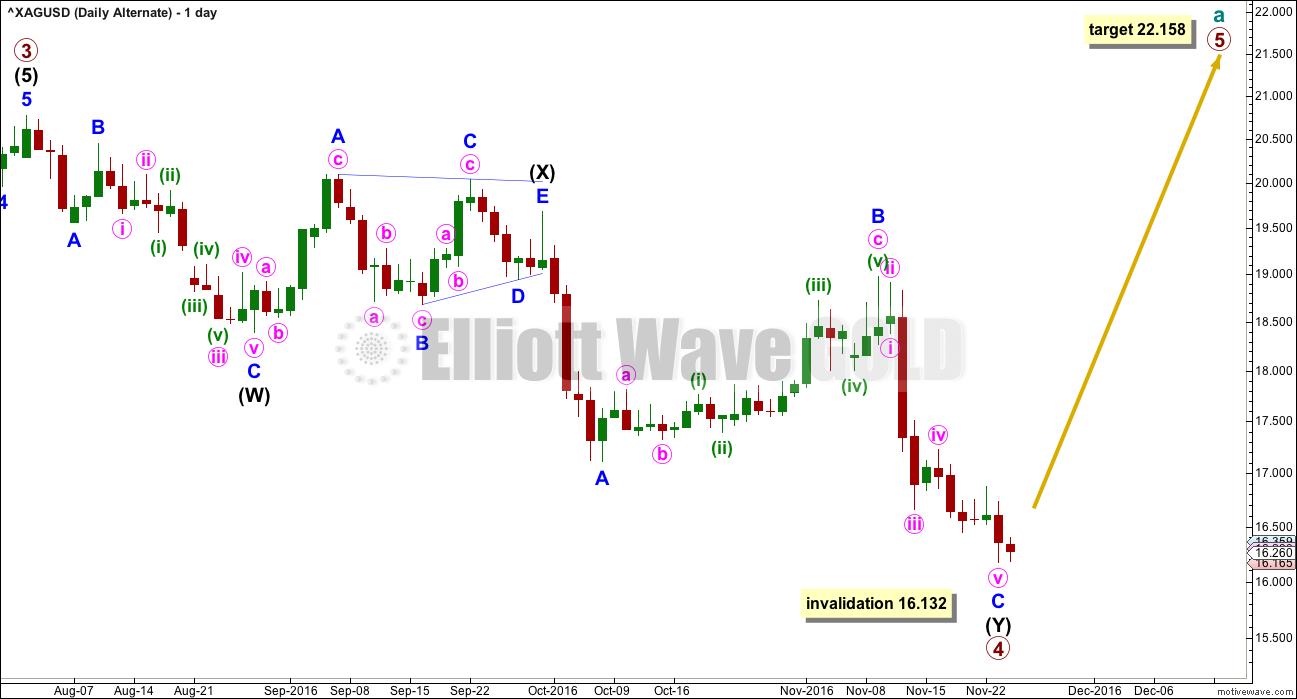
Primary wave 3 ends with a truncation. This slightly reduces the probability of this wave count. A truncation may occur after a movement that is “too far, too fast”, which is a description that may fit the upwards wave labelled intermediate wave (3).
At 22.158 primary wave 5 would reach equality in length with primary wave 3. Both primary waves 3 and 5 would be extended. If this target is wrong, it may be too low. Primary wave 5 may end with a blowoff top and be a very strong swift extended wave.
Primary wave 4 may be over here or very soon indeed. It may not move into primary wave 1 price territory below 16.132.
SECOND ALTERNATE WEEKLY WAVE COUNT
Click chart to enlarge.
It is also possible that cycle wave b is a complete zigzag and that downwards movement is the start of cycle wave c.
Unfortunately, because the main wave count has no lower invalidation point there can be no lower confirmation point for this alternate. Only structure would guide which wave count is more likely.
Within the middle of the third wave down, no second wave correction may move beyond the start of minute wave iii above 18.979. If this wave count is invalidated, then more confidence may be had in the first two wave counts.
It is judged that this alternate at this stage may be less likely. A series of overlapping first and second wave corrections ignores what looks like a triangle within this structure. Triangles may not be the sole corrective structure of a second wave.
Minute wave ii is much longer in duration than minor wave 2 and intermediate wave (2). The disproportion of this correction also reduces the probability of this wave count.
Technical weakness to current downwards movement is the main reason why this wave count is judged to be least likely.
If downwards movement continues and shows an increase in strength, then this wave count should be taken seriously. It is technically possible.
TECHNICAL ANALYSIS
WEEKLY CHART
Click chart to enlarge. Chart courtesy of StockCharts.com.
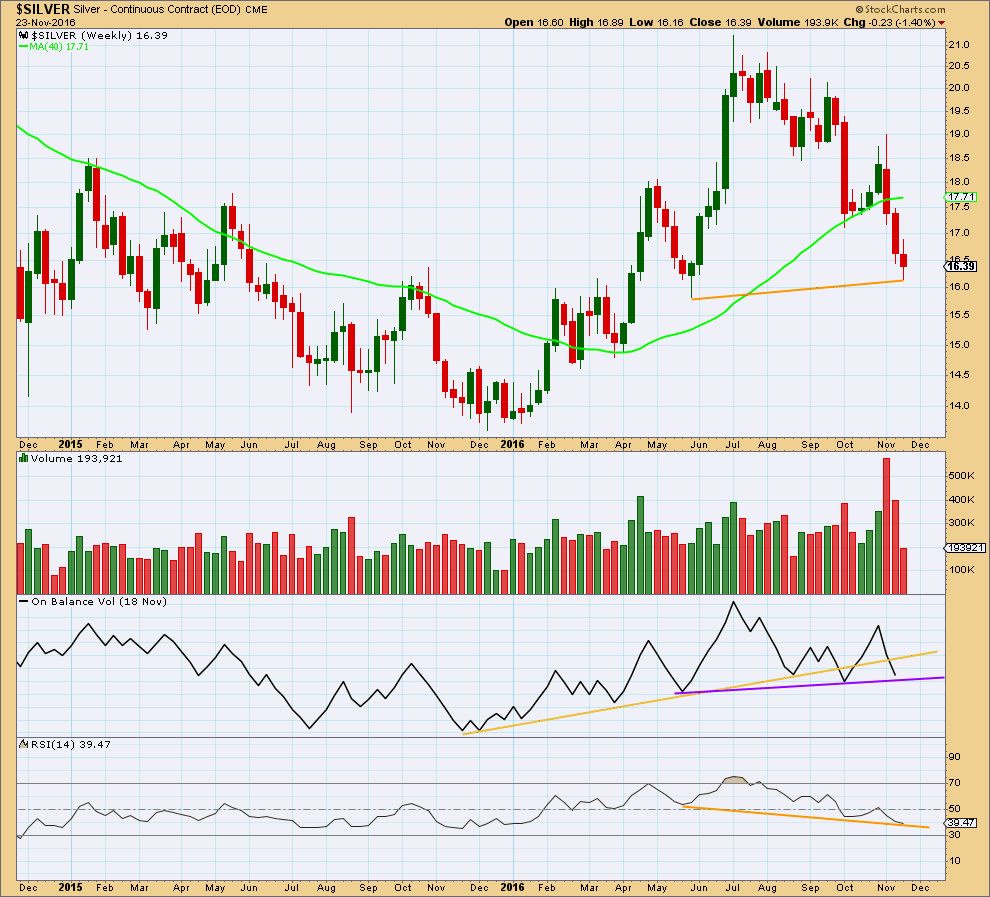
If the last session this week is also light in volume, then this week may close with reduced range and lighter volume. The fall in price is not supported by volume at the weekly chart level. This supports the first two Elliott wave counts.
A new trend line is drawn for On Balance Volume across the last two lows (purple). This may offer some support, but it does not have good technical significance.
There is still bullish divergence between RSI and price: price has made a higher low, but RSI has made a lower low. This indicates weakness in price. This supports the first two Elliott wave counts.
DAILY CHART
Click chart to enlarge. Chart courtesy of StockCharts.com.
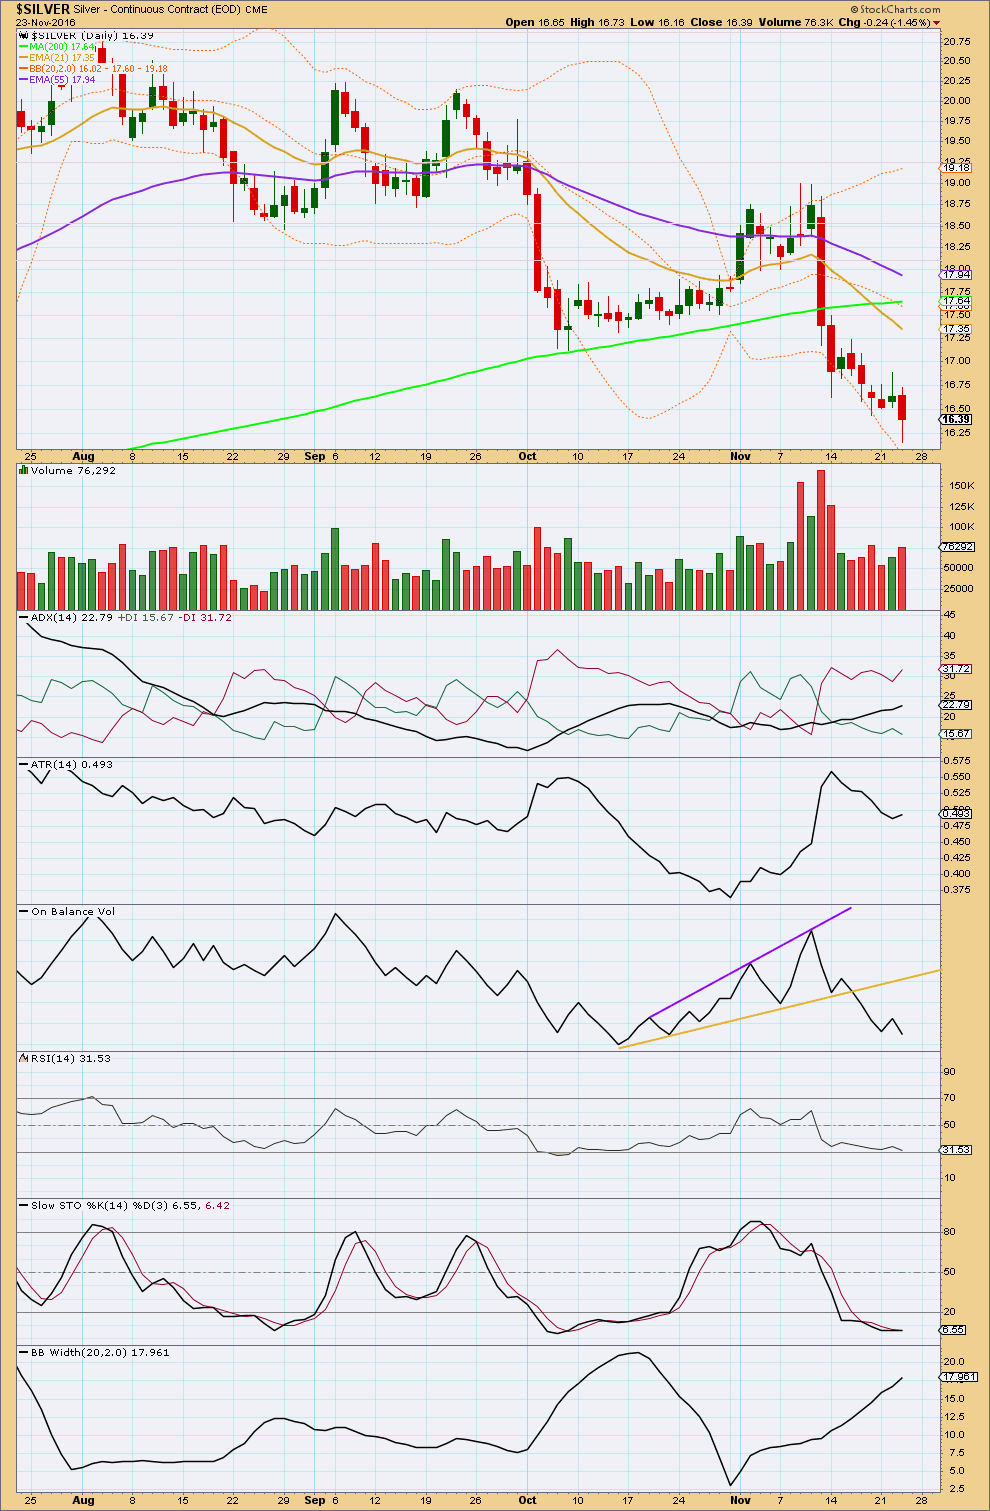
Yesterday’s session showed some increase in volume to support a further fall in price. This is bearish. The long lower wick is bullish.
ADX continues to increase and is not yet extreme. There is a downwards trend in place. The short term average is below the mid term and longer term averages, and both short and mid term are pointing downwards.
The longer term 200 day average is still pointing up. The longer term trend may still be up.
Bollinger Bands continue to widen supporting the downwards trend. During a trend Silver can remain close to the extreme range of Bollinger Bands for a reasonable time.
ATR is still overall declining this last week though. Bears are able to push price lower by a smaller and smaller range each day. They are tiring.
RSI is again reaching towards oversold, but it is not quite there. There is sill divergence between price and RSI between the lows of 6th and 7th of October and the 23rd of November: price has made lower lows, but RSI has failed to make new lows. This indicates weakness in price.
Stochastics is extreme and also exhibiting divergence with price. This trend looks mature now and should be expected to end soon.
Divergence is a warning; it is not a signal. This is a warning that downwards movement could be over here or soon and not a signal that price will turn here.
This analysis is published @ 10:37 p.m. EST.