
Price has broken out of a small consolidation upwards, not downwards. The wave count is changed.
Summary: An upwards trend is in place. The target is either 24.61 or 23.093. The invalidation point is 17.863.
New updates to this analysis are in bold.
To see how this analysis fits into the bigger picture, see last monthly charts here.
This analysis is presented with a main and alternate wave count. They are presented in the order they were developed, not in order of probability.
WEEKLY WAVE COUNT
Click chart to enlarge.
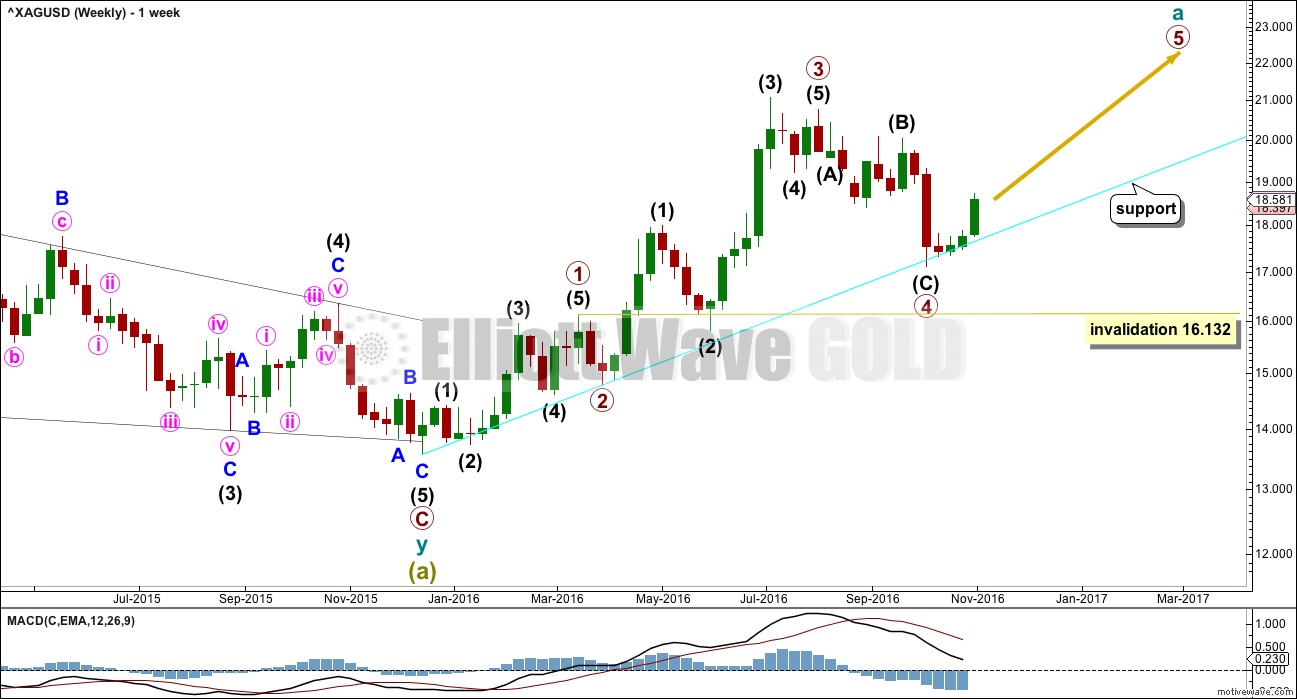
If a zigzag is unfolding upwards, then within it cycle wave a should subdivide as a five wave structure. So far primary waves 1 through to 3 may be complete, and primary wave 4 is very close to completion.
Primary wave 4 may not move into primary wave 1 price territory below 16.132.
The disproportion between primary waves 2 and 4 reduces the probability of this wave count. Primary wave 2 lasted just two weeks. Primary wave 4 lasted nine weeks.
The lack of alternation further reduces the probability of this wave count. Both primary waves 2 and 4 are zigzags.
The cyan trend line is providing strong support. It is drawn from the start of cycle wave a to the low labelled primary wave 2 and extended out on a semi-log scale. Copy it over to the daily chart.
DAILY WAVE COUNT
Click chart to enlarge.
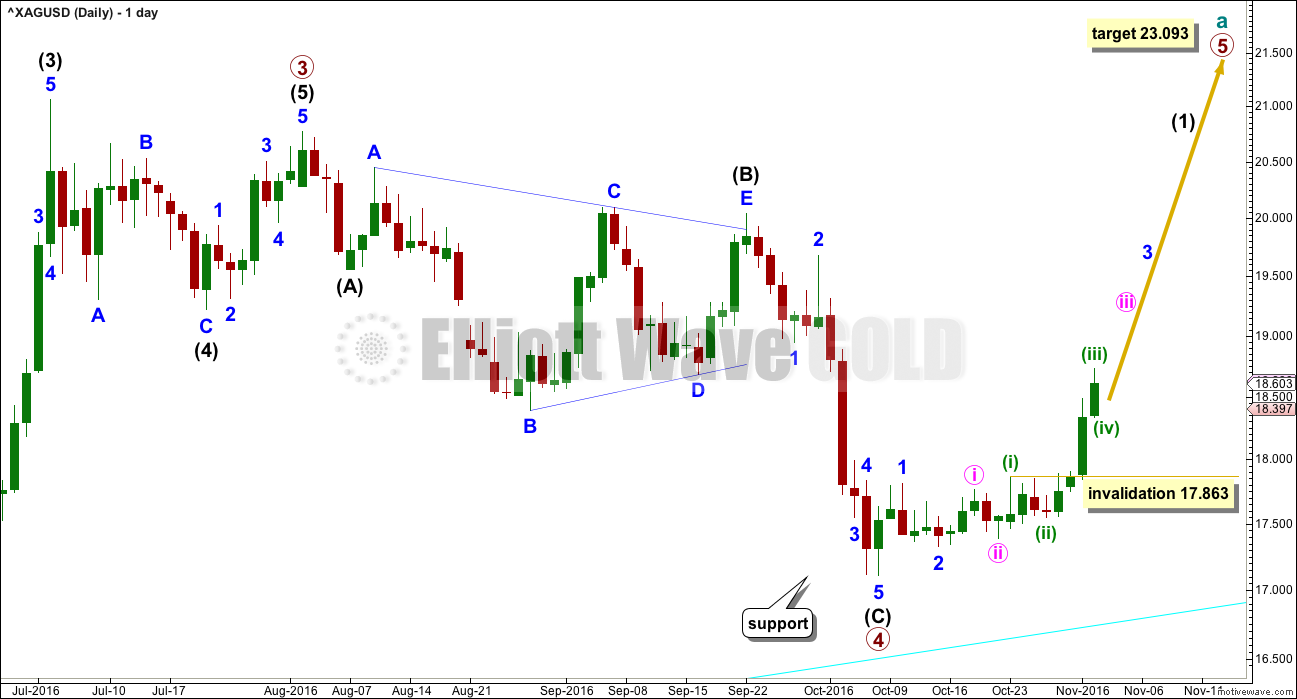
Primary wave 3 ends with a truncation. This slightly reduces the probability of this wave count. A truncation may occur after a movement that is “too far, too fast”, which is a description that may fit the upwards wave labelled intermediate wave (3).
Primary wave 4 may complete as a zigzag. Within primary wave 4, intermediate wave (B) fits as a running contracting triangle.
At 23.093 primary wave 5 would reach equality in length with primary wave 3. Both primary waves 3 and 5 would be extended. If this target is wrong, it may be too low. Primary wave 5 may end with a blowoff top and be a very strong swift extended wave.
Within upwards movement, an impulse may be unfolding for intermediate wave (1). Minuette wave (iv) may not move into minuette wave (i) price territory below 17.863.
ALTERNATE WEEKLY WAVE COUNT
Click chart to enlarge.
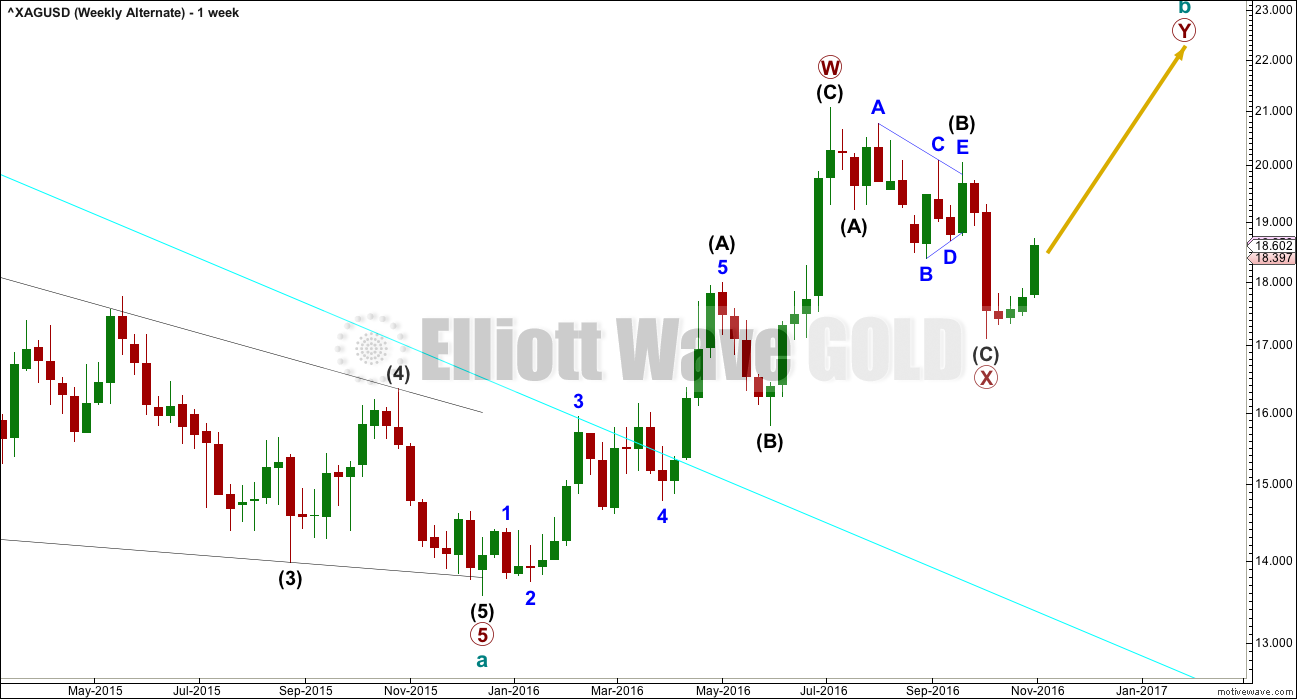
Upwards movement fits better as a completed zigzag than it will as an incomplete five, at this stage. At the daily and weekly chart level, this alternate wave count has a better fit and better look for Silver.
ALTERNATE DAILY WAVE COUNT
Click chart to enlarge.
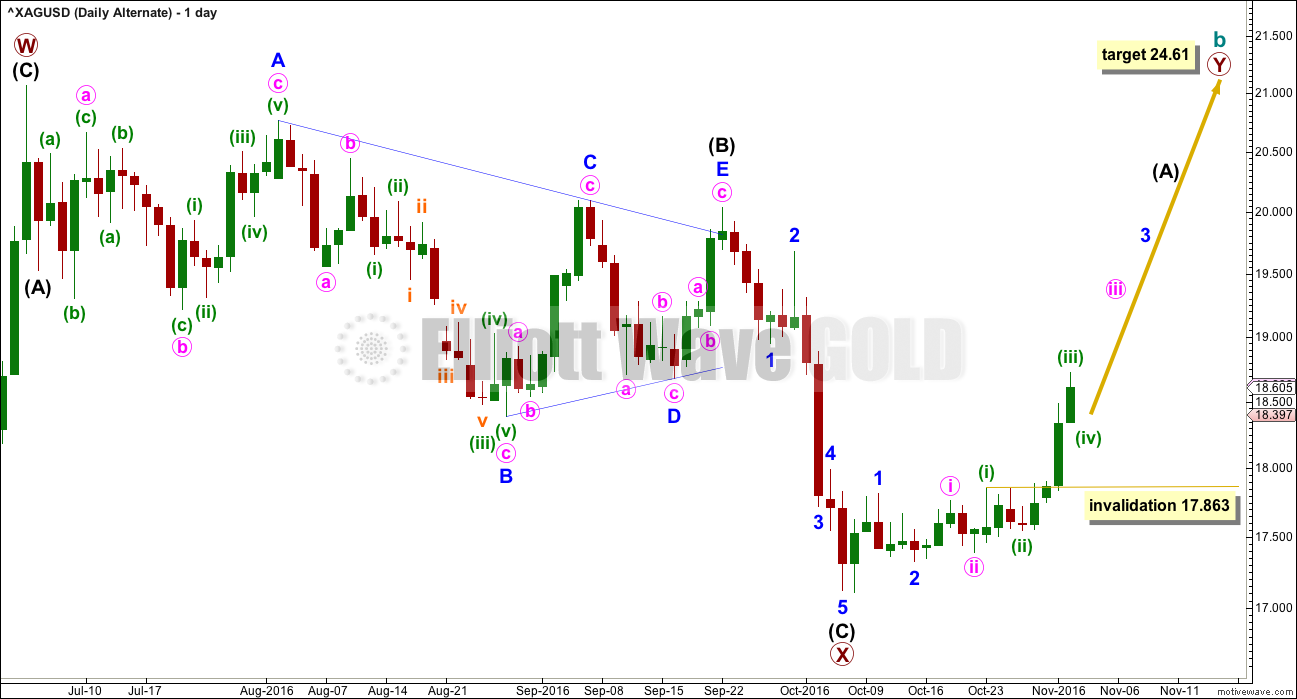
At 24.61 primary wave Y would be equal in length with primary wave W.
Primary wave Y should unfold as a zigzag. Within primary wave Y, intermediate wave (A) must be a five wave structure, most likely an impulse.
Within the impulse unfolding upwards, minuette wave (iv) may not move into minuette wave (i) price territory below 17.863.
In the short to mid term, this wave count expects the same direction next. These two wave counts will not diverge for several weeks.
TECHNICAL ANALYSIS
WEEKLY CHART
Click chart to enlarge. Chart courtesy of StockCharts.com.
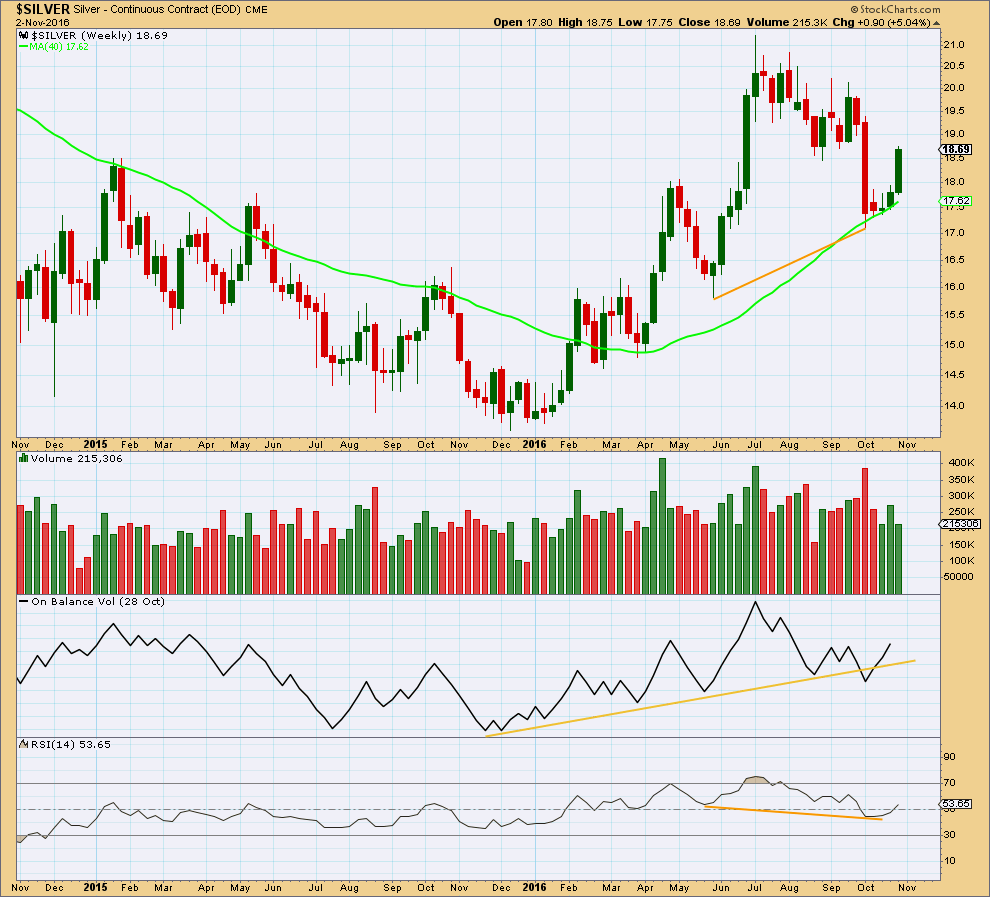
Last week saw upwards movement with strongly increased volume. This supports the rise in price.
On Balance Volume gave a bullish signal when it crossed back above the yellow support line.
At the last low there was bullish divergence between price and RSI (orange trend lines).
DAILY CHART
Click chart to enlarge. Chart courtesy of StockCharts.com.
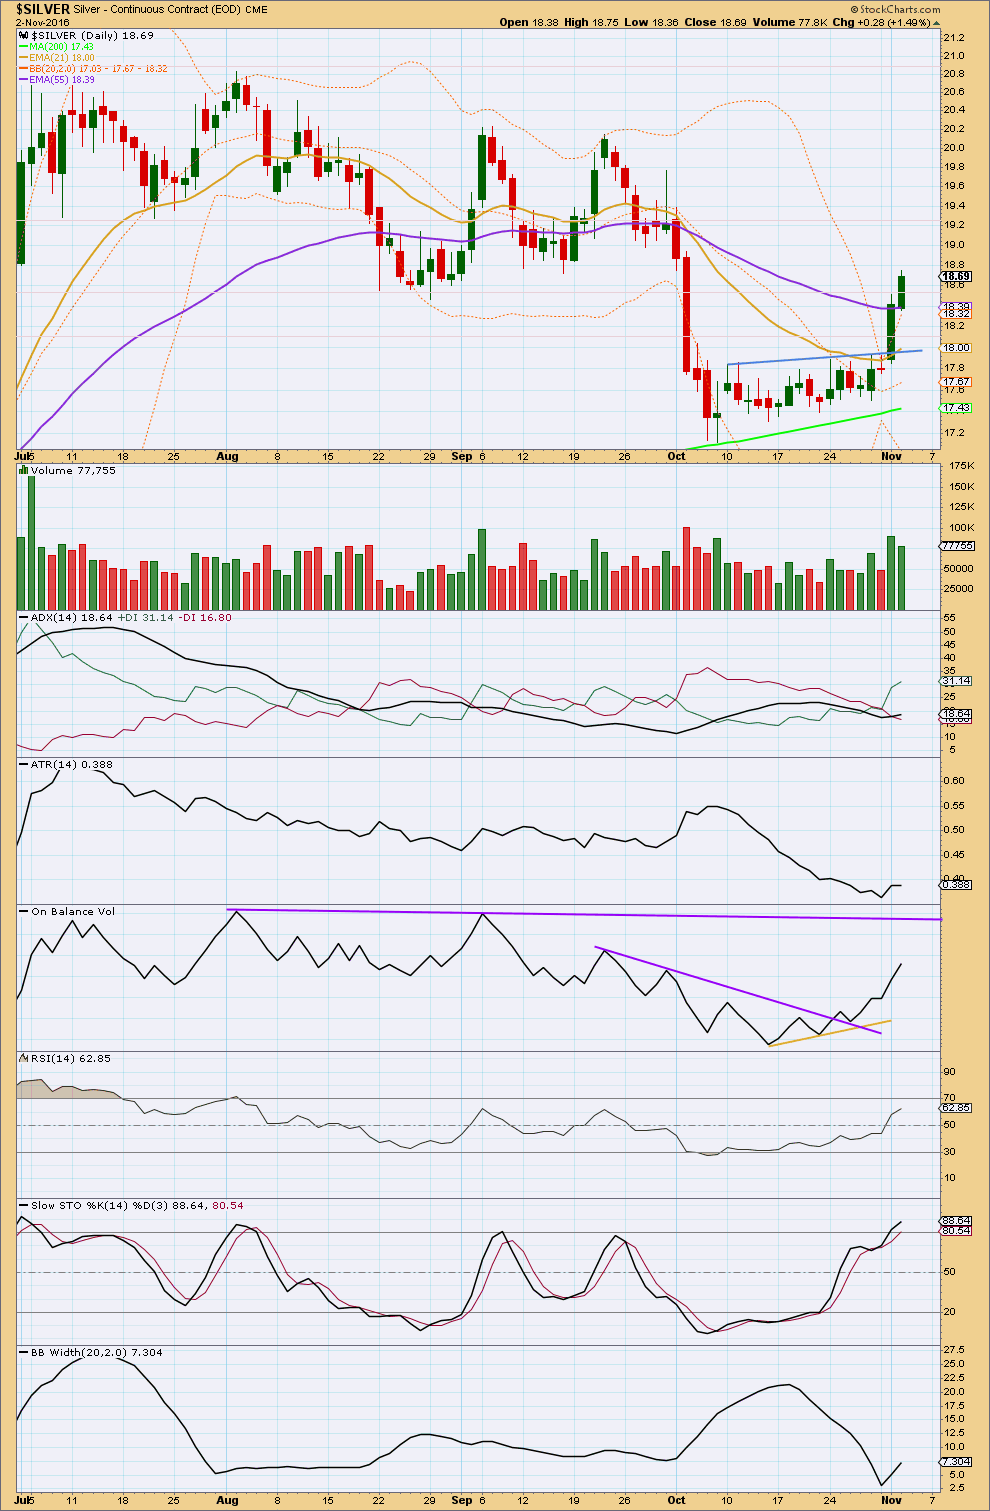
Last analysis expected a small pennant pattern was unfolding, but price has broken above the upper edge of that pattern and not the lower edge. The breakout was accompanied by a strong increase in volume to support the rise in price.
Price is above the upper edge of the Bollinger Bands. Some small reaction for a day or so may bring it back, but this may not happen immediately. Silver can remain outside its Bollinger Bands for a few days during a strong trend.
The slight decline in volume today indicates some weakness for bulls; a small reaction may resolve this.
On Balance Volume is bullish with breaks above both support lines. The next line for resistance is some distance away.
ADX indicates an upwards trend, ATR may be beginning to increase and so agree, and Bollinger Bands are widening. It seems reasonable to conclude an upwards trend is beginning.
RSI is not yet extreme. There is further room for price to rise.
Stochastics is only now moving into extreme. Only when it stays extreme for some time and then exhibits some divergence with price may a high be in place.
This analysis is published @ 12:26 a.m. EST.