
A new low below 16.652 confirmed a more bearish second alternate Elliott wave count and invalidated the first two Elliott wave counts.
Summary: A bear flag pattern completed. The target using the measure rule is 14.00.
New updates to this analysis are in bold.
To see how this analysis fits into the bigger picture, see last monthly charts here.
MAIN WEEKLY WAVE COUNT
Click chart to enlarge.
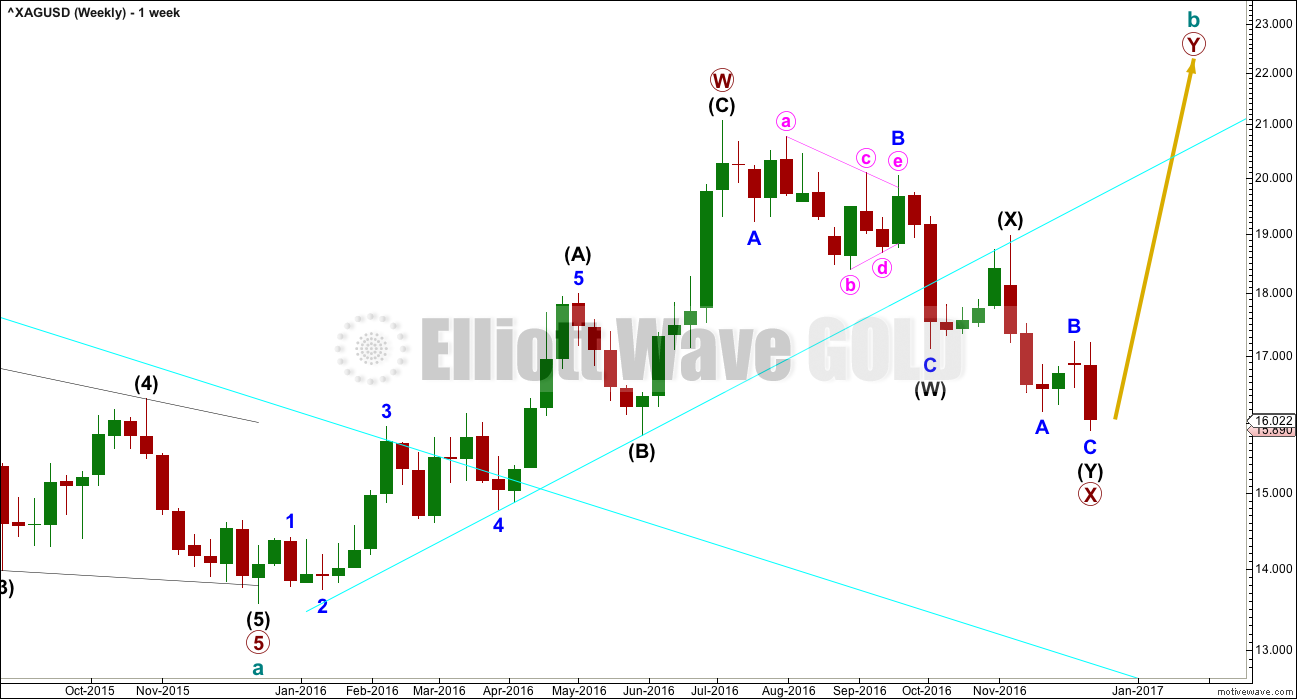
Upwards movement fits better as a completed zigzag than it will as an incomplete five, at this stage. At the daily and weekly chart level, this wave count has a better fit and better look for Silver.
Primary wave X may have continued lower as a double zigzag.
Cycle wave b may be either a double zigzag or a double combination. If it is a double zigzag, then primary wave Y may be about equal in length with primary wave W.
If primary wave X continues lower, then this target must also move correspondingly lower.
X waves within combinations are more often very deep. There is no rule stating a maximum limit for an X wave. They may make new price extremes beyond the start of the correction.
MAIN DAILY WAVE COUNT
Click chart to enlarge.
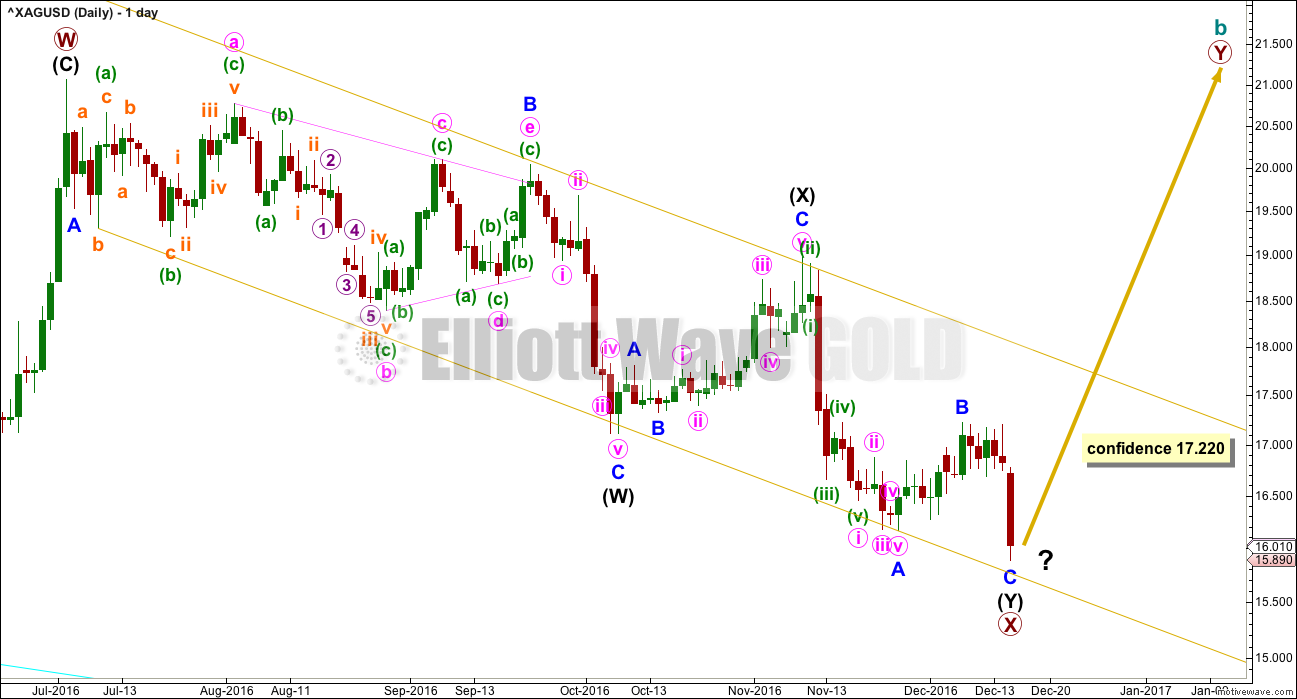
At this stage, there is no indication of a reversal, so this wave count requires a new high above 17.220 for confidence.
When a reversal is indicated, then a target may be calculated. Price may continue lower while it remains below 17.220.
If price continues lower, then at 15.481 minor wave C would reach 0.618 the length of minor wave A.
ALTERNATE WEEKLY WAVE COUNT
Click chart to enlarge.
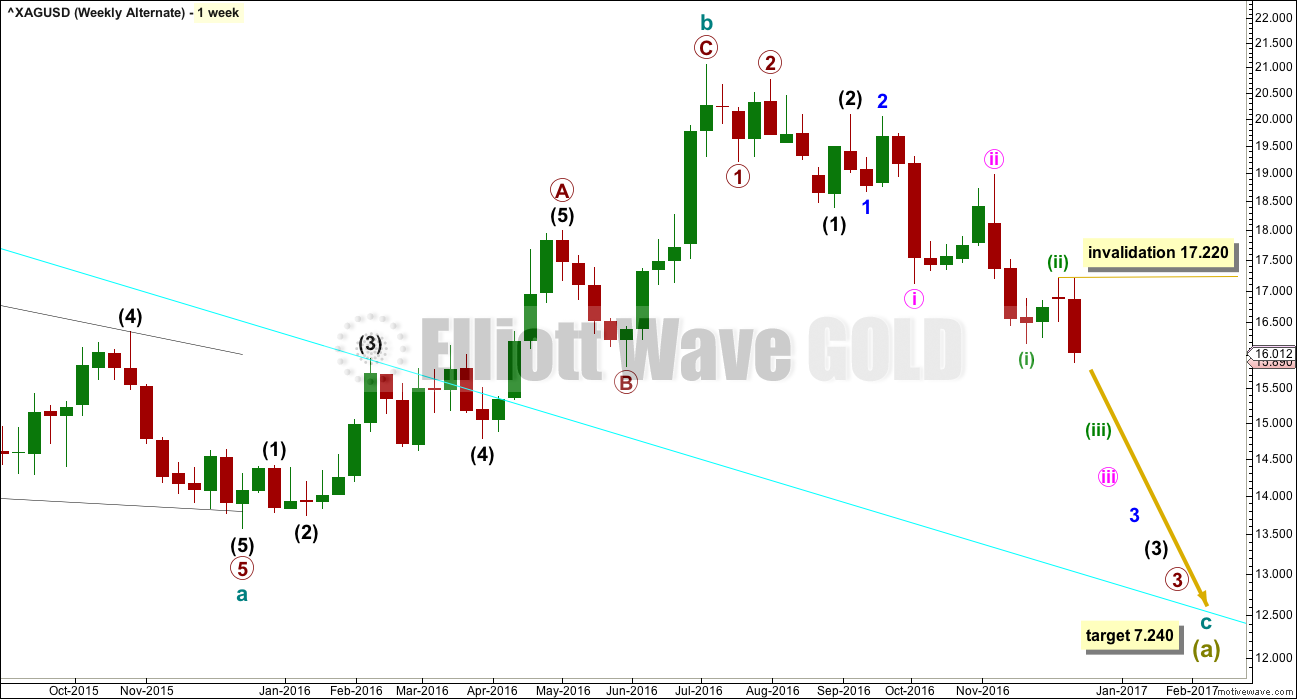
This wave count was the second alternate in last analysis.
This week it is the only alternate.
It is possible that cycle wave b is a complete zigzag and that downwards movement is the start of cycle wave c.
At this stage, a new low below 16.652 has added some confidence to this wave count.
Within the middle of the third wave down, no second wave correction may move beyond the start of minuette wave (iii) above 17.220.
It is judged that this alternate at this stage may still be less likely. A series of overlapping first and second wave corrections ignores what looks like a triangle within this structure. Triangles may not be the sole corrective structure of a second wave.
Minute wave ii is much longer in duration than minor wave 2 and intermediate wave (2). The disproportion of this correction also reduces the probability of this wave count.
If downwards movement continues and shows an increase in strength, then this wave count should be taken seriously. It is technically possible.
ALTERNATE DAILY WAVE COUNT
Click chart to enlarge.
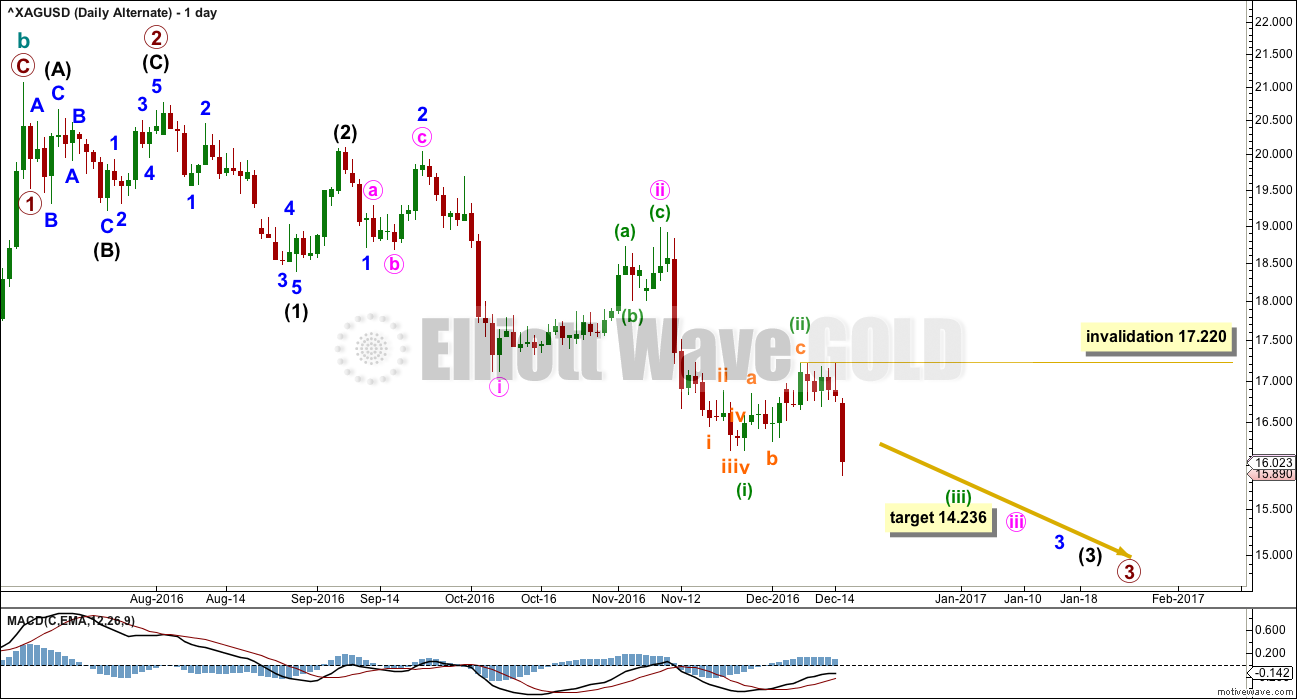
There would now be four overlapping first and second waves within a new downwards trend if this wave count is correct. A large increase in downwards momentum would be expected. The small divergence at the last low labelled minuette wave (i) should be quickly overcome if this wave count is correct.
At 14.236 minute wave iii would reach 2.618 the length of minute wave i.
TECHNICAL ANALYSIS
WEEKLY CHART
Click chart to enlarge. Chart courtesy of StockCharts.com.
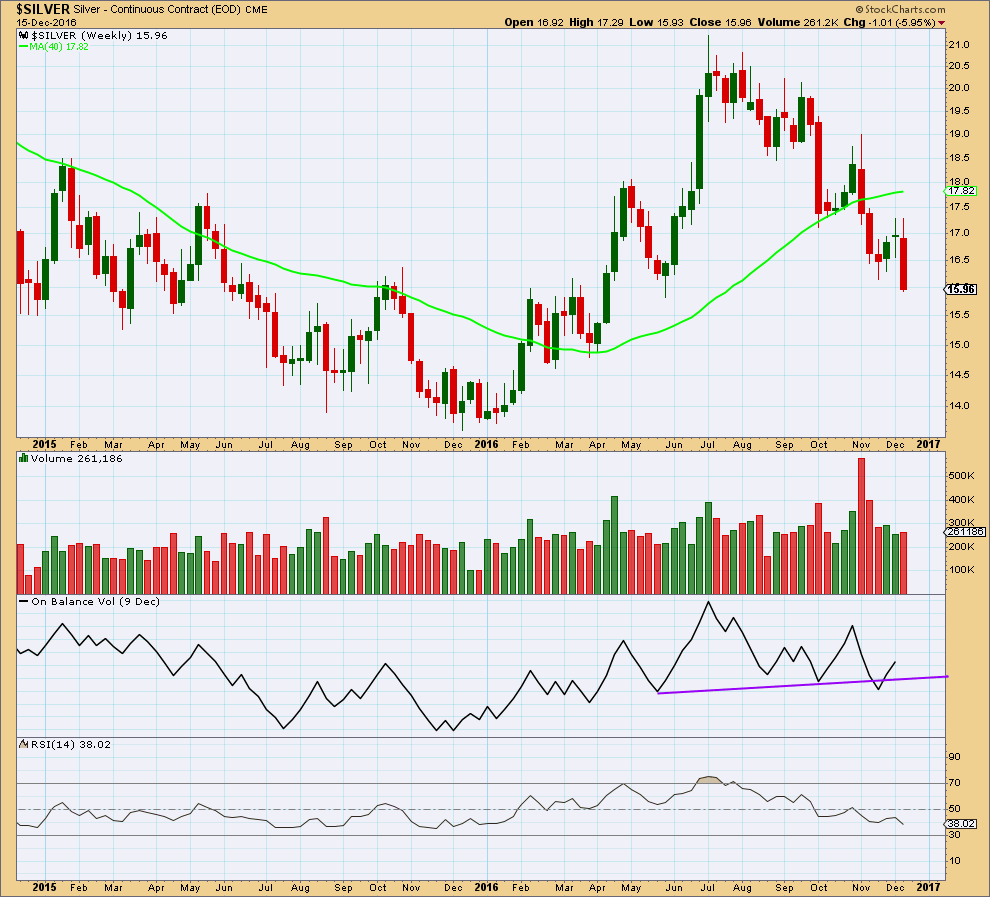
A downwards week so far shows some increase in volume beyond last week. But unless Friday’s volume is very strong, it will still be relatively light.
So far there is some support for the downwards movement from price this week.
On Balance Volume last week moved higher with price. It is likely to turn down this week. If it is very deep, it may find support at the purple trend line.
RSI is moving lower with price. RSI is not yet oversold. There is room for price to keep falling here.
DAILY CHART
Click chart to enlarge. Chart courtesy of StockCharts.com.
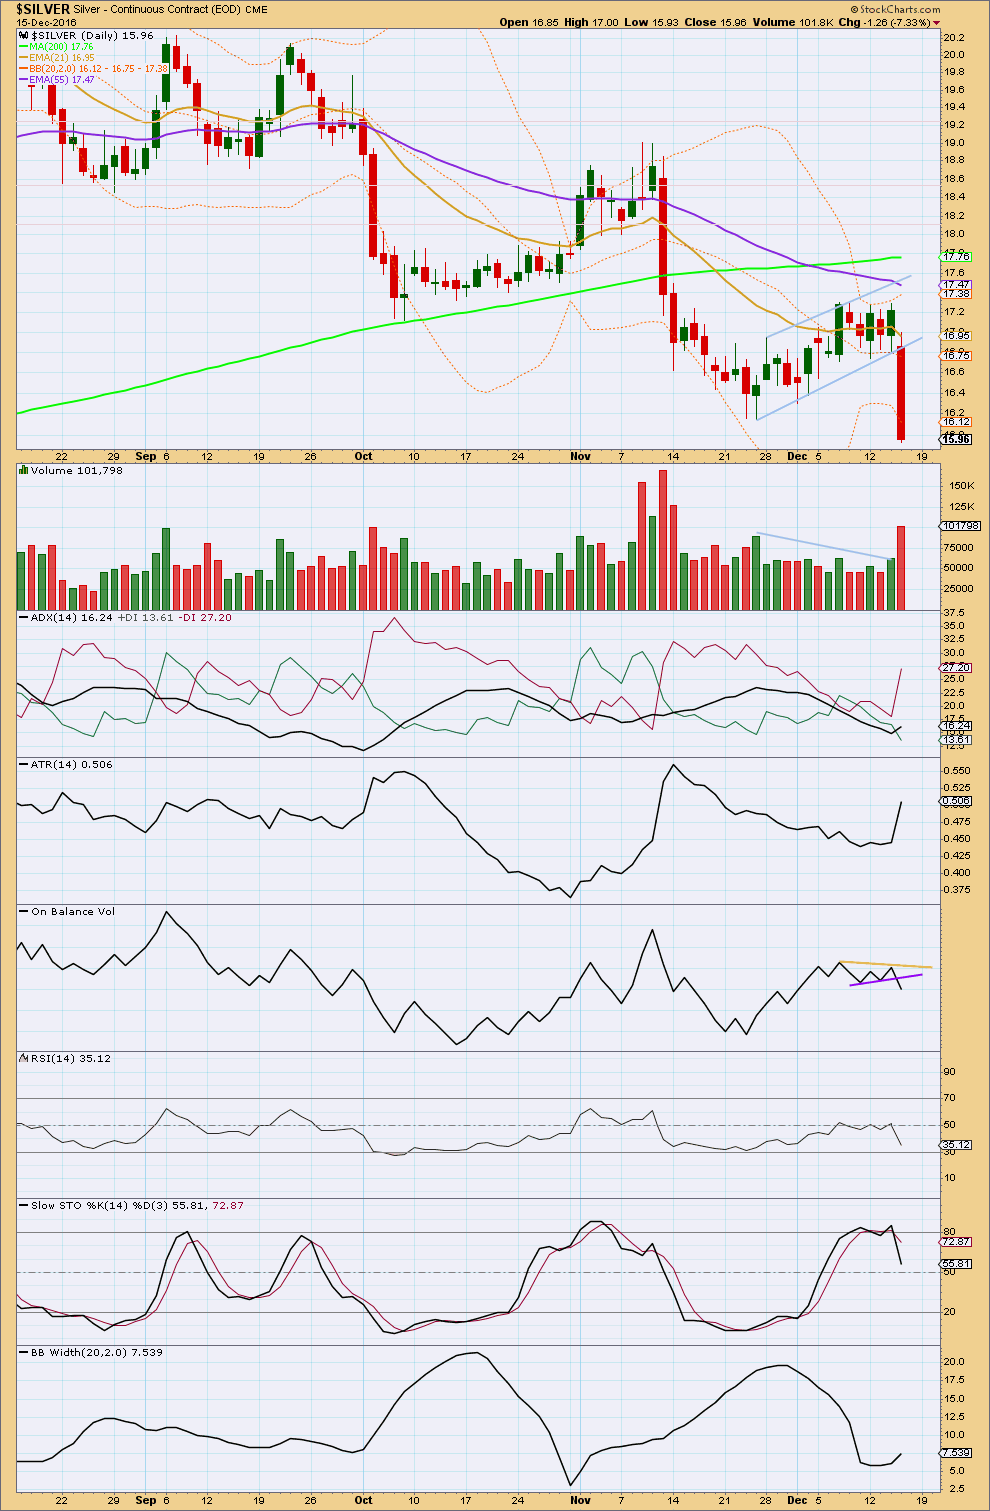
A bear flag pattern completed and price broke out of the pattern downwards. Using the measured rule, a target would be about 14.00.
The breakout has come with a strong increase in volume to support it.
ADX today indicates a downwards trend. ATR is increasing, so it agrees. Bollinger Bands are widening; they also agree. This market is trending downwards.
RSI is not yet extreme. There is room for this trend to move lower.
Stochastics is not yet extreme.
On Balance Volume has broken below support. This is a bearish signal.
This analysis is published @ 11:41 p.m. EST.