
Upwards movement was expected for Silver.
Price has mostly moved sideways.
Summary: A new high above 18.979 would invalidate the alternate Elliott wave count and confirm a trend change for Silver. It will remain possible that Silver is still in a bear market while price remains below this point.
New updates to this analysis are in bold.
To see how this analysis fits into the bigger picture, see last monthly charts here.
Main and alternate wave counts this week are presented in order of probability.
MAIN WEEKLY WAVE COUNT
Click chart to enlarge.
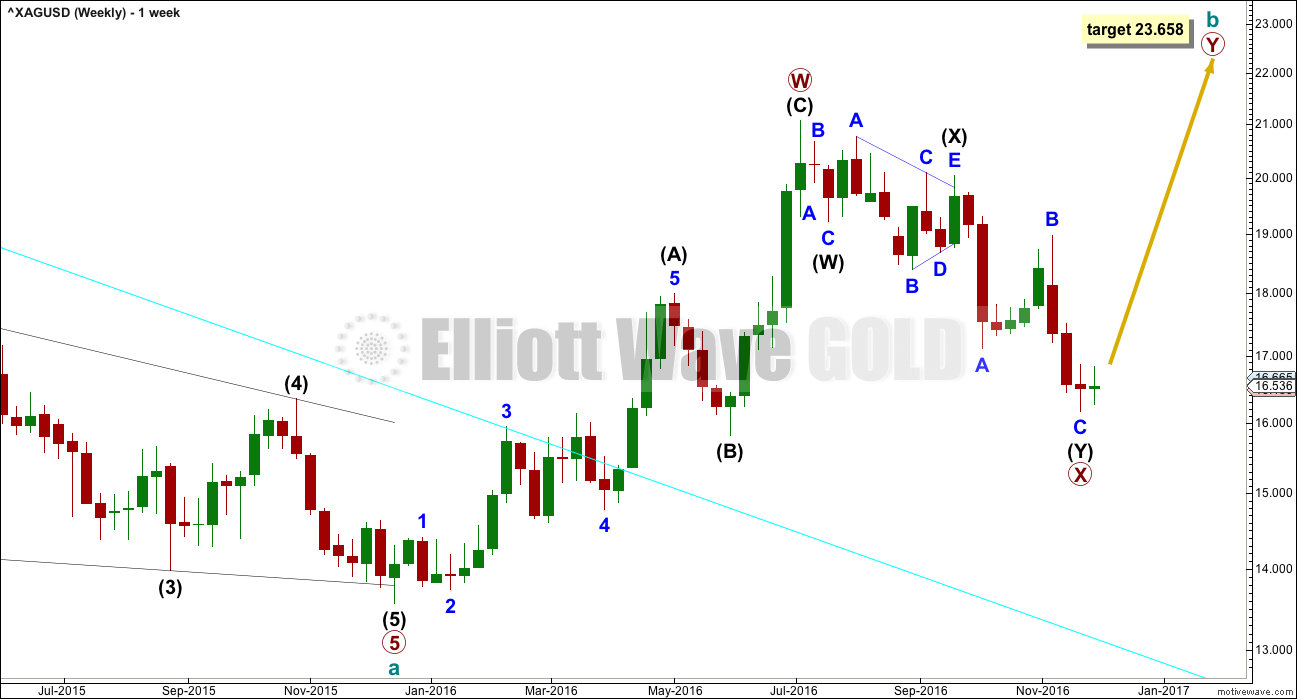
Upwards movement fits better as a completed zigzag than it will as an incomplete five, at this stage. At the daily and weekly chart level, this wave count has a better fit and better look for Silver.
Primary wave X may have continued lower as a double zigzag.
Cycle wave b may be either a double zigzag or a double combination. If it is a double zigzag, then primary wave Y may be about equal in length with primary wave W, which would give a target at 23.658. As primary wave X is at this stage not extremely deep, it looks more like an X wave within a double zigzag.
If primary wave X continues lower, then this target must also move correspondingly lower.
X waves within combinations are more often very deep. There is no rule stating a maximum limit for an X wave. They may make new price extremes beyond the start of the correction.
MAIN DAILY WAVE COUNT
Click chart to enlarge.
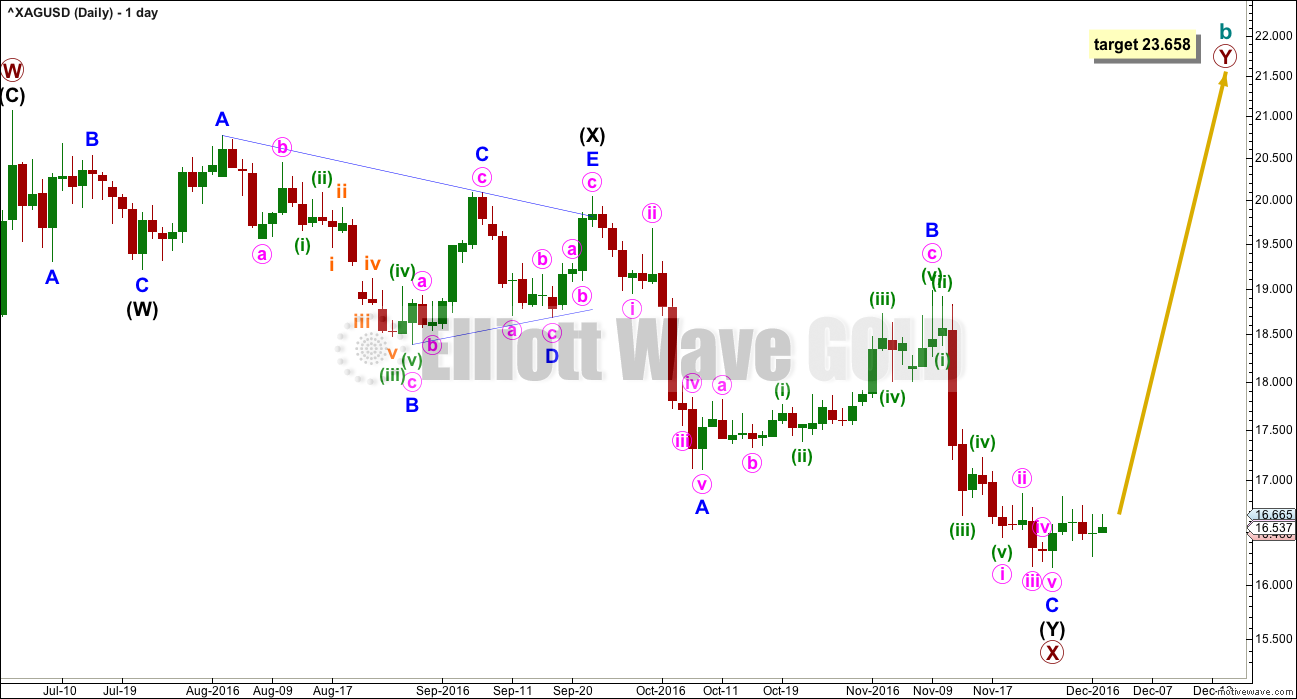
The structure of minor wave C may now be complete. This wave count expects a trend change either here or very soon indeed.
There is no Fibonacci ratio between minor waves A and C within intermediate wave (Y).
ALTERNATE WEEKLY WAVE COUNT
Click chart to enlarge.
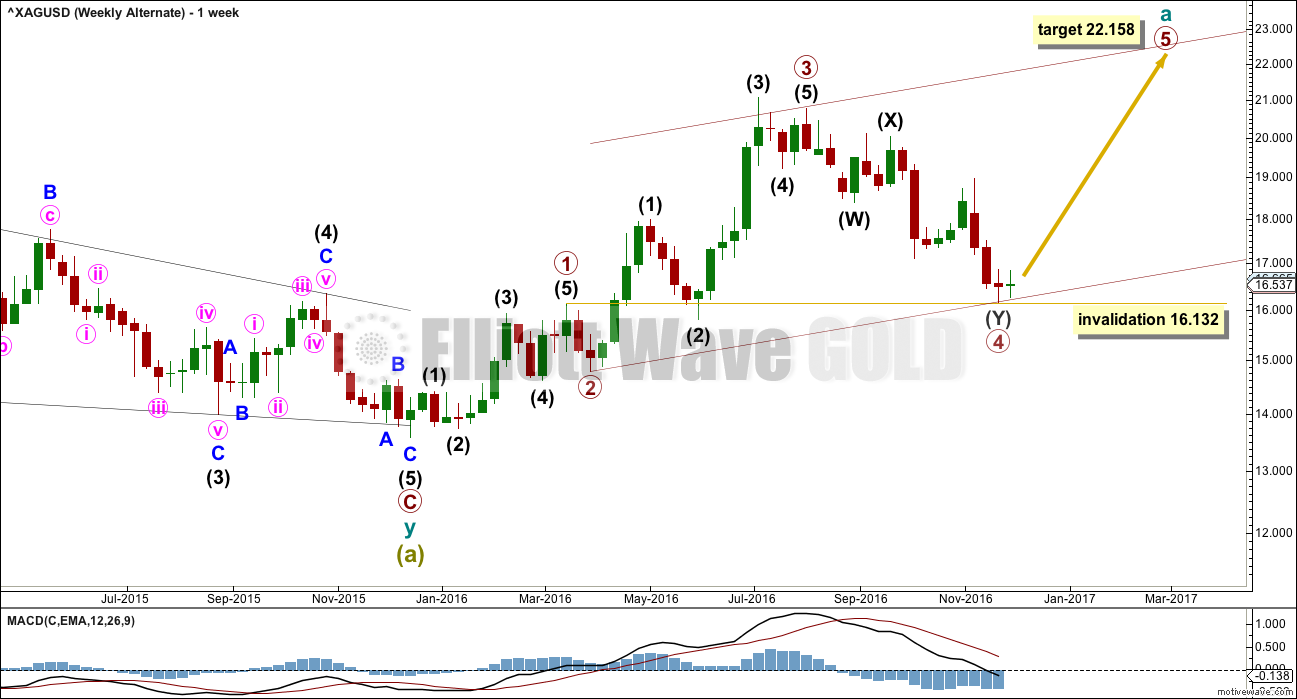
If a zigzag is unfolding upwards, then within it cycle wave a should subdivide as a five wave structure. So far primary waves 1 through to 4 may be complete.
If primary wave 4 continues lower, it may not move into primary wave 1 price territory below 16.132.
The disproportion between primary waves 2 and 4 reduces the probability of this wave count. Primary wave 2 lasted just two weeks. Primary wave 4 lasted 16 weeks.
The lack of alternation further reduces the probability of this wave count. Primary wave 2 is a single zigzag and primary wave 4 is a double zigzag.
This wave count remains technically possible this week, but it looks very wrong.
ALTERNATE DAILY WAVE COUNT
Click chart to enlarge.
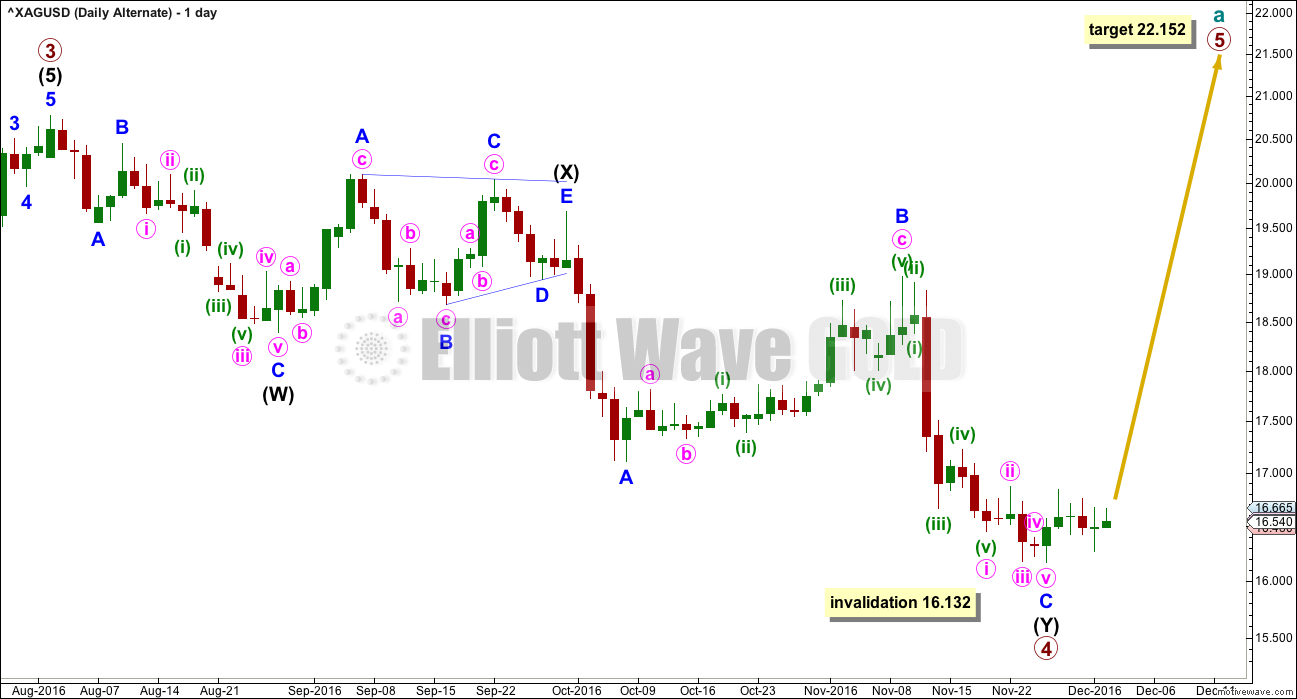
Primary wave 3 ends with a truncation. This slightly reduces the probability of this wave count. A truncation may occur after a movement that is “too far, too fast”, which is a description that may fit the upwards wave labelled intermediate wave (3).
At 22.152 primary wave 5 would reach equality in length with primary wave 3. Both primary waves 3 and 5 would be extended. If this target is wrong, it may be too low. Primary wave 5 may end with a blowoff top and be a very strong swift extended wave.
Primary wave 4 may be over here or very soon indeed. It may not move into primary wave 1 price territory below 16.132.
SECOND ALTERNATE WEEKLY WAVE COUNT
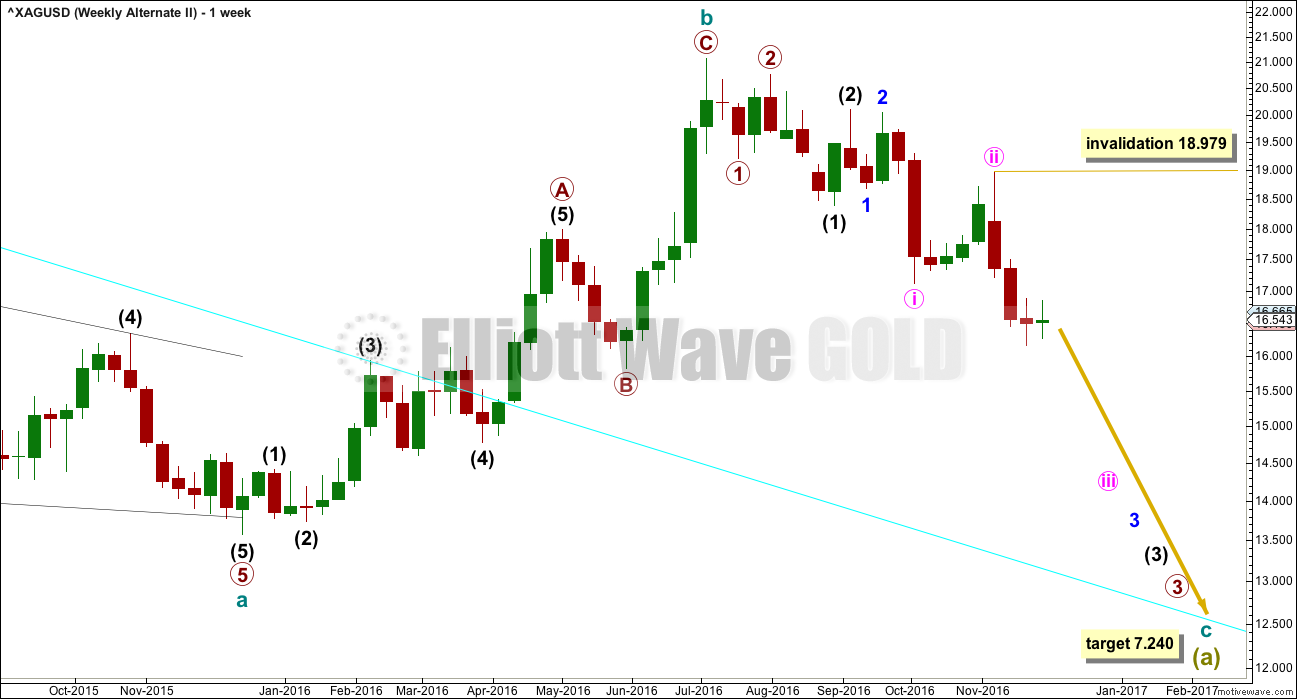
Click chart to enlarge.
It is also possible that cycle wave b is a complete zigzag and that downwards movement is the start of cycle wave c.
Unfortunately, because the main wave count has no lower invalidation point there can be no lower confirmation point for this alternate. Only structure would guide which wave count is more likely.
Within the middle of the third wave down, no second wave correction may move beyond the start of minute wave iii above 18.979. If this wave count is invalidated, then more confidence may be had in the first two wave counts.
It is judged that this alternate at this stage may be less likely. A series of overlapping first and second wave corrections ignores what looks like a triangle within this structure. Triangles may not be the sole corrective structure of a second wave.
Minute wave ii is much longer in duration than minor wave 2 and intermediate wave (2). The disproportion of this correction also reduces the probability of this wave count.
Technical weakness to current downwards movement is the main reason why this wave count is judged to be least likely.
If downwards movement continues and shows an increase in strength, then this wave count should be taken seriously. It is technically possible.
TECHNICAL ANALYSIS
WEEKLY CHART
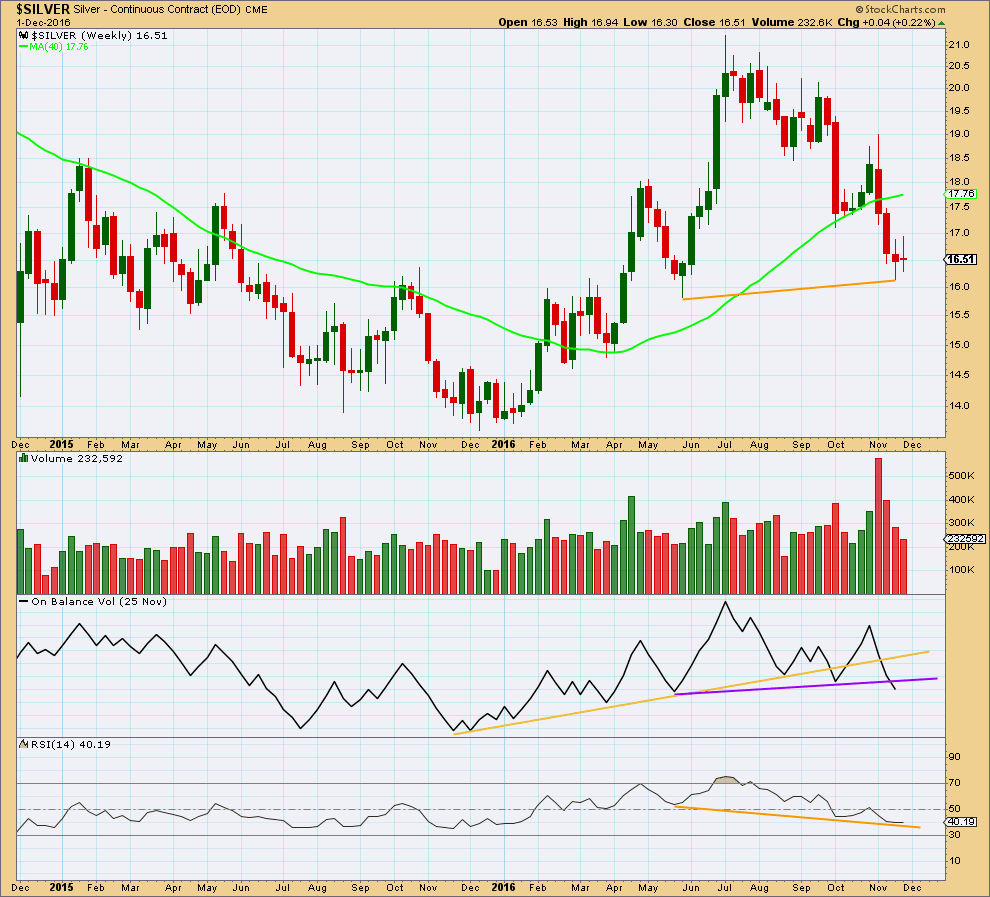
Click chart to enlarge. Chart courtesy of StockCharts.com.
Silver has moved lower with declining volume for three weeks in a row. This strongly suggests bears are weak.
The weekly candlestick at the last low is a spinning top suggesting a balance of bulls and bears. The current week so far is a doji also suggesting a balance of bulls and bears.
While volume does not support a bearish outlook, On Balance Volume does. The break below the purple trend line is a bearish signal. OBV usually (not always) works well with trend lines.
While price has made higher major swing lows, RSI has made lower swing lows (orange trend lines). This hidden bullish divergence indicates weakness in bears.
DAILY CHART
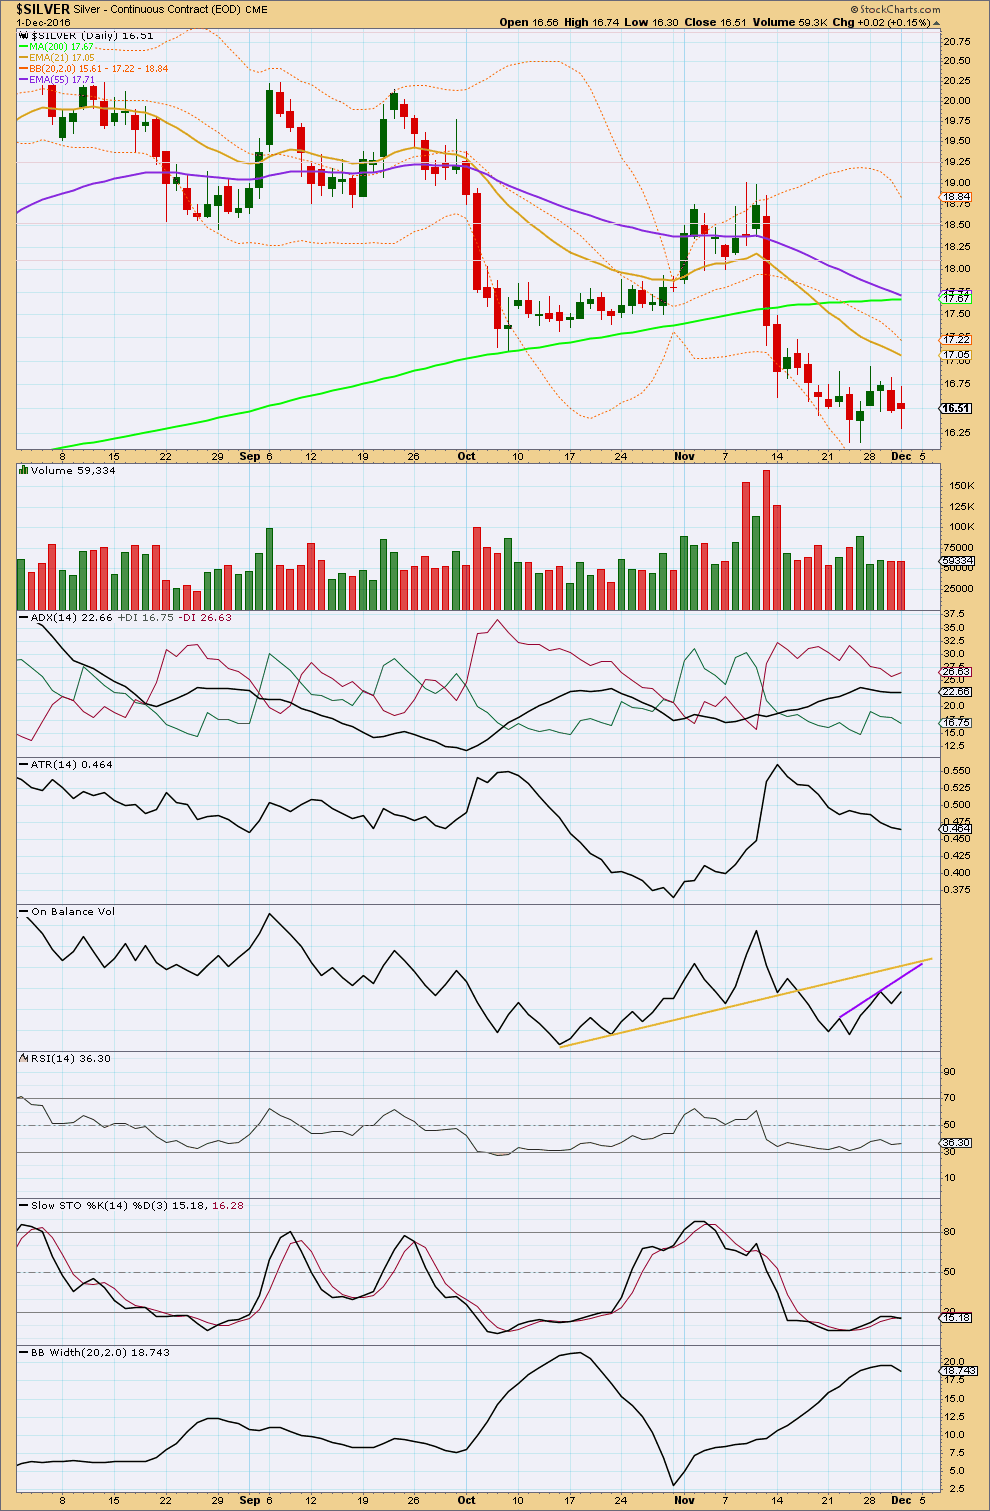
Click chart to enlarge. Chart courtesy of StockCharts.com.
Upwards days over the last week have stronger volume than downwards days. The last two downwards days are relatively weak. There is more support for upwards movement for price than for downwards.
ADX is flat indicating no clear trend. ATR is declining, and it agrees with ADX. Bollinger Bands have only just begun to contract for the last day, which is not enough yet to say they agree.
The last lows brought Stochastics to extreme but not RSI. There is still a little room for new lows.
There is no close by support for On Balance Volume. There is some resistance. The purple trend line has almost no technical significance, but it might offer some resistance. The yellow line has reasonable technical significance and should be expected to offer resistance. A break above the yellow line would be a strong bullish signal.
This analysis is published @ 02:46 a.m. EST.