
Upwards movement continues so far as expected for Silver.
Summary: A new high above 18.979 would invalidate the alternate Elliott wave count and confirm a trend change for Silver. It will remain possible that Silver is still in a bear market while price remains below this point. A new low now below 16.652 would add some confidence to the very bearish second alternate wave count. The market is consolidating, and it may be forming a bear flag pattern.
New updates to this analysis are in bold.
To see how this analysis fits into the bigger picture, see last monthly charts here.
Main and alternate wave counts this week are presented in order of probability.
MAIN WEEKLY WAVE COUNT
Click chart to enlarge.
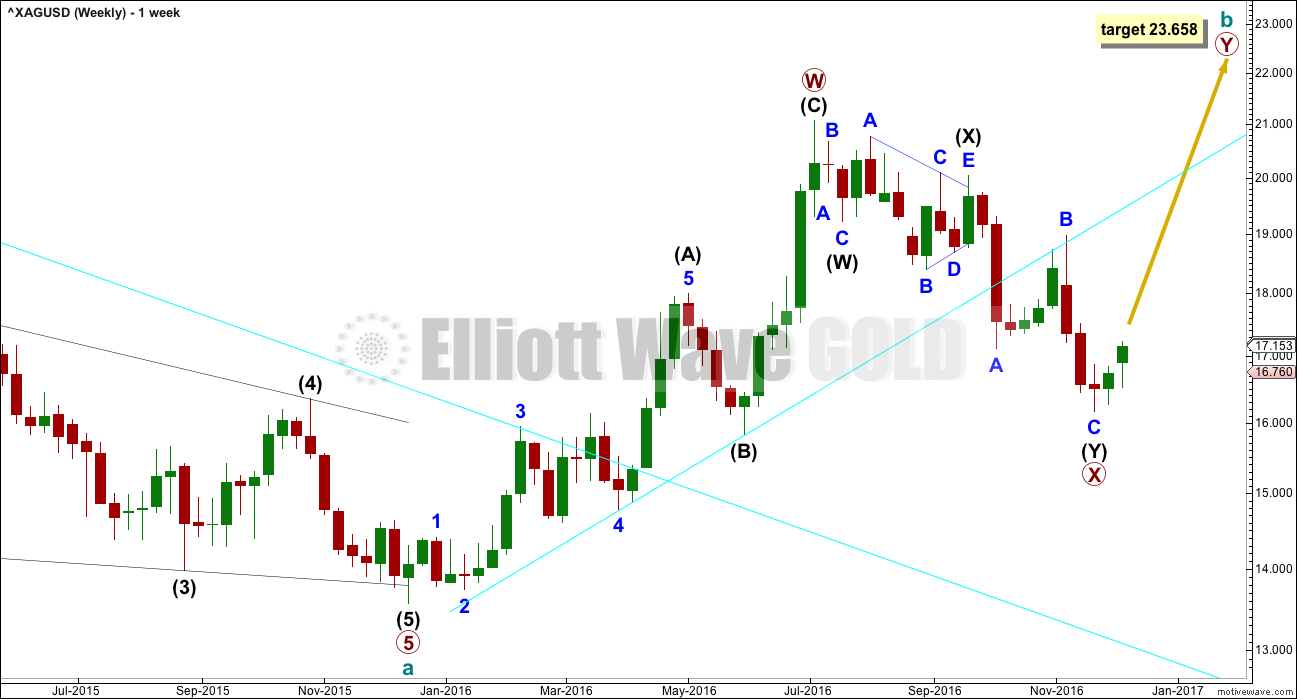
Upwards movement fits better as a completed zigzag than it will as an incomplete five, at this stage. At the daily and weekly chart level, this wave count has a better fit and better look for Silver.
Primary wave X may have continued lower as a double zigzag.
Cycle wave b may be either a double zigzag or a double combination. If it is a double zigzag, then primary wave Y may be about equal in length with primary wave W, which would give a target at 23.658. As primary wave X is at this stage not extremely deep, it looks more like an X wave within a double zigzag.
If primary wave X continues lower, then this target must also move correspondingly lower.
X waves within combinations are more often very deep. There is no rule stating a maximum limit for an X wave. They may make new price extremes beyond the start of the correction.
MAIN DAILY WAVE COUNT
Click chart to enlarge.
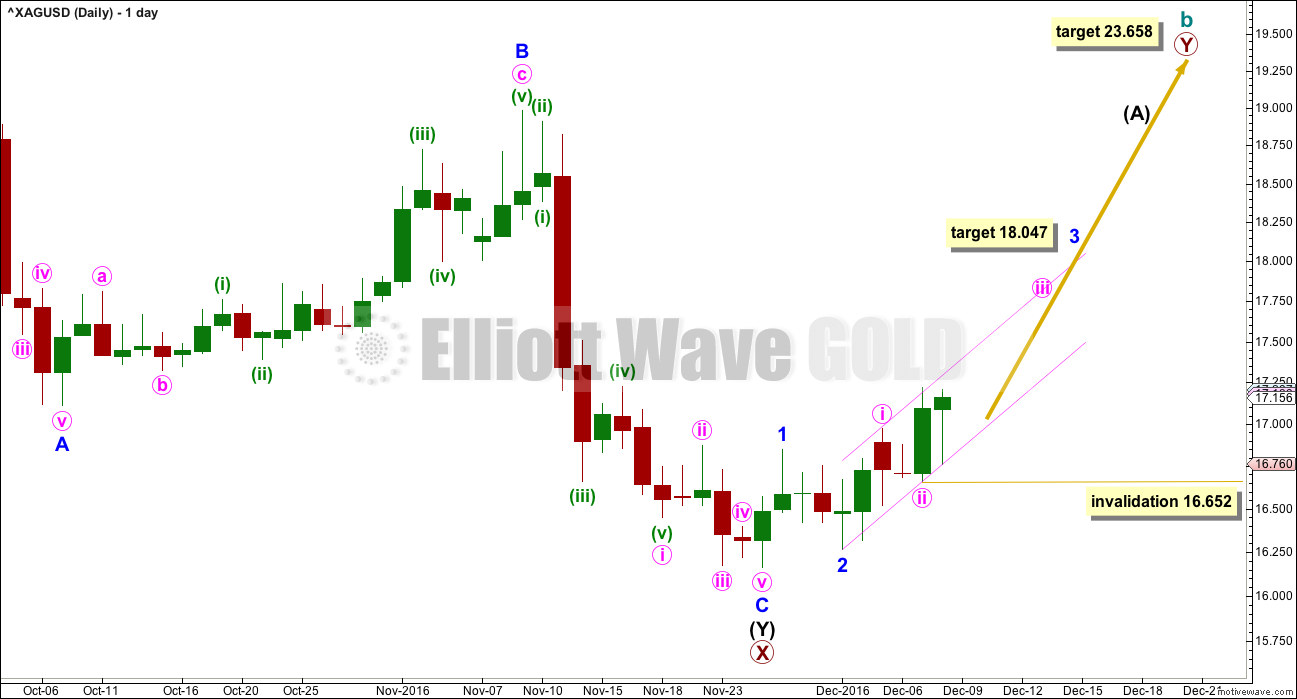
Within new upwards movement, there may now be two overlapping first and second waves. This wave count expects to see some increase in upwards momentum.
At 18.047 minor wave 3 would reach 2.618 the length of minor wave 1.
Within minute wave iii, no second wave correction may move beyond the start of its first wave below 16.652.
ALTERNATE WEEKLY WAVE COUNT

Click chart to enlarge.
If a zigzag is unfolding upwards, then within it cycle wave a should subdivide as a five wave structure. So far primary waves 1 through to 4 may be complete.
If primary wave 4 continues lower, it may not move into primary wave 1 price territory below 16.132.
The disproportion between primary waves 2 and 4 reduces the probability of this wave count. Primary wave 2 lasted just two weeks. Primary wave 4 lasted 16 weeks.
The lack of alternation further reduces the probability of this wave count. Primary wave 2 is a single zigzag and primary wave 4 is a double zigzag.
This wave count remains technically possible, but it looks very wrong. It is still published though because Silver does not always have waves that look right.
ALTERNATE DAILY WAVE COUNT
Click chart to enlarge.
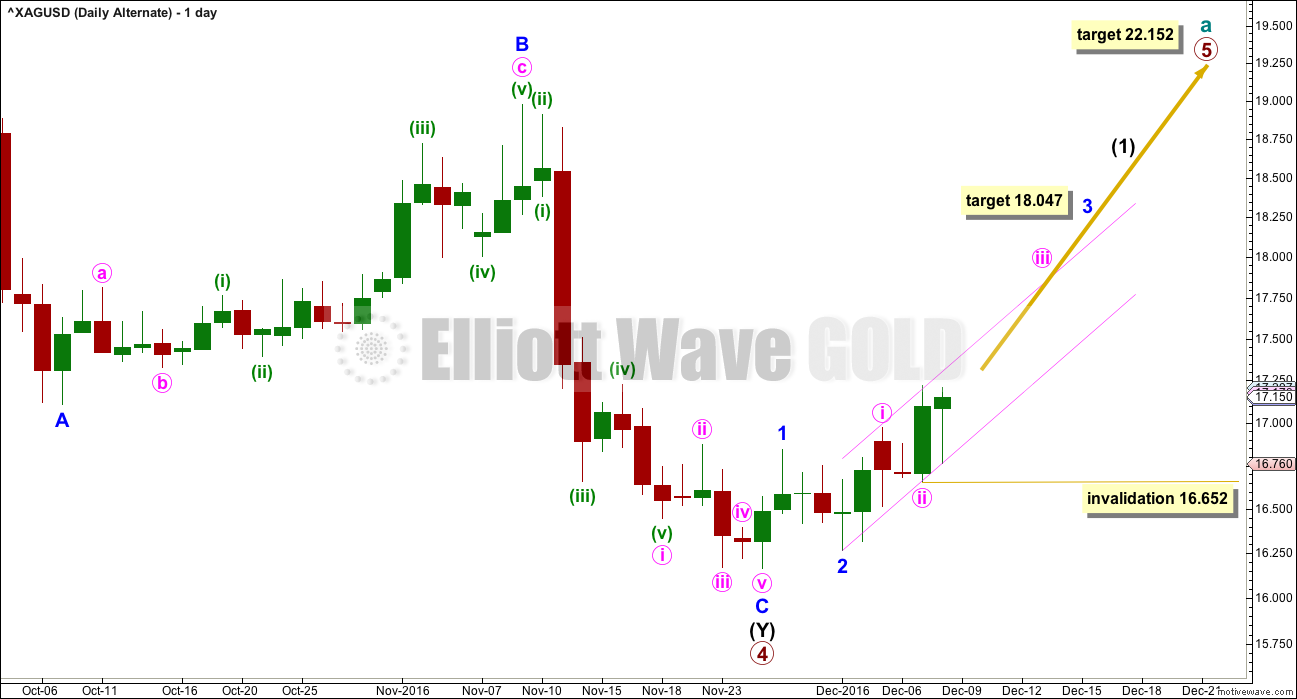
At 22.152 primary wave 5 would reach equality in length with primary wave 3. Both primary waves 3 and 5 would be extended. If this target is wrong, it may be too low. Primary wave 5 may end with a blowoff top and be a very strong swift extended wave.
Primary wave 5 must subdivide as a five wave structure, and within it intermediate wave (1) may be incomplete.
Within intermediate wave (1), so far minor waves 1 and 2 may be complete. At 18.047 minor wave 3 would reach 2.618 the length of minor wave 1.
Within minute wave iii, no second wave correction may move beyond its start below 16.652.
SECOND ALTERNATE WEEKLY WAVE COUNT
Click chart to enlarge.
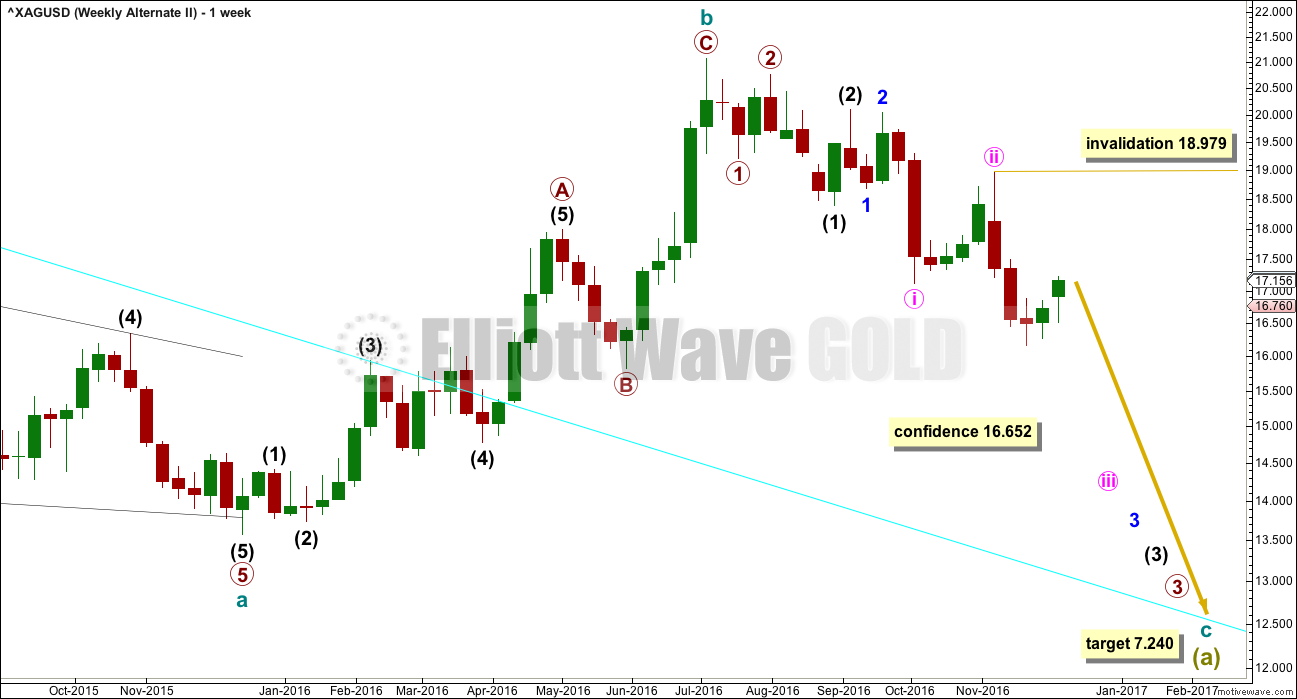
It is also possible that cycle wave b is a complete zigzag and that downwards movement is the start of cycle wave c.
At this stage, a new low below 16.652 would add some confidence to this wave count.
Within the middle of the third wave down, no second wave correction may move beyond the start of minute wave iii above 18.979. If this wave count is invalidated, then more confidence may be had in the first two wave counts.
It is judged that this alternate at this stage may be less likely. A series of overlapping first and second wave corrections ignores what looks like a triangle within this structure. Triangles may not be the sole corrective structure of a second wave.
Minute wave ii is much longer in duration than minor wave 2 and intermediate wave (2). The disproportion of this correction also reduces the probability of this wave count.
Technical weakness to current downwards movement is the main reason why this wave count is judged to be least likely.
If downwards movement continues and shows an increase in strength, then this wave count should be taken seriously. It is technically possible.
TECHNICAL ANALYSIS
WEEKLY CHART
Click chart to enlarge. Chart courtesy of StockCharts.com.
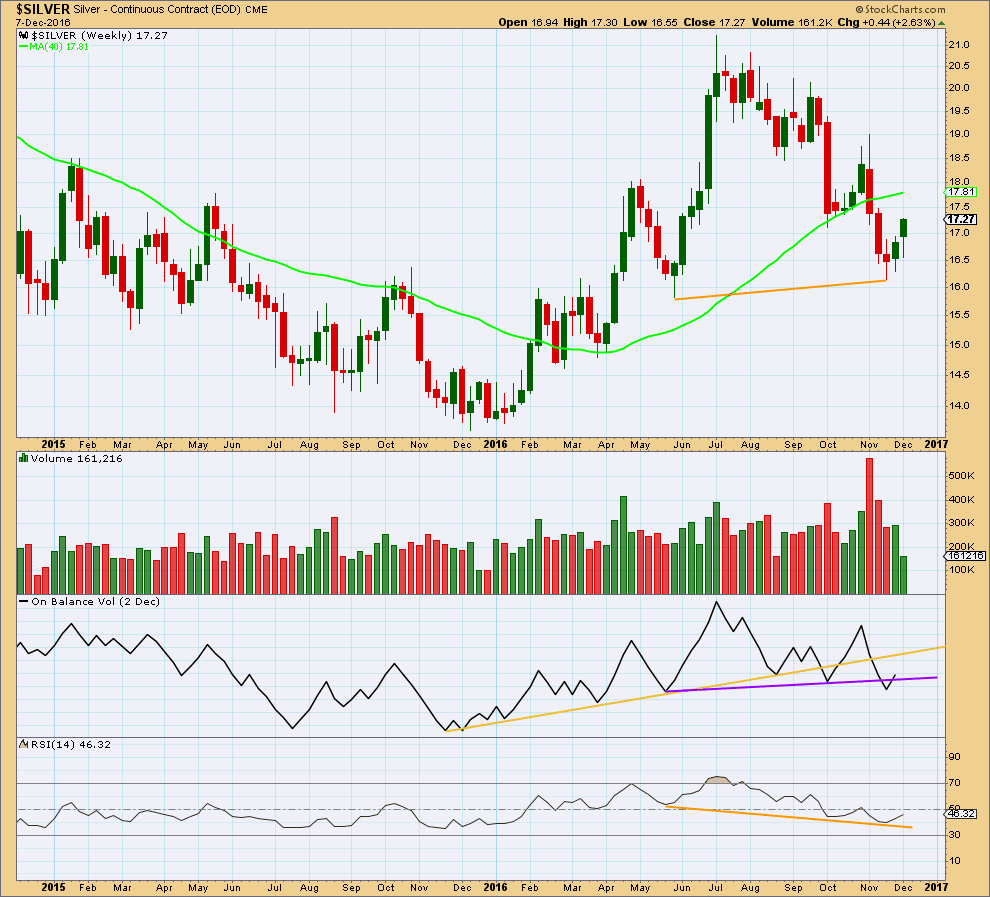
Silver moved higher last week with some increase in volume. This week is incomplete, so volume for it cannot yet be analysed.
The long lower wicks on the two upwards weekly candlesticks are bullish, but the current weekly candlestick may yet change.
The bearish signal given by On Balance Volume with a break below the purple line is negated as OBV returned above the line last week. If this week closes green, then OBV will move further up and away from the line. Resistance is at the yellow line some distance away allowing price room to rise.
DAILY CHART
Click chart to enlarge. Chart courtesy of StockCharts.com.
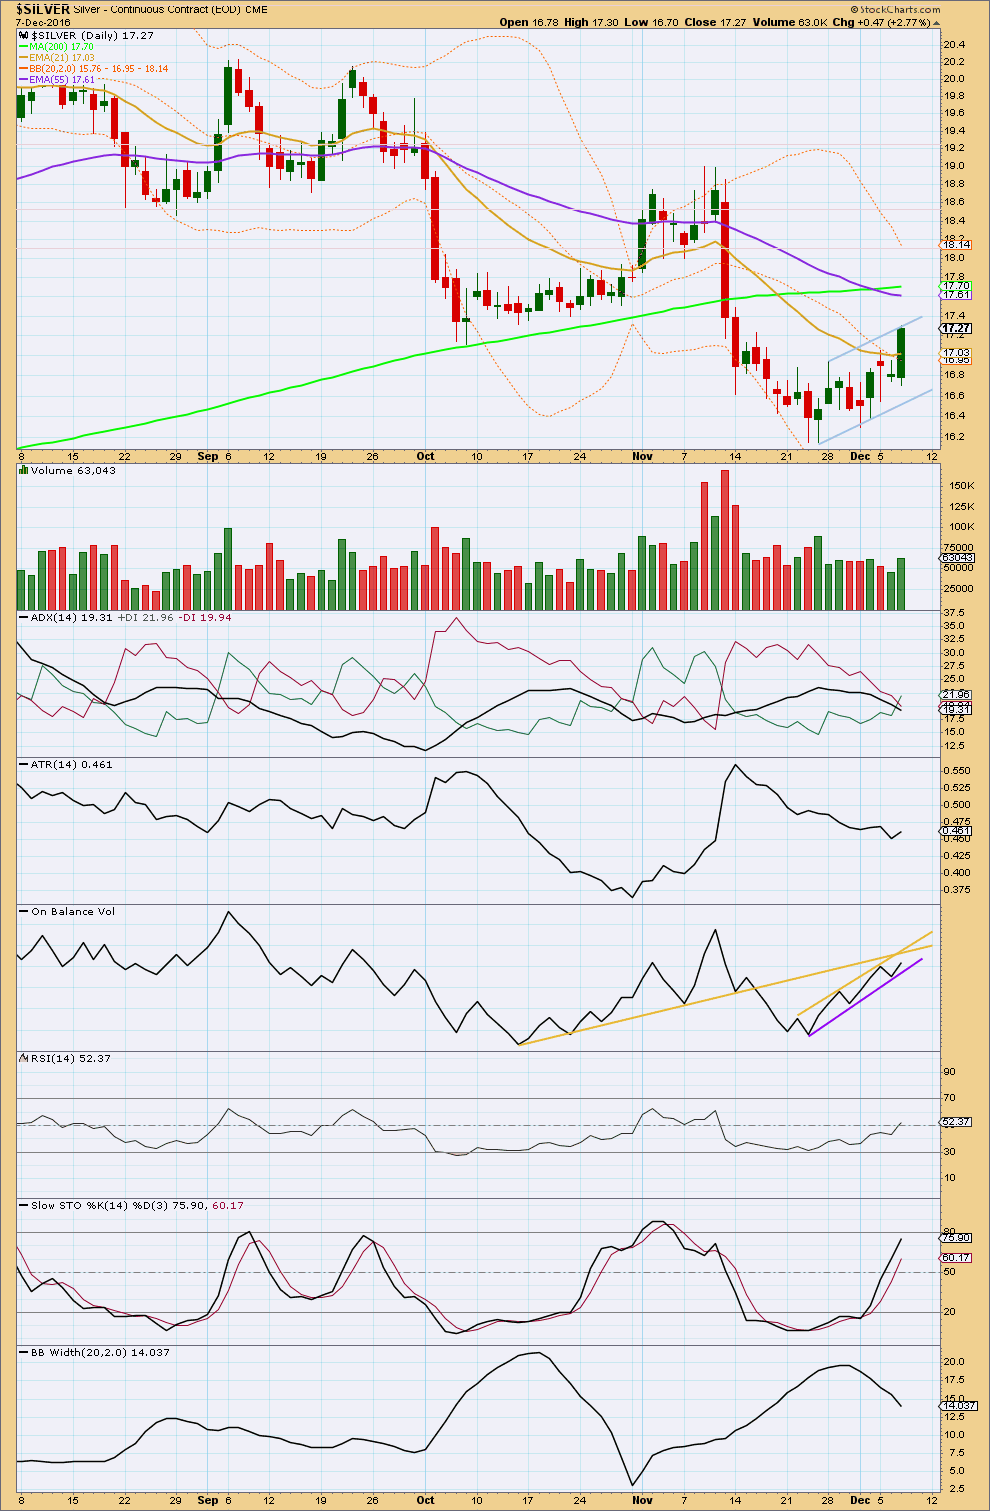
A bear flag pattern may be unfolding, which is a fairly reliable continuation pattern, and the breakout should be down. Using the measured rule, a target would be about 13.75.
Volume is not declining as price moved slowly upwards with choppy overlapping movement; volume is essentially flat. This neither supports nor detracts from the pattern.
ADX has just indicated a possible trend change, but does not yet indicate a new upwards trend.
ATR is overall declining, indicating the market is not trending. Bollinger Bands agree as they continue to contract.
RSI has just moved into bullish territory. There is plenty of room for price to rise.
Stochastics is not yet extreme.
On Balance Volume remains constrained, and it has some resistance to overcome before price can rise.
Overall, the market is consolidating. The pattern suggests a downwards breakout.
This analysis is published @ 01:41 a.m. EST.