
The main Elliott wave count was confirmed when Silver made a new high above 17.220 and the alternate Elliott wave count was invalidated.
There is only one Elliott wave count now left for Silver at this time.
Summary: A deep correction may have begun now for Silver. The target is 16.26, but not below 15.638.
New updates to this analysis are in bold.
ELLIOTT WAVE COUNT
MONTHLY CHART
Click chart to enlarge.
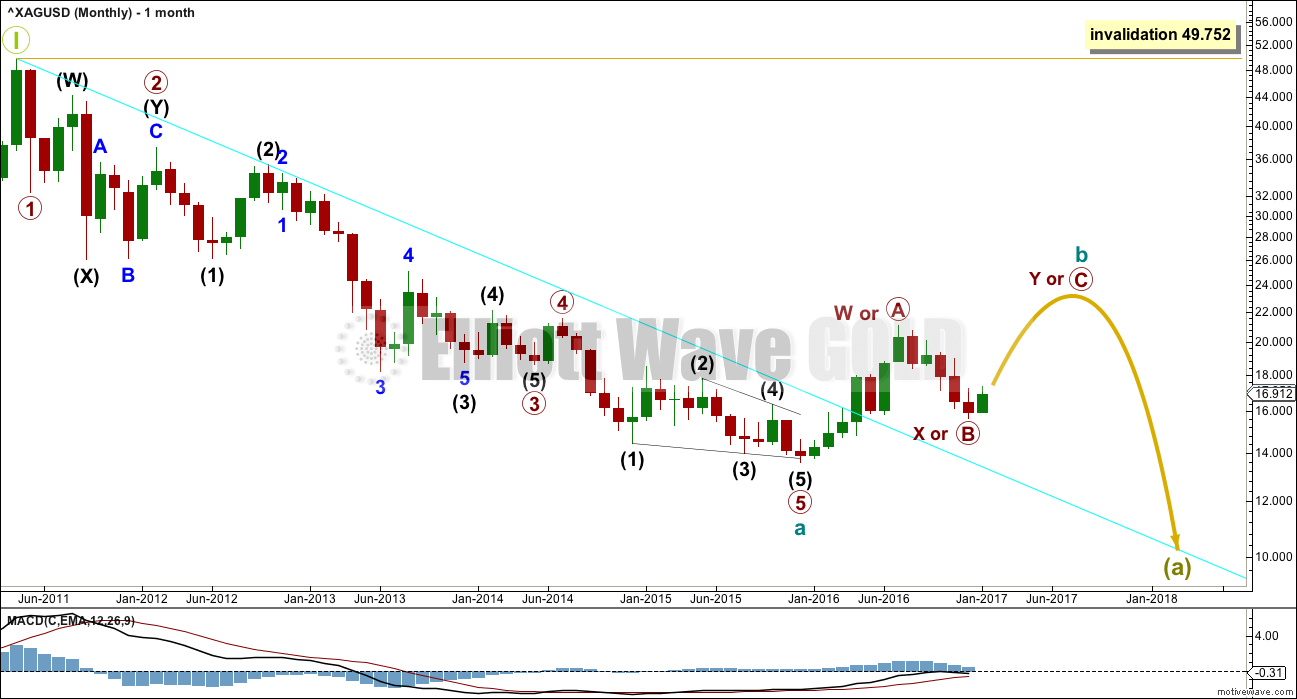
At the monthly chart level, it now looks most likely that the large wave down from April 2011 to December 2015 was a five wave impulse. This is now being followed by a three up in the opposite direction.
When cycle wave b is complete, then another five down for cycle wave c would be expected.
Cycle wave b is an incomplete single or double zigzag. Primary wave C or Y is most likely to reach equality in length with primary wave A or W, and it should move at least somewhat above the end of primary wave A or W to avoid a truncation if it is primary wave C, or to achieve its purpose of deepening the correction if it is primary wave Y.
If this analysis of cycle wave a as a five wave structure is correct, then cycle wave b may not move beyond its start above 49.752.
WEEKLY CHART
Click chart to enlarge.
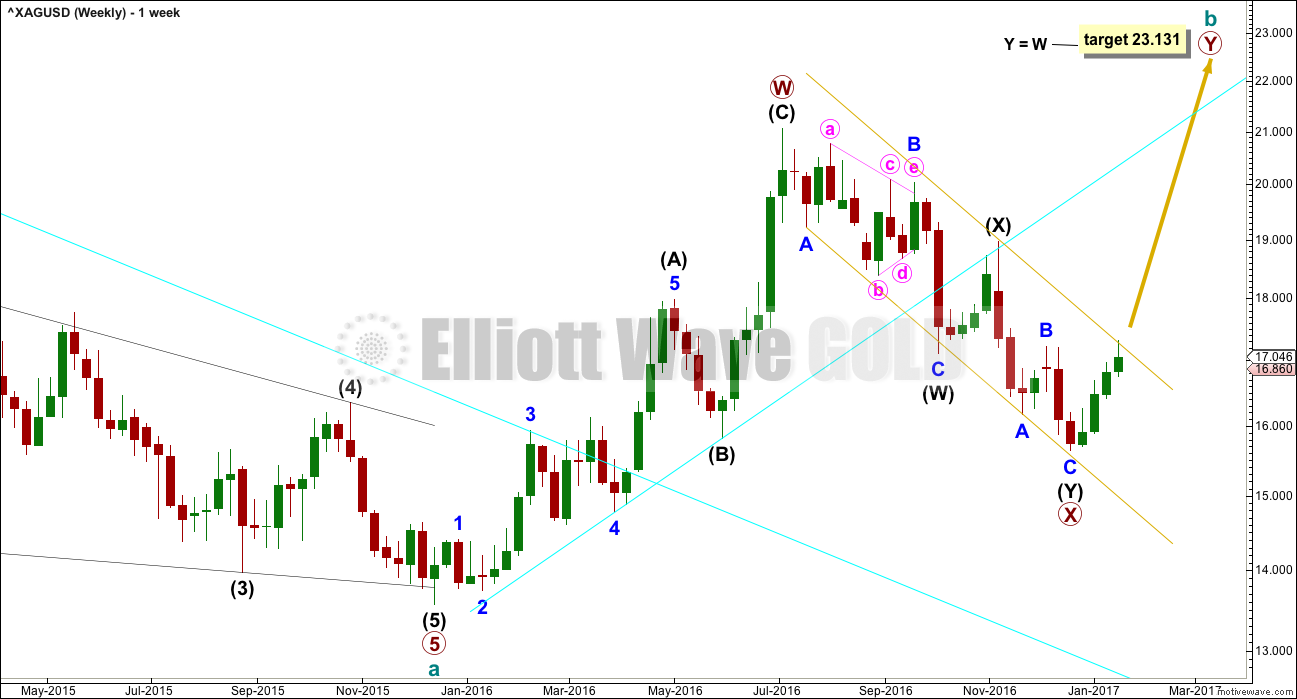
The upwards wave labelled primary wave W is seen here as a complete zigzag. It will also fit as an impulse and this is seen on the alternate weekly chart below.
If primary wave W is a zigzag, then within intermediate wave (A) the correction labelled minor wave 4 is a rare running flat. This reduces the probability of this wave count. For this reason the alternate below is published. It makes no difference to expected direction nor to the target.
The channel about primary wave X is providing resistance at this time. This wave count expects that upon the next test this channel should be breached.
ALTERNATE WEEKLY CHART
Click chart to enlarge.
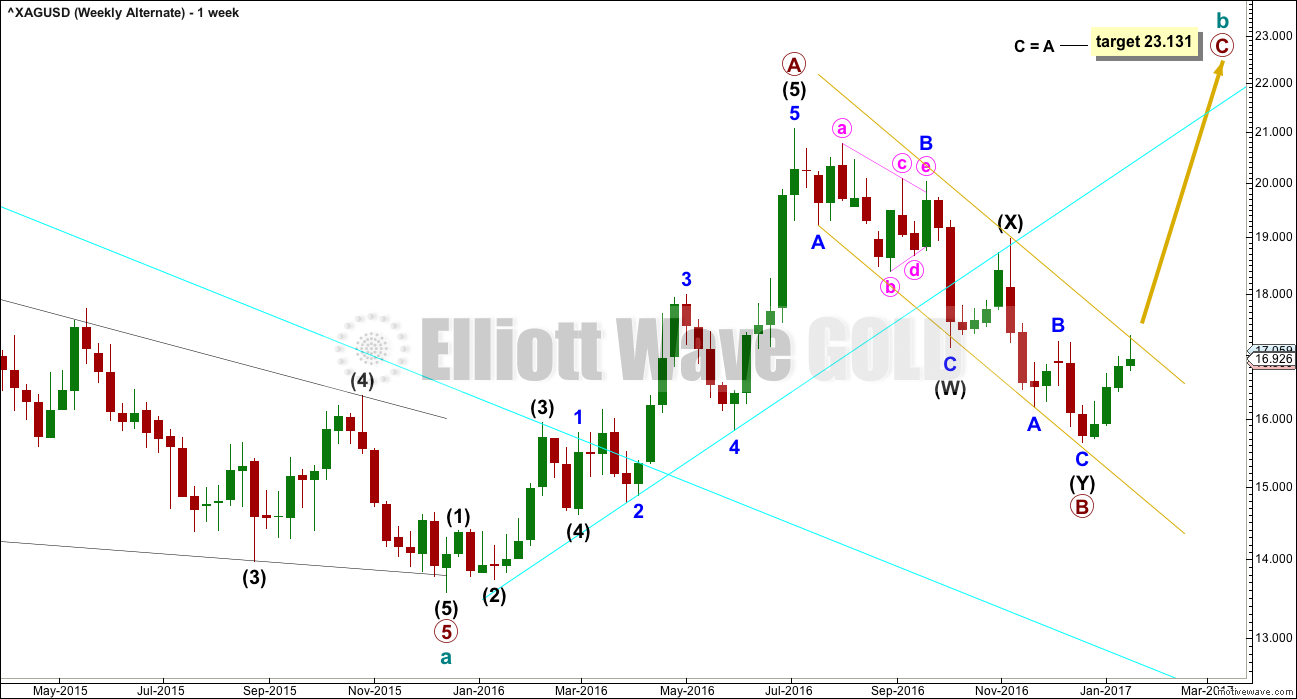
Upwards movement labelled here as primary wave A will fit neatly as a five wave impulse. Within primary wave A, it is intermediate wave (5) that is extended.
The problem of a running flat is resolved. Although this is labelled as an alternate wave count, it may have a higher probability than the main wave count. But it makes no difference at this stage to either expected direction or the target calculation.
Primary wave B is a complete double zigzag.
Primary wave C is most likely to move at least slightly above the end of primary wave A to avoid a truncation. The most likely target for primary wave C would be equality in length with primary wave A.
DAILY CHART
Click chart to enlarge.
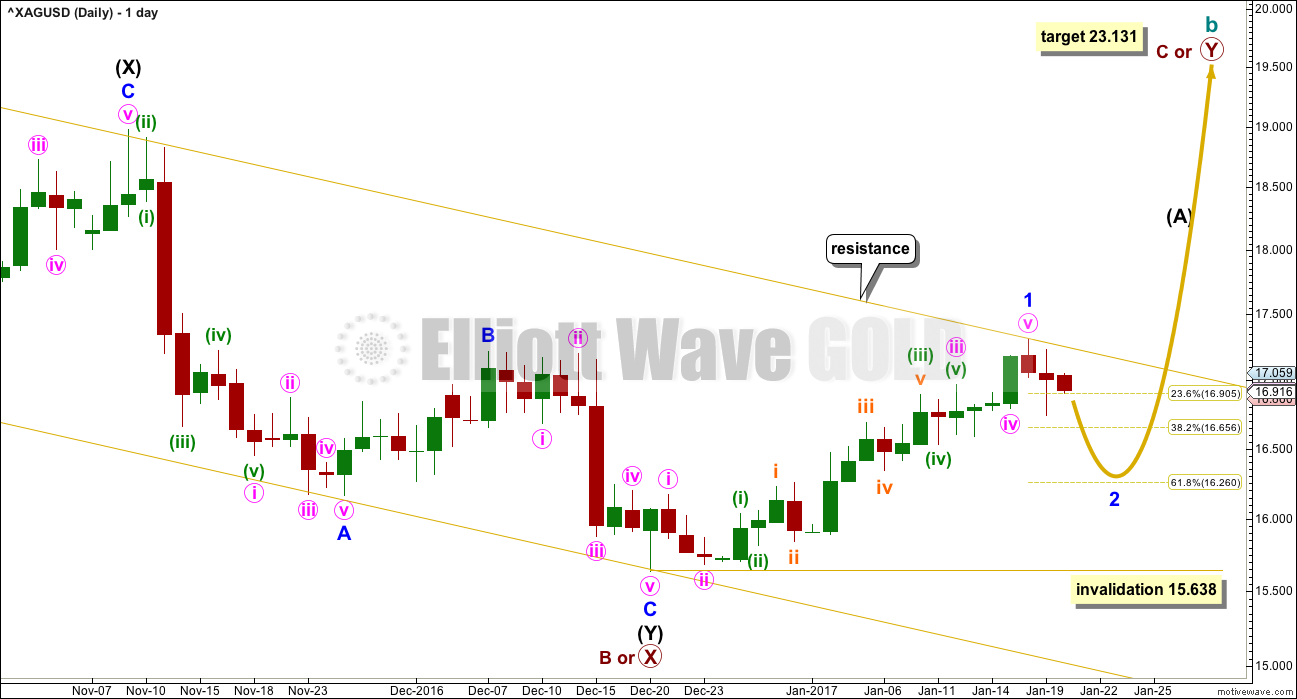
Price may have found strong resistance at the upper edge of the gold best fit channel.
A five up may now be complete. This may be minor wave 1. Or the degree of labelling may be moved up one degree and it may be intermediate wave (1) or (A).
Following a five up the next three down may not move beyond its start below 15.638.
The most likely target for minor wave 2 would be the 0.618 Fibonacci ratio of minor wave 1 at 16.26.
TECHNICAL ANALYSIS
WEEKLY CHART
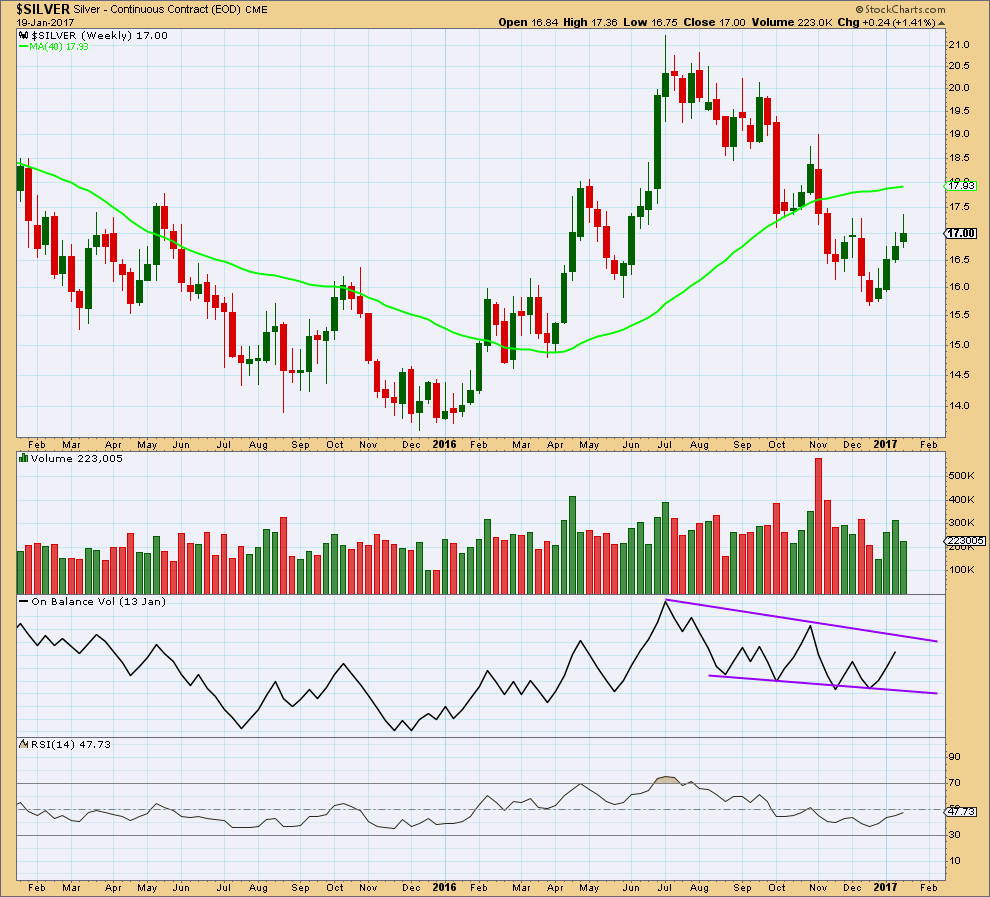
Click chart to enlarge. Chart courtesy of StockCharts.com.
For the first three weeks of upwards movement, after the low in December 2016, volume supported the rise in price. This last week is not complete but needs Friday’s session to show strong upwards movement and volume for another increase. It may not be able to do that.
So far the last three weeks have long upper wicks on the candlesticks. This is slightly bearish, although this current week still has Friday to complete.
On Balance Volume is at neither support nor resistance. If it comes up to the upper trend line at the end of this week, that may serve to halt the rise in price.
RSI is close to neutral. There is room for price to rise or fall.
DAILY CHART
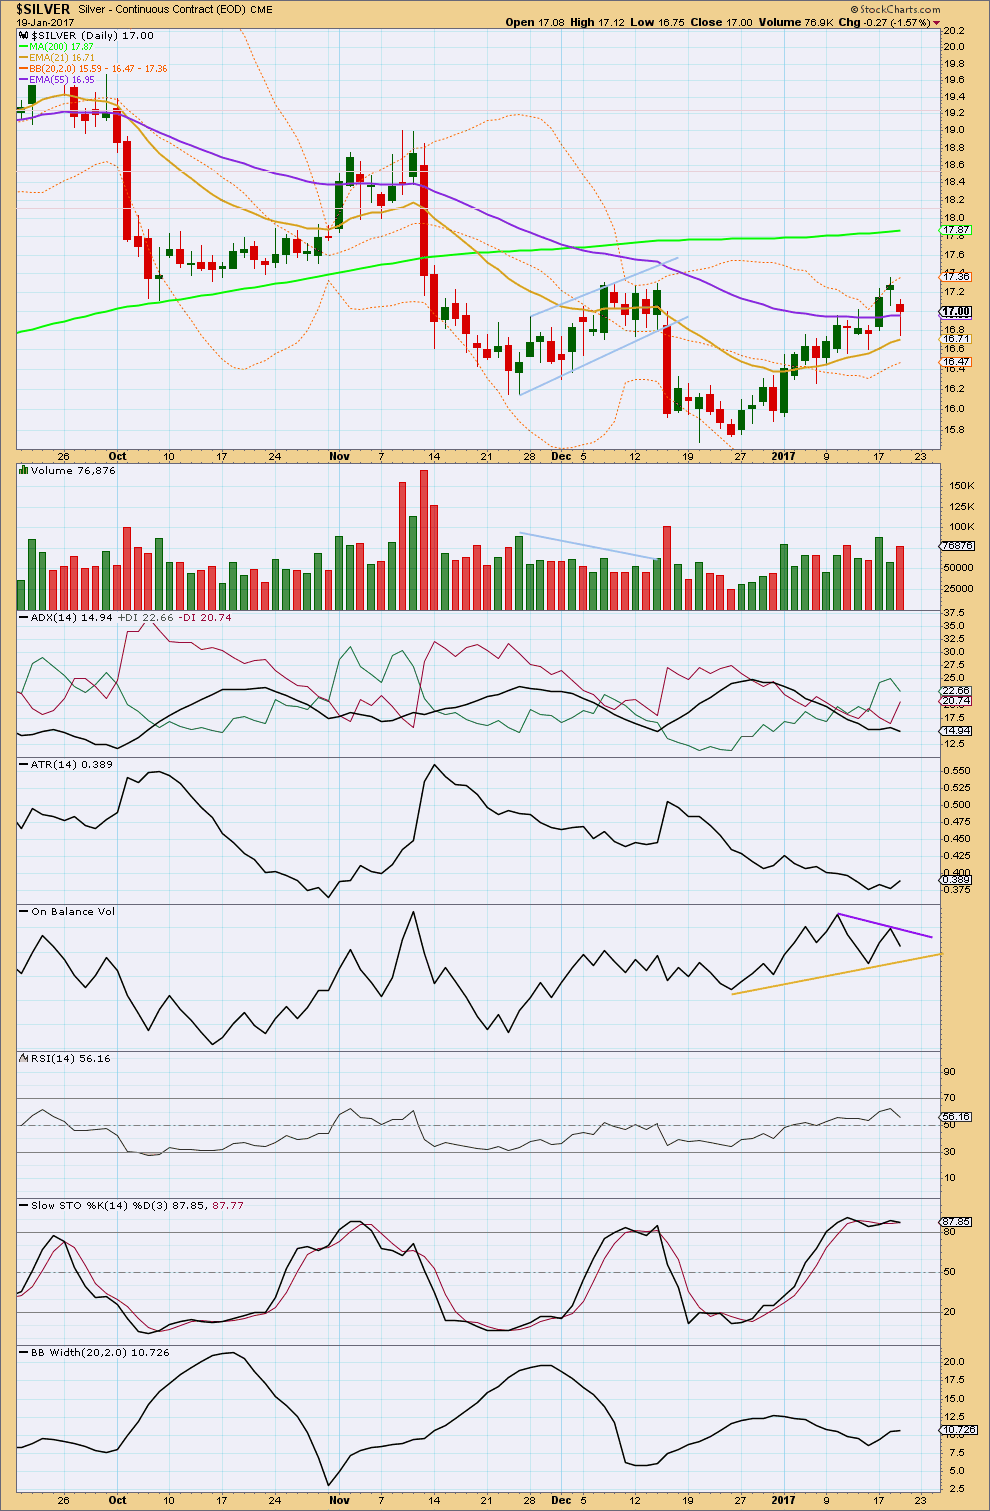
Click chart to enlarge. Chart courtesy of StockCharts.com.
Overall, the rise in price from the low of 20th December, 2016, comes with a rise in volume. The rise in price was supported by volume.
The last daily candlestick of the 19th January, 2017, comes with some increase in volume to support the fall in price. However, this also happened recently on the 11th of January yet it was followed by more upwards movement.
ADX is declining and is below 15. This indicates the market is not currently trending; it is consolidating. ATR is flat overall in agreement.
On Balance Volume is at neither support nor resistance. The highs of the 10th to the 18th of January exhibit divergence with On Balance Volume: OBV did not manage to make a corresponding high as price made a new high on the 18th of January. This divergence is bearish and indicates weakness in price.
RSI has not managed to reach overbought. There is room for upwards movement to continue.
Stochastics has reached overbought and exhibits divergence with price at last high. This indicates weakness in price.
Price may be returning from the upper edge of Bollinger Bands.
All three moving averages for Silver have a positive slope indicating an upwards trend. However, the short term average is below the mid term which is below the long term. The upwards trend is not confidently indicated at this stage.
This analysis is published @ 04:45 a.m. EST.