
Last analysis expected a deep pullback was close to complete (the target was at 16.666). Price moved slightly lower to reach 16.831, 0.165 above the target, before turning.
Summary: A deep pullback looks likely to be over now and a third wave up looks likely to be underway. Long positions opened close to the low at 16.831 may like to hold and positions opened higher may take profits.
A second wave correction may be quick and may offer another entry opportunity to join a new upwards trend. Stops should be set just below 16.831. Do not invest more than 1-5% of equity on any one trade.
New updates to this analysis are in bold.
Last monthly chart is here.
ELLIOTT WAVE COUNT
WEEKLY CHART
Click chart to enlarge.
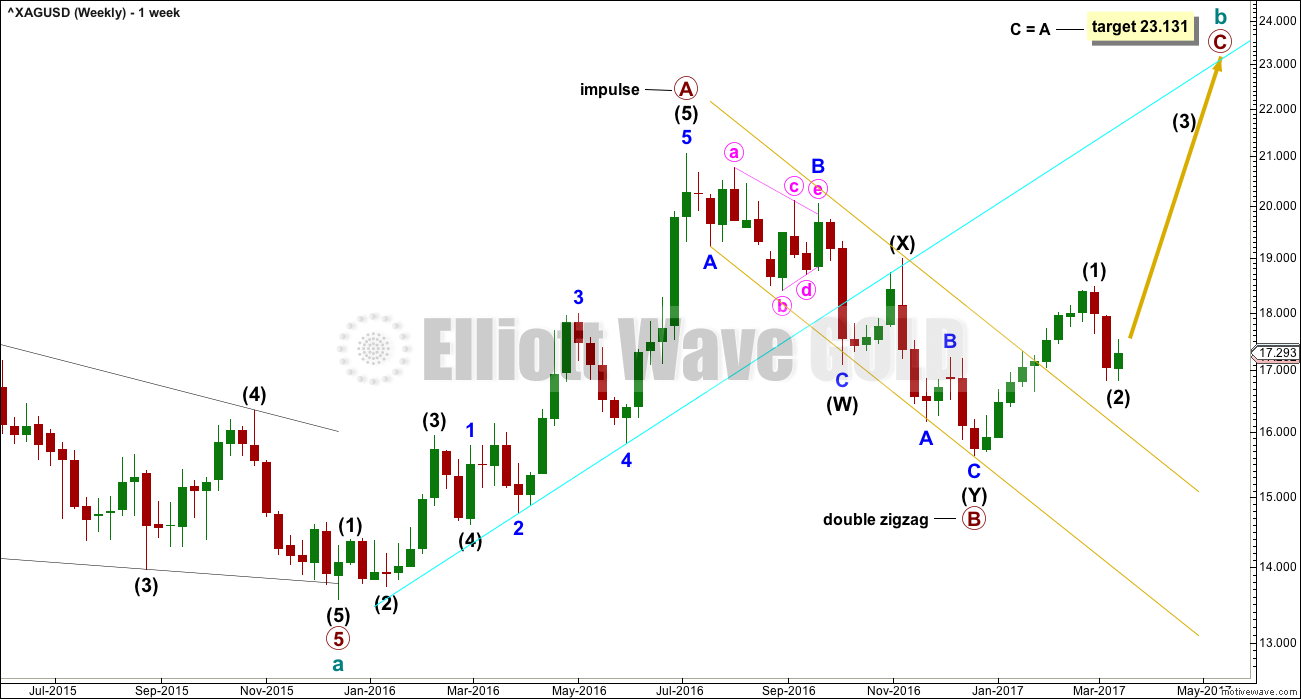
Upwards movement labelled primary wave A fits perfectly as an impulse.
Primary wave B fits as a deep double zigzag. Primary wave C must subdivide as a five wave structure. The target expects it to reach the most common Fibonacci ratio to primary wave A.
Primary wave A lasted 29 weeks. Primary wave B so far lasted 24 weeks. These waves are in proportion. However, B waves can be very long lasting, so it is important to consider alternates. An alternate is provided today at the daily chart level.
DAILY CHART
Click chart to enlarge.
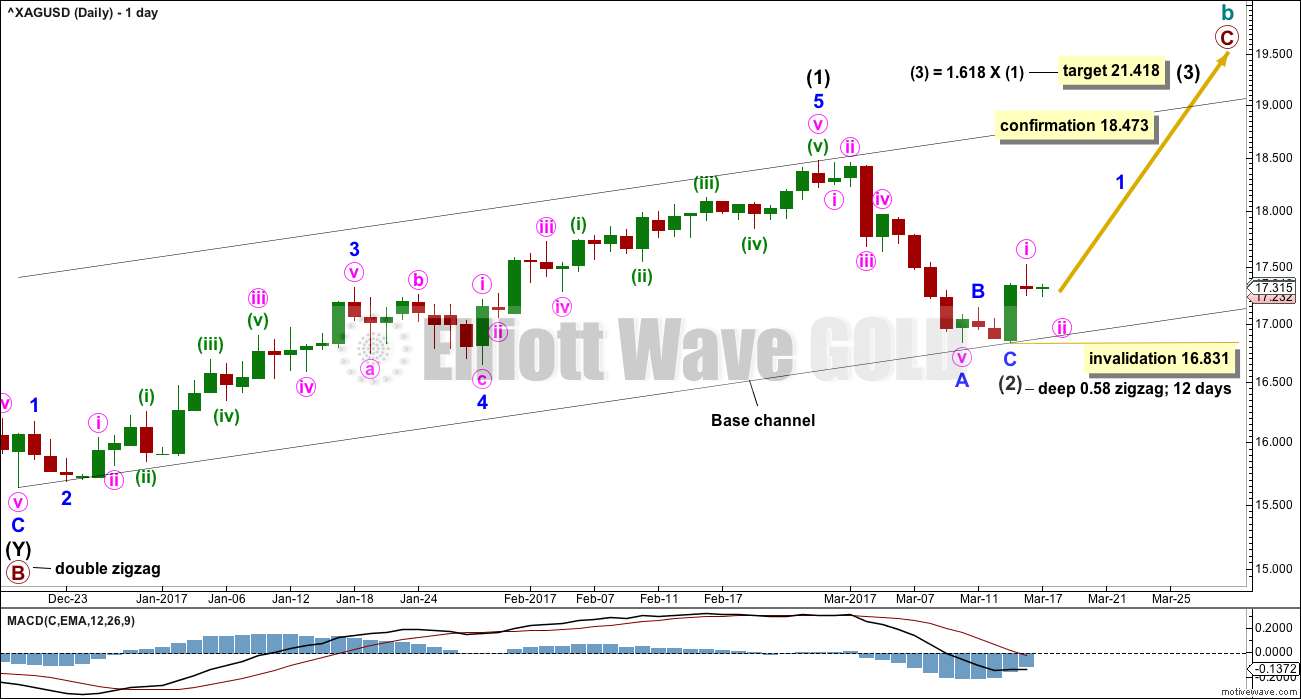
Intermediate wave (2) now looks complete as a zigzag, close to the 0.618 Fibonacci ratio of intermediate wave (1).
A new high above 18.473 would invalidate the alternate below and provide confirmation of this main wave count. At that stage, intermediate wave (3) would also have moved beyond the end of intermediate wave (1) meeting the Elliott wave rule.
Within intermediate wave (3), no second wave correction may move beyond the start of its first wave below 16.831.
Minute wave i lasted just two days. Minute wave ii may last two, three or five days.
Lower degree corrections should now find support at the lower edge of the base channel.
ALTERNATE DAILY CHART
Click chart to enlarge.
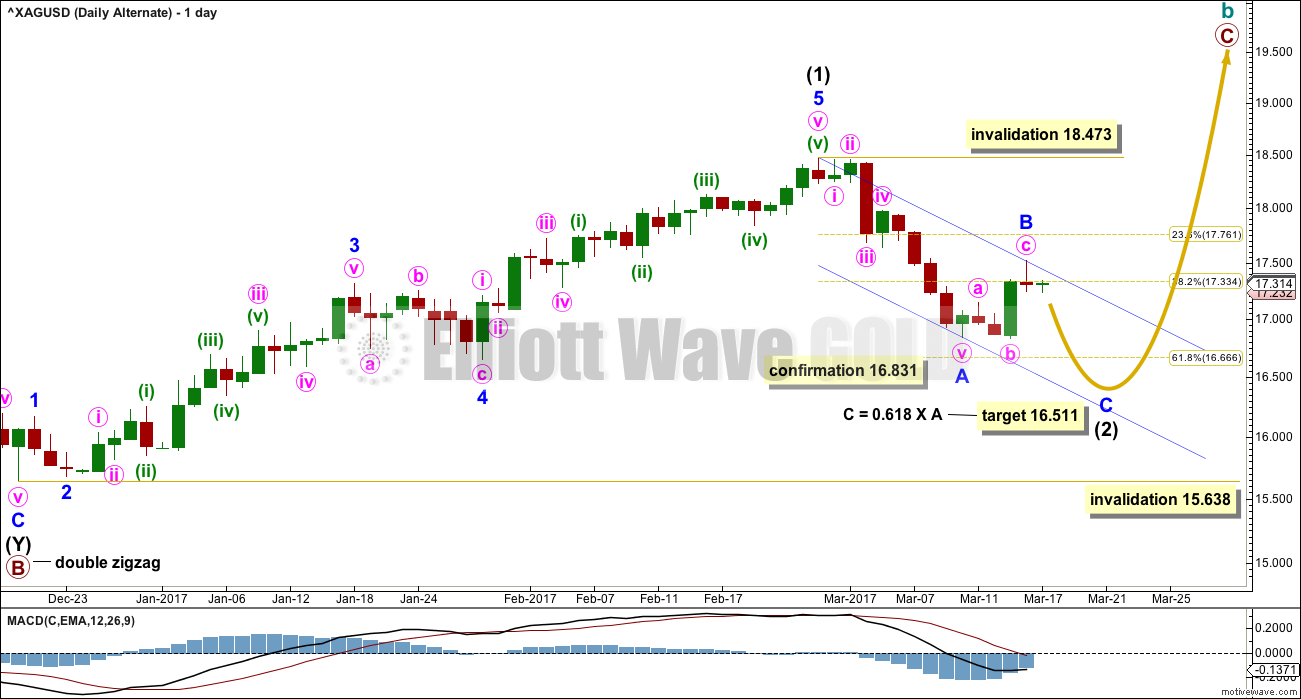
What if intermediate wave (2) is not over?
Minor wave A will fit as a five and minor wave B fits as a regular flat correction.
Intermediate wave (2) would be deeper than the 0.618 Fibonacci ratio if it meets the target.
Intermediate wave (2) may not move beyond the start of intermediate wave (1) below 15.638.
TECHNICAL ANALYSIS
WEEKLY CHART
Click chart to enlarge. Chart courtesy of StockCharts.com.
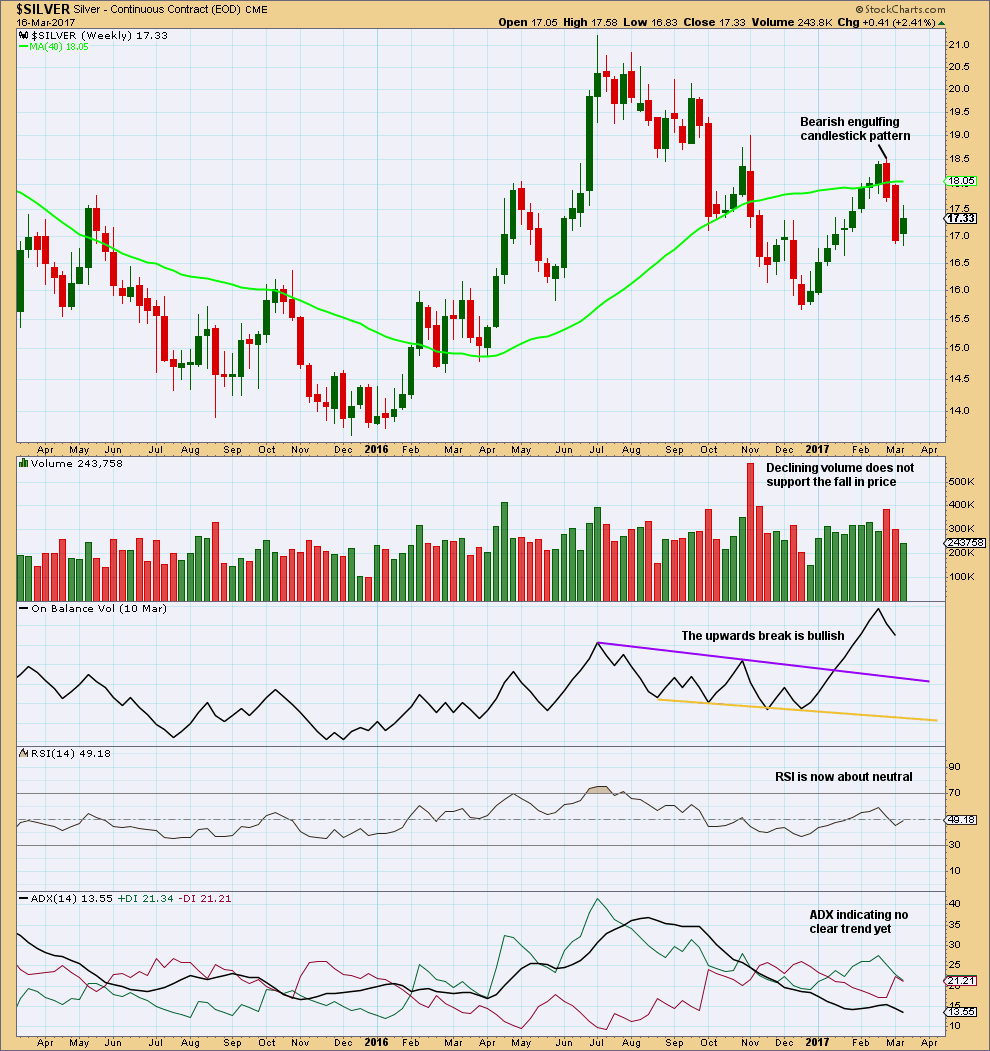
Last week saw price fall on declining volume. This is slightly bullish.
RSI remains neutral. ADX still is declining.
DAILY CHART
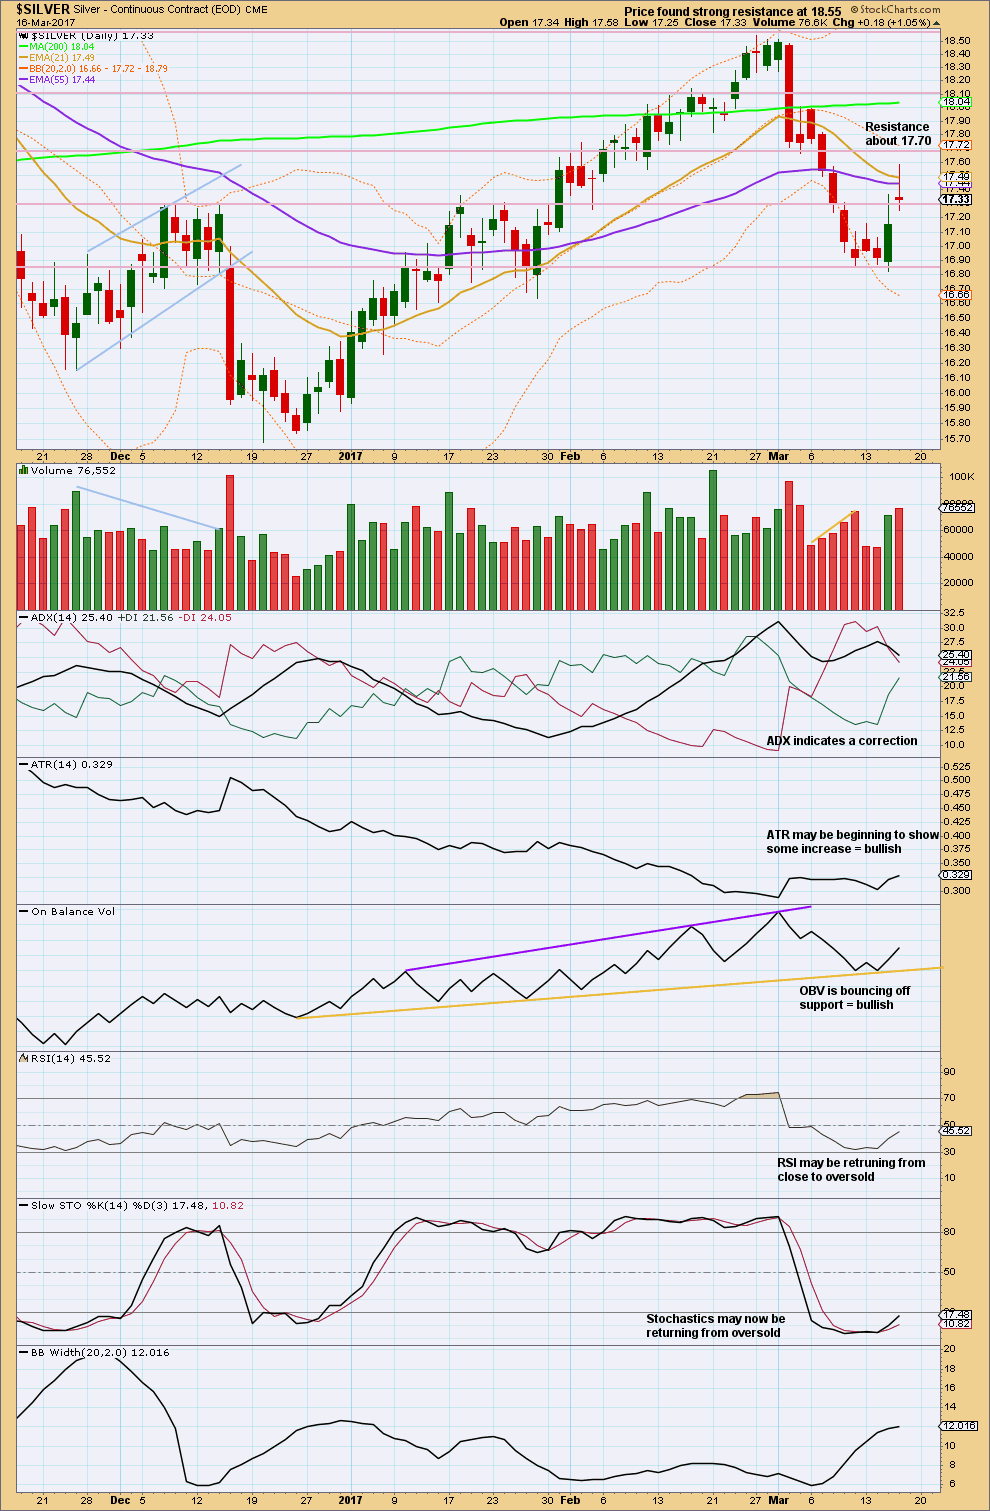
Click chart to enlarge. Chart courtesy of StockCharts.com.
At the end of the last wave down volume declined. Now volume is strong during upwards movement. This is bullish.
Upwards movement has been unfolding for two days. At this stage, it would be safest to assume this upwards movement may be a correction within the existing downwards trend.
However, ATR disagrees as it is slightly bullish. On Balance Volume is bullish.
Upwards movement may continue while Stochastics and RSI move further upwards from oversold.
This analysis is published @ 02:50 a.m. EST on 17th March, 2017.