An upwards breakout was again expected, but price remains range bound.
Summary: Look out for strong upwards movement from both Gold and GDX, which may happen during a price shock instigated by the release of Non Farm Payroll data during tomorrow’s session. The target is at 1,333 in the first instance. If this is wrong, it may not be high enough.
A new low below 1,244.72 now would indicate more downwards movement to the original target for this pullback at 1,230.
Trading advice is again given under the classic analysis section.
New updates to this analysis are in bold.
Last weekly charts are here and the last video on weekly wave counts is here.
Grand SuperCycle analysis is here.
MAIN ELLIOTT WAVE COUNT
DAILY CHART
This daily chart will suffice for both weekly charts.
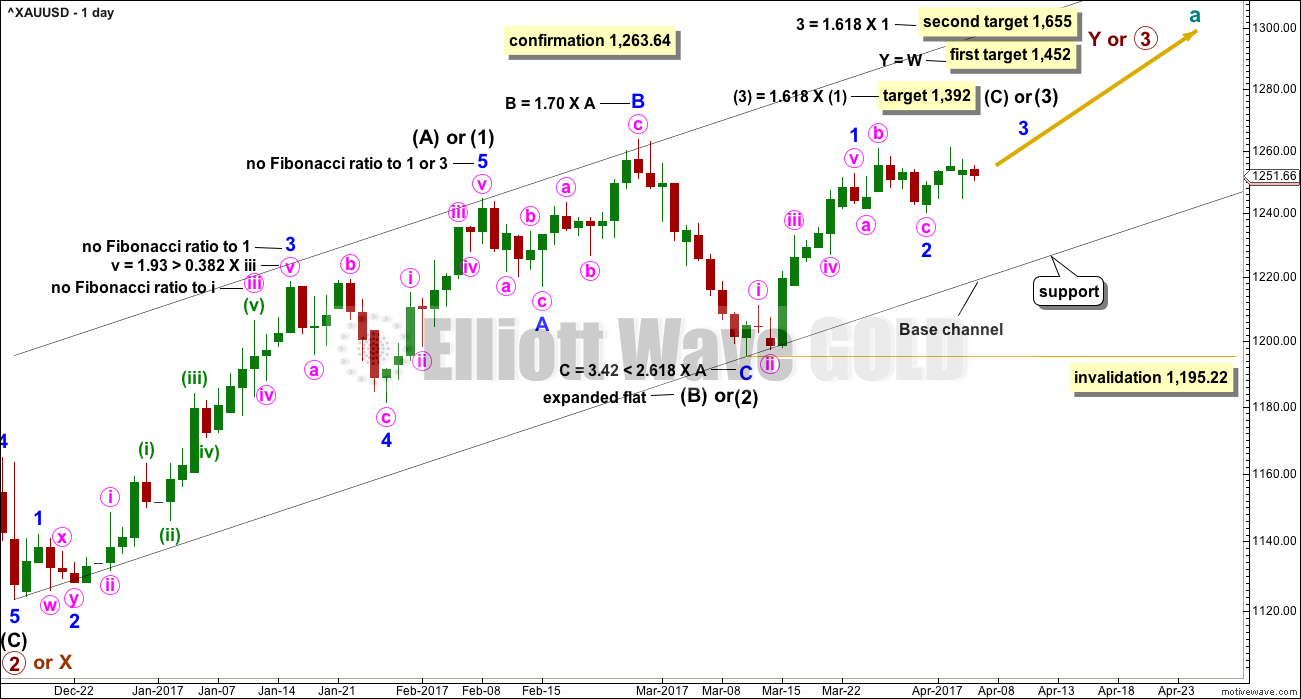
Upwards movement at primary degree is either a third wave (first weekly chart) to unfold as an impulse, or a Y wave (second weekly chart) to unfold as a zigzag. If upwards movement is a zigzag for primary wave Y, then it would be labelled intermediate waves (A) – (B) and now (C) to unfold.
Intermediate wave (1) or (A) is a complete five wave impulse lasting 39 days. Intermediate wave (2) or (B) looks like an expanded flat, which is a very common structure.
So far, within intermediate wave (3) or (C), the first wave up for minor wave 1 looks complete.
Two wave counts are again provided today at the hourly chart level.
The first hourly wave count expects that minor wave 3 has begun. The alternate looks at the possibility that minor wave 2 will still continue lower.
Minor wave 2 may not move beyond the start of minor wave 1 below 1,195.22.
HOURLY CHART
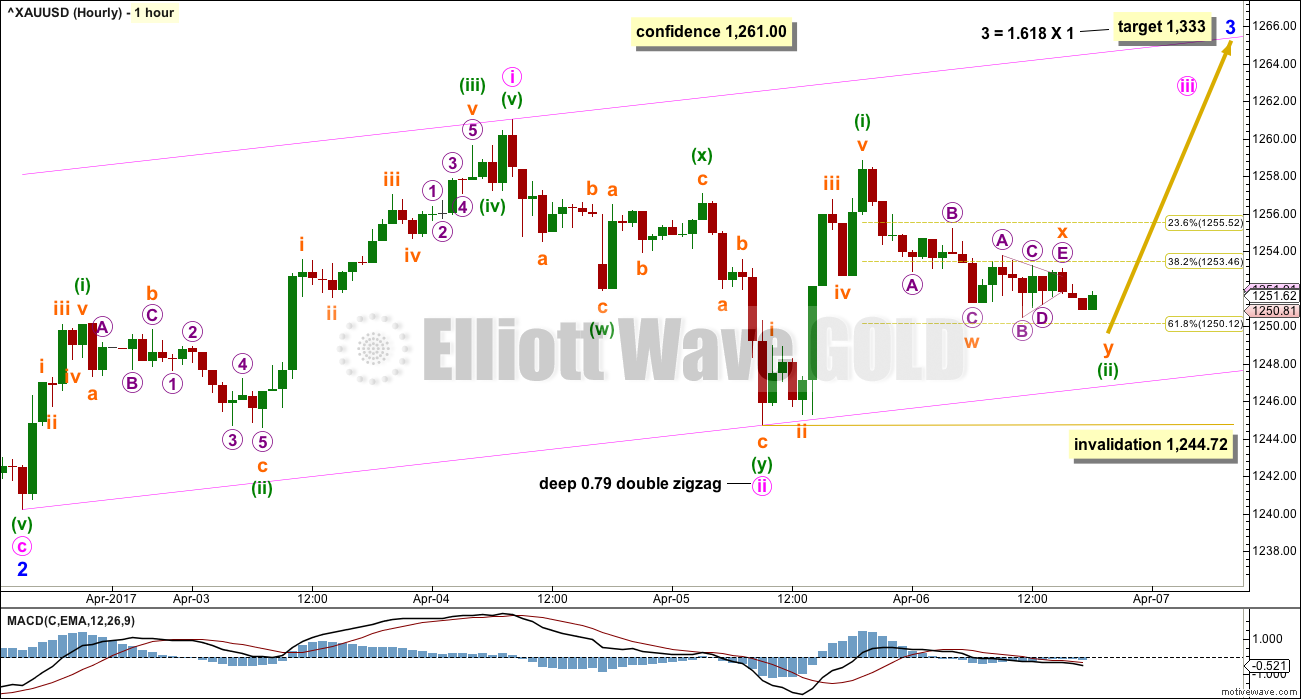
It is possible that minor wave 2 is over as a completed expanded flat correction. Minute wave c would be 1.51 longer than 1.618 the length of minute wave a. Minute wave c ends slightly below minute wave a, so a truncation is avoided.
Minor wave 3 may only subdivide as an impulse. Gold’s third waves often exhibit swift and strong fifth wave extensions. Minor wave 3 may end with a blowoff top.
Within minor wave 3, minute waves i and ii may now be complete. The middle of a large and strong third wave up should begin to build momentum.
Minute wave iii may only subdivide as an impulse. Within minute wave iii, minuette wave (i) may be complete. Minuette wave (ii) may yet move a little lower but may not move beyond the start of minuette wave (i) below 1,244.72.
Minuette wave (ii) today looks like an incomplete double zigzag. It looks likely to move lower, and it may find strong support at the lower edge of the pink base channel drawn about minute waves i and ii. Lower degree second wave corrections usually find support at a base channel drawn about a first and second wave one or more degrees higher.
Minute wave iii should have the power to break through resistance at the upper edge of the channel. When it has done that, then upwards momentum may increase strongly. The upper edge of the channel may then provide support.
A target is provided for minor wave 3 to end. No target is provided for minute wave iii because minute wave iv should be expected to be very brief and shallow.
With what looks like a five up for minuette wave (i) and now choppy slow downwards movement for minuette wave (ii), it looks like this main wave count has a better fit today.
ALTERNATE HOURLY CHART
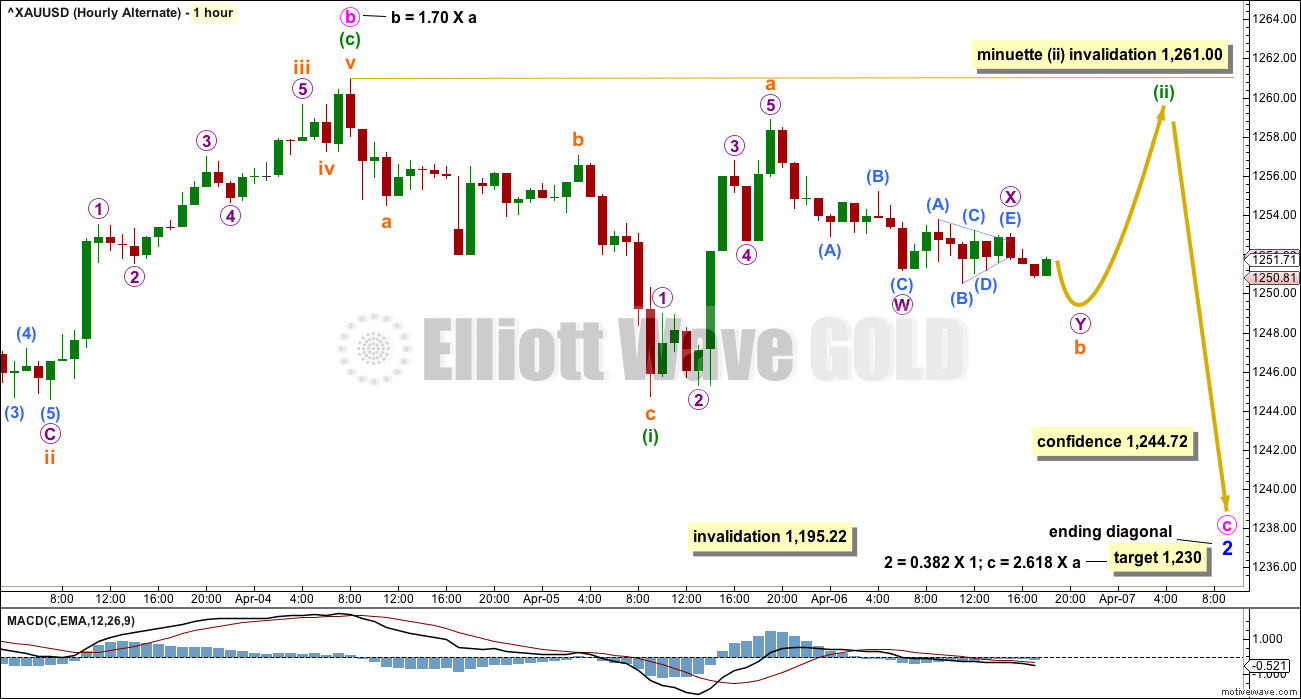
Within minor wave 2, it is possible that only minute wave b is over.
Minute wave b is longer than the common length of up to 1.38 times the length of minute wave a, but still within the allowable convention of up to 2 times the length of minute wave a.
If minute wave b has ended, it would subdivide as a regular flat correction.
Minute wave c may be unfolding as an ending diagonal. The downwards wave labelled minuette wave (i) will not fit well as an impulse, so it may be a zigzag. Within ending diagonals, all subwaves must subdivide as zigzags.
Minuette wave (ii) may not move beyond the start of minuette wave (i) above 1,261.00.
Any breach of 1,261 by any amount at any time frame would immediately invalidate this alternate hourly wave count.
ALTERNATE ELLIOTT WAVE COUNT
DAILY CHART
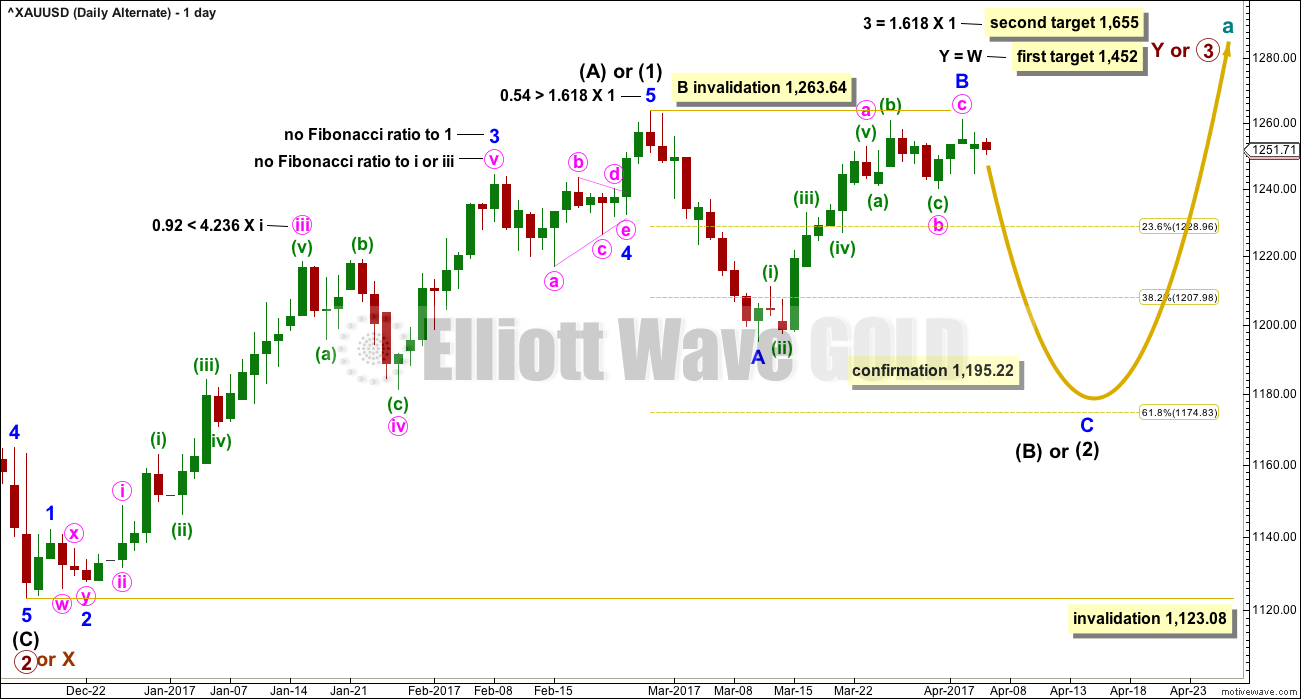
This alternate wave count is in response to queries from members.
Fibonacci ratios are noted on both daily charts, so that members may compare the main and alternate wave counts. This alternate wave count has slightly better Fibonacci ratios. This gives this wave count a reasonable probability. Due mostly to volume, this wave count is judged to have a lower probability than the main wave count.
At this stage, this wave count would be considered confirmed if price makes a new low below 1,195.22. At that stage, the target for intermediate wave (2) or (B) to end would be the 0.618 Fibonacci ratio of intermediate wave (1) or (A) at 1,175.
Minor wave B may not move beyond the start of minor wave A above 1,263.64.
TECHNICAL ANALYSIS
WEEKLY CHART
Click chart to enlarge. Chart courtesy of StockCharts.com.
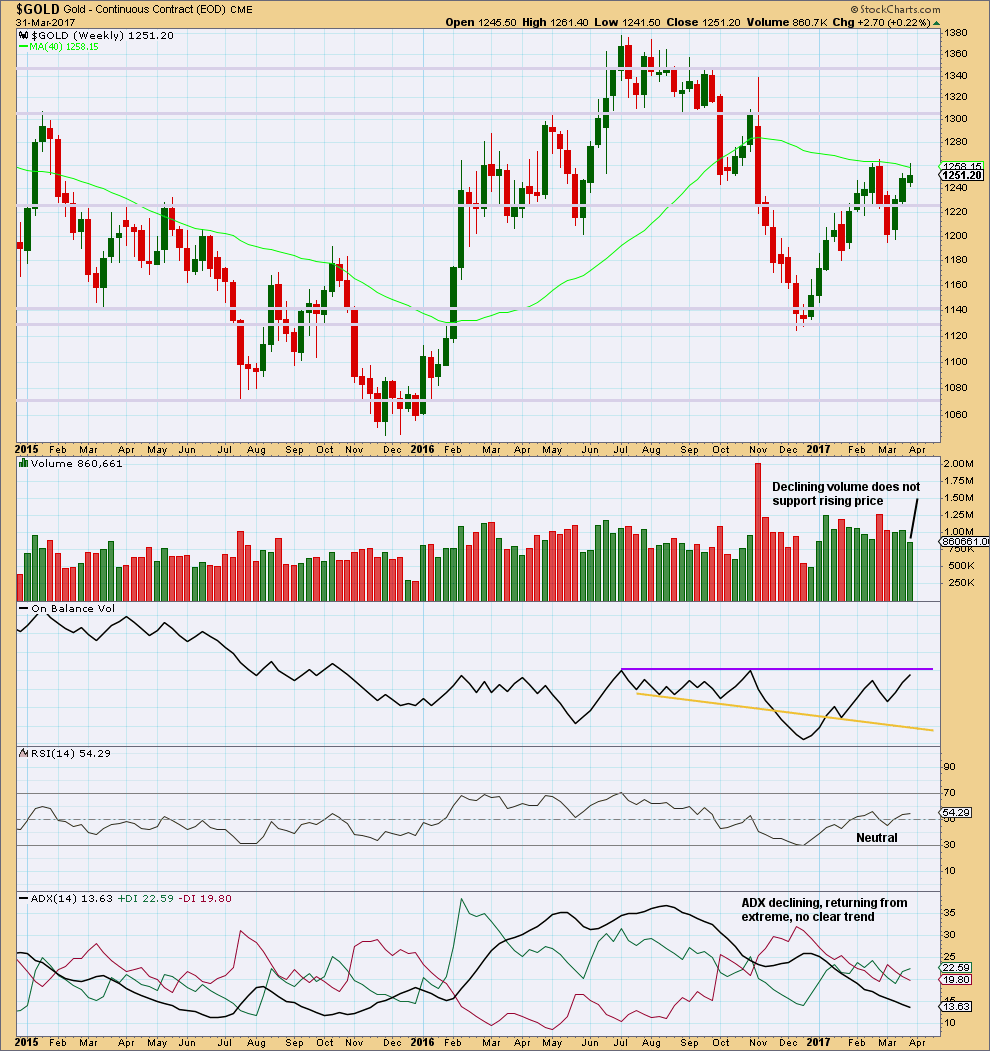
The small real body and long upper wick for the third weekly candlestick completes a stalled candlestick pattern. “It indicates bulls strength has been at least temporarily exhausted. A stalled candlestick pattern should be used to liquidate or protect longs, but usually not to short. It is generally more consequential at higher price levels.” (Nison, “Japanese Candlestick Charting Techniques”, page 100).
Lighter volume for the last upwards week is also concerning for bulls.
On Balance Volume is very close to resistance, but not quite there yet.
This weekly chart offers slightly more support to the alternate hourly Elliott wave count than the main hourly Elliott wave count.
DAILY CHART
Click chart to enlarge. Chart courtesy of StockCharts.com.
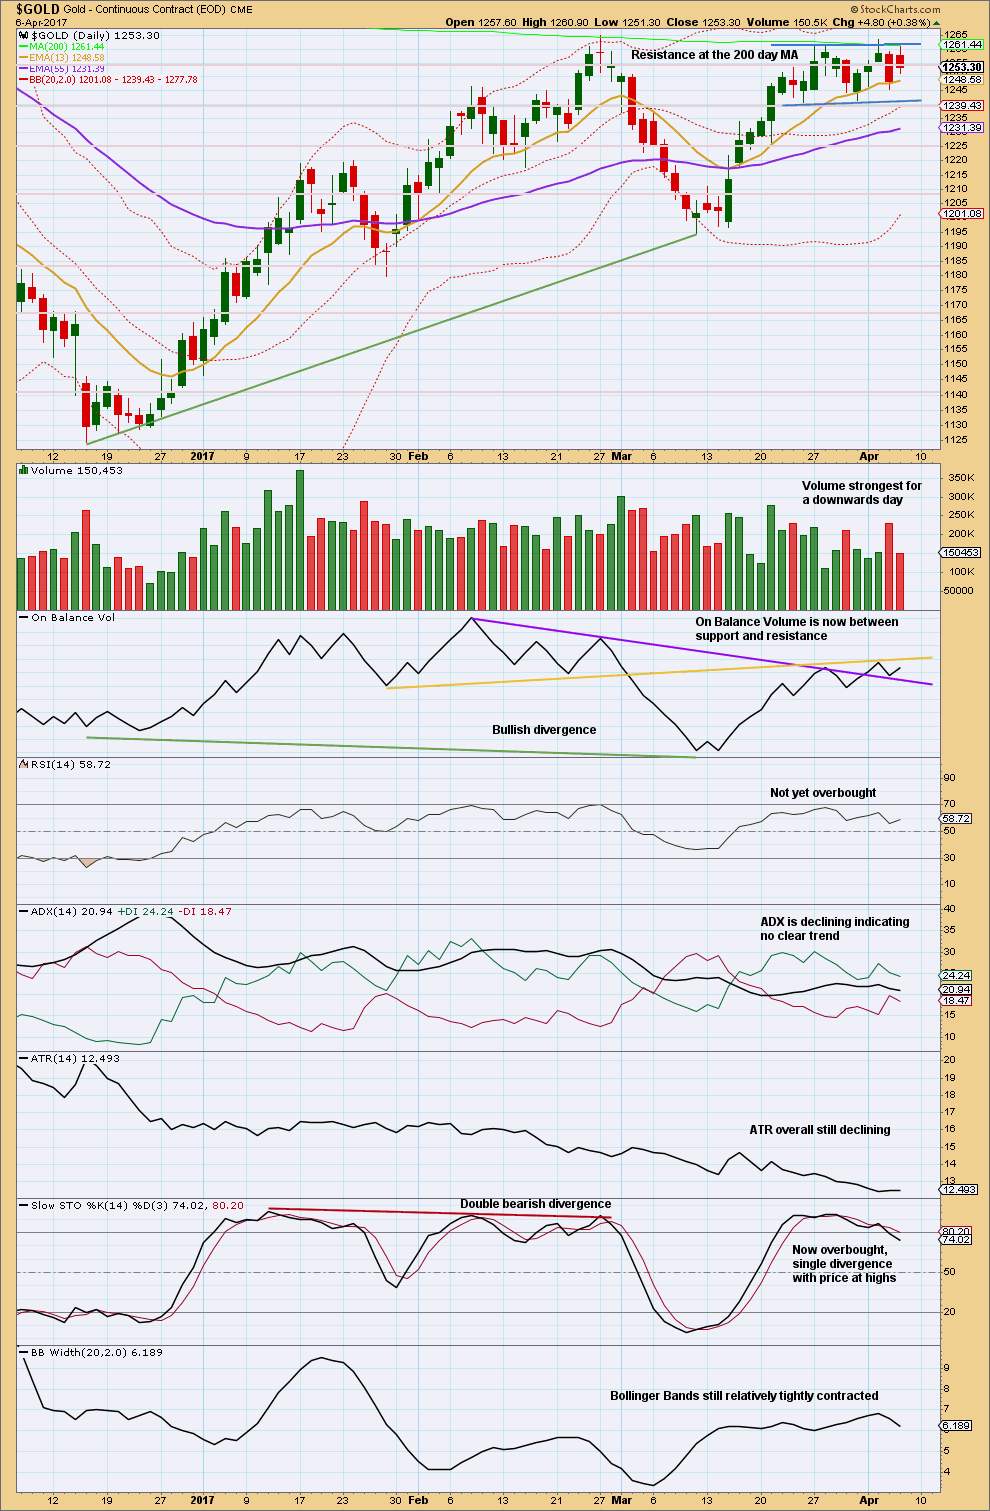
Gold remains range bound with resistance about 1,260 and support about 1,240. During this range bound period, it is a downwards day that has strongest volume suggesting now a downwards breakout is more likely than upwards.
However, On Balance Volume has recently broken above the purple line, which offered resistance, giving a reasonable bullish signal. Now On Balance Volume has turned down to test support at this line and it should be expected to hold and halt the fall in price.
The upper yellow line on On Balance Volume is slightly adjusted today. It is providing resistance. On Balance Volume is now squeezed between support and resistance.
There is very strong resistance here for price to overcome. The signal from On Balance Volume will be given reasonable weight in this analysis. It supports the main Elliott wave count.
Trading advice:
Profitable long positions may have stops moved up to breakeven to eliminate risk. The larger trend is most likely still up and corrections offer an opportunity to join the trend. Always use a stop. In this case, it should be at breakeven or preferably just below 1,244.72 now. Do not invest more than 1-5% of equity on any one trade.
More cautious traders may still like to wait for a classic breakout before entering the new trend.
GDX
DAILY CHART
Click chart to enlarge. Chart courtesy of StockCharts.com.
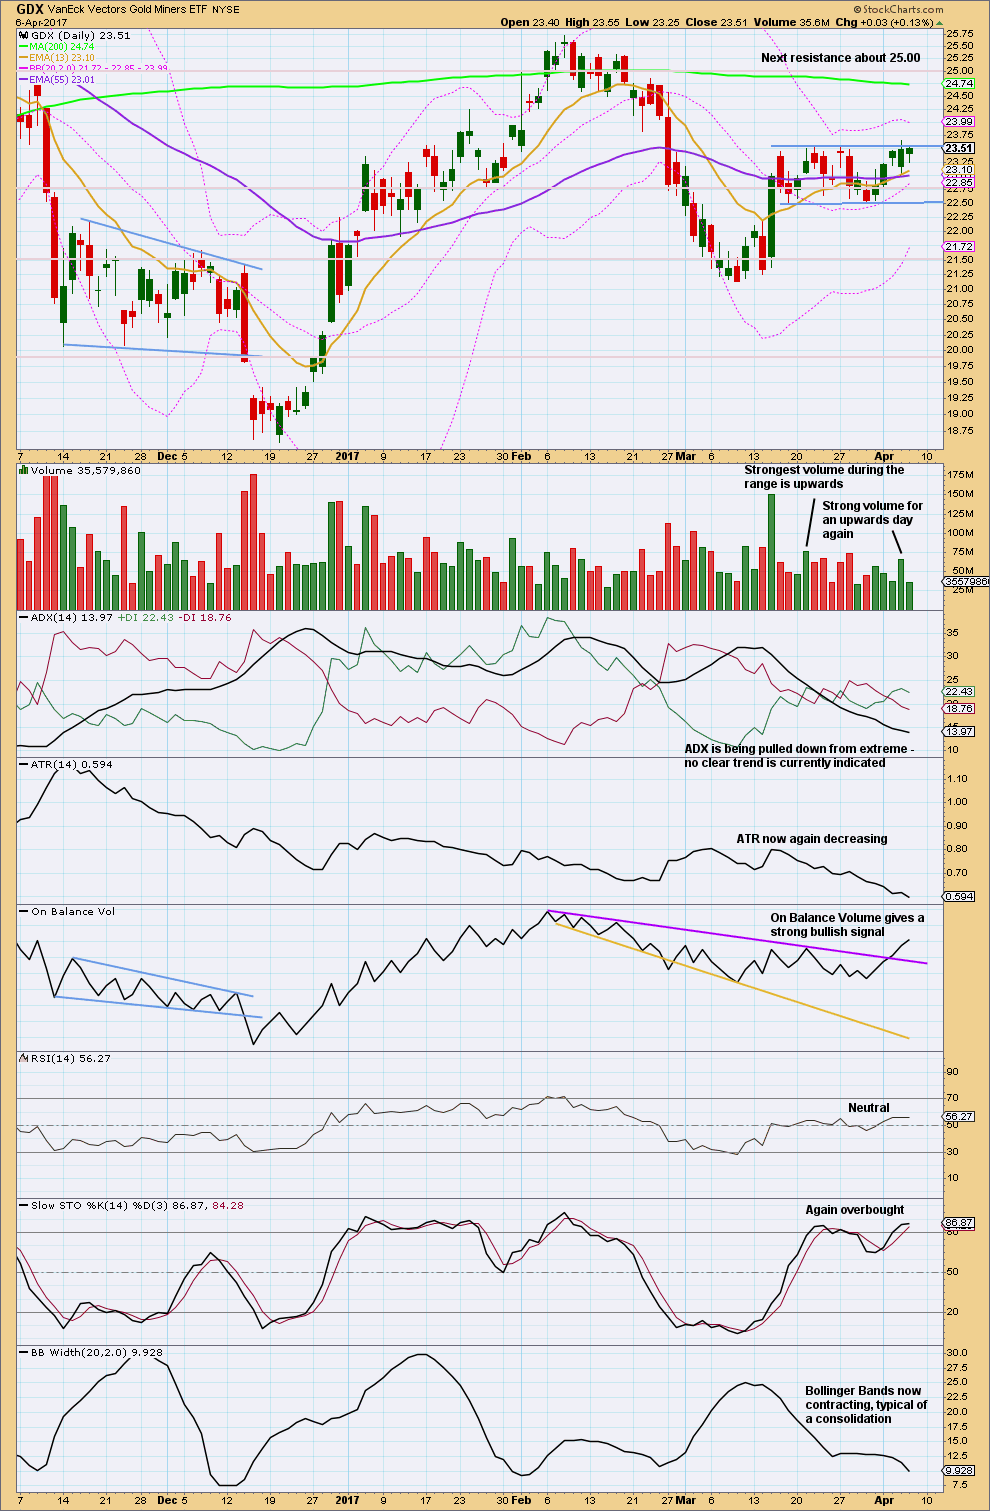
The bottom line for GDX is that it remains range bound. Volume suggests an upwards breakout is still more likely than downwards, but not by much. While this technique works more often than it fails, it is not certain.
On Balance Volume for GDX also gives a bullish signal. The purple trend line on On Balance Volume is long held, not too steeply sloped, and has been tested five times before. It has good technical significance. This signal should be given reasonable weight. Expect it is now very likely that GDX will break out upwards.
Look out for a strong upwards movement from GDX. GDX looks a little more clearly bullish than Gold at this stage.
Nothing in this analysis rules out a downwards breakout. The balance of probability looks to be bullish, but it is still possible price may yet break downwards for both GDX and Gold. In technical analysis nothing is certain, which is why risk management is so important.
This analysis is published @ 07:11 p.m. EST.

imo upside move for topping for the week with a pullback on the cards for Monday; a drop can be deeper than expected given that sister Silver is looking to pullback too….
Folks, just thinking out loud …
If the high at 1269.72 is subminuette 1 of minuette 3 of Minute 3, then it needs considerable spikes to reach 1392, where Intermediate 3 = 1.618 * Intermediate 1. This would require exceptionally strong 3rd and/or 5th waves along the way. The question is: would this be forthcoming, given the languid state in which gold is moving? The social mood is stubbornly lacking; even such an eye-catching event as an incursion into Syria, which under normal circumstances would constitute an act of war, had just shaken things up a bit but quickly degenerated into the same ground state. So what does it take to “persuade” traders to buy gold en masse? What is the trigger for the lemmings to follow mindlessly? I don’t know.
Now, what if 1269.72 had only been minuette 1 of Minute 3, something which I had alluded to in my response to ssandysc earlier? This is not impossible knowing that Minute 3 normally is of much longer duration than Minute 1 or 2. In this scenario, there is no necessity for epic gold movements. Moving upward slowly, but surely, will eventually achieve the purported goal.
Looking at the larger picture, what if the thinking that gold will move all the way up to 1600+ is wrong? That it only sluggishly chugs along, and never reaches anywhere remotely near that? You see, the S&P had been considered done with the upward price movement eons ago, yet it happily moved along due to sheer momentum. At the same time, Ellioticians had reworked their models time and time again to fit the picture. The same cannot be said of gold. Logically, gold is only valued as a safe haven (and yet this faith has been eroded), possibly a hedge. It generates no income, pays no interests or dividends, and the general consensus is that it is a “barbaric relic”, not something which the younger generation would die to own.
I don’t have an axe to grind. I try to trade without emotion. I just trade according to what I see on a daily basis. But, to me, the larger timeframes present a curious picture.
Thoughts appreciated.
Alan,
“Now, what if 1269.72 had only been minuette 1 of Minute 3, something which I had alluded to in my response to ssandysc earlier? This is not impossible knowing that Minute 3 normally is of much longer duration than Minute 1 or 2.”
Due to a very deep pullback, more suitable that its a Minuette (ii), I prefer this above scenario a better look and a better fit.
Also this would allow Minuette (iii) to be easily 1.618*(i) or 2.618*(i) as extended (iii) wave of a Minute iii of a Minor 3.
Thanks
ssandysc.
I echo your thoughts. This proposed scenario is more flexible. It does not require any stretched “hope” to achieve the target.
Alan, this is missing the last 4 days, but I had it handy, so reposting.
From a time standpoint, I think the move up ends in July. That puts the top of the channel near Lara’s first target @ 1,452. I doubt that we make it to the 2nd target @ 1,655.
I’ll defer to Lara on the count, but you may be right given the lethargic movement so far.
Dreamer.
I agree with you that the target is most likely to be 1452. This scenario is the one in which Cycle A comprises 3 waves: Primary W, X and Y. The 1655 target presumes Cycle A consists of 5 waves. It’s still too early to tell which one is correct.
Thank you for taking your time in sharing your chart. I have seen that before and I don’t dispute it. It gives a good idea of the future development in the price of gold. I am concerned only with the mode with which price could arrive at the target judging by the way things move very recently. That so many intelligent fellow members shared their apprehension during market hours in this forum page gives a glimpse into the microcosm of the investor mood. It was a 180 degree change from the start of the day when gold price surged after the missile strike; then it was all smiles and salutations to Lara. My contention is that it is not possible to arrive at 1452 without any extended 3rd/5th waves along the way. The question I posed was whether this is possible given the lackadaisical attitude shown by the investing crowd. It takes great faith to believe in the possibility that it would be so. The current evidence does not support it. I want to be pragmatic, and follow the “trend” unless proven otherwise.
I agree. We are all a little apprehensive. We need to see the Friday high broken and then the downtrend resistance around 1,280 -1,290 to regain our strong confidence! At this point, no trend lines or channels are broken, so the dream is still alive…
Gold spikes that occur seemingly as a result of news ate generally quickly reversed and I pay little attention. I would not be at all surprised to see deeper short term pullback but that in my view does not alter the fundamentally bullish outlook. The objective is to shake out weak hands and give an escape hatch for naked shorts.
Gold still looks good to me…. it’s just hitting some strong resistance that it needs to punch through.
Same with GDX. Strong resistance.
Also usually a commodity doesn’t slice through a strong layer of resistance the first time it tests it; in this case it’s the 200 day moving average. Silver also had a tough time going above its 200 day moving average, and finally gave way today.
It might have to test it a few times. It’s not going to be a one and done interaction…
Overall the picture is bullish, in the very short term though we might be going a little down or sideways…
I’ve not read all comments below yet…. got about half way. Will go through more carefully later on.
While price has made an important new high, I’m very very concerned about the long upper wick on today’s candlestick. Unless the last 20 minutes can see a good recovery here it’s looking bearish.
While a series of overlapping 1-2 waves is exactly how a strong third wave behaves, my classic TA sounds strong warnings at this time. Let’s see how volume is after the close.
However… for the pessimists here…. we do have so far a series of higher highs and higher lows. So for anyone who entered a few days ago (as I did) positions should now be profitable. Move stops to breakeven or just below 1,250.48 if that’s above your entry to protect a little profit. If I’m wrong you’ll have no loss, if I’m right you’ll have an excellent entry.
I will be publishing an alternate today, the candlestick demands I do.
So far price sits mostly within the base channel.
Hey, don’t pick on poor Chris. Getting away with “bridgegate” can be stressful you know…
I’m looking at a trend line from 6th July 2016 to 9th November 2016, and it’s still a bit higher. I have it about 1,290. On a semi-log scale on the daily chart.
I’ll add it onto today’s charts.
Is this the line you’re working with John?
Hmmm…..It seems most of people r expecting 3rd wave…. Gold is tricky…
All of the pessimism on this board and others is good for the bulls. Gold will climb a wall of worry…
Yeah, I feel your frustration. It’s disappointing because we though today was the day. You just can’t beat yourself up too much for missing a short term trade. Look at the bigger picture. As long as we keep seeing 5’s up and 3’s down, all is good. If this is what we think it is, big gains are just ahead. Gold and miners are hitting strong resistance that should break soon. My 2 cents lol
I sold in the strength as well…I might miss the big pot, but I like to secure profit….
I think this illustrates the count discussed below. Assuming that we get strong follow through to the upside on Monday, this looks reasonable. The middle of a third wave is expected to extend.
https://www.tradingview.com/x/K4ONyTwA/
Miners are slowly recovering. Volume should be strong today. I want to see the miners and gold close in green.
Thanks for chart….Dreamer….I do agree, we are seeing some recovery as we comment.
When you mention volume, like Lara, are you looking for close on strong volume via Stockcharts to give confidence, Or on a longer time frame, ie: 4hr do you trust Tradingview or another source….to give some confidence on longer term intraday basis?
Also….Dreamer….you thoughts on US Dollar if it closes strong today. Hourly chart shows full candlestick above H&S Neckline.
Another idea about gold IF Not in a 3rd yet. We go to 1278-1280– the July trend line mentioned in comments, then retrace for awhile.
Thanks…
I just look at the intraday volume on GLD and the miners to try and gauge where the day may finish. Not an exact science. I generally just use my brokers volume.
So three, 1-2, 1-2, 1-2 counts to kick off the 3rd wave? Is that “normal”? I am by no means and EWT expert…beginner. It just seems as though a lot of indecision, and today’s down candle seems impulsive, so it does not seem like the beginning of wave 3 action. Please advise.
Absolutely! All the 1-2’s is what gives the middle of a 3rd wave it’s powerful move up. It’s like stretching a rubber band or winding up a toy, etc.
And the move down today is a “3” so far.
I’ll zoom in and show you the detail.
David, here’s the zoomed in look. The “impulse” you saw was just the C wave of an A-B-C down.
Hope this helps.
https://www.tradingview.com/x/8ekzgIhJ/
Ty, Dreamer. I like the windup simile.
The journey into the north is shorter then the journey into the south… hope it is a gap close. Very exciting to come to opening values 🙂
This action does not feel like a 3rd wave and with the dollar ripping thru resistance, and miners lagging, makes me very suspicious of this rally attempt.
At the moment…I have to lean towards David’s thoughts…looks tentative….though, it IS a Friday…late in day….But if it Is really Bullish…it should show strength…ASAP.
A thought on Bear count. What if we finished Minute icrc @ 1261.11 (Investing.com hrly chart, 3_27_9pm EDT), then Minuette (a) or (w) @ 1239.86(3_31_10pm), then Minuette (b) or (x) @ hi 1270.62 today….now we go down in Minuette (c) or (y) to form Minute iicrc of Minor 3. Like Olga says, perhaps my degrees are a bit off, but….you’ll get the jist if you plot this.
I know many want to lean bullish in the here and now….but keep an open mind to at least some more possible downside.
Lara and or Alan,
Could 8:30 AM be the peak of subminiuette i and now at 2:01 PM be the Wave ii or a little lower yet? of Minuette (iii) of Minute 3?
fwiw – that’s how I’m counting it atm. Not sure that subminuette is the right degree though.
Hi Olga! Nice to see you here 🙂
Hi ssandysc,
I had placed that count on my chart just before your wrote. I looks rational for the Bull count. As others have commented….it Is a very Deep pullback.
Bear count has several possibilities…..I still trying to figure in addition to Lara’s counts…
Hi ssandysc.
That is how I count it too.
The peak at 1269.72 is subminuette 1 of minuette 3 of Minute 3.
The current very deep retrace is subminuette 2.
Invalidation point is 1250.69, the start of subminuette 1.
If invalidated, I will move everything down one degree.
The peak at 1269.72 becomes minuette 1 and the current drop is minuette 2.
Invalidation point 1244.72, the end of Minute 2.
Bankster raid people. They have to unwind those massive naked shorts and it looks like they are attempting to do it with a supply dump. Surprise! 😉
Weak hands will be shaken out no doubt…watch what happens…
Agreed. I’m getting mighty suspicious but I still think this move down is another second wave retrace of a first wave which started at 1244 or so.
Not totally sure of the degree atm as not been studying gold for a couple weeks but unless I’m missing something, Lara’s hourly chart still looks valid to me atm.
Hi Olga!! Missed Ya! 🙂
Thanks Verne – hope you’re well buddy. I’m usually not very far away 🙂
I think differently here.
This sudden fall gave silver chance to complete its minor 2. If gold dosnt break 1250$ than this will be a great example.
What is this happening..😱😱
Olga, is it usual for a third wave to have a deep retrace after a second wave with a deep retrace?
Too many 1,2’s (deep or not) puts me on my guard but doesn’t break any rules. One thing I know for sure is that Mr Market likes to frustrate the heck out of us and these kind of moves do just that.
I’m sure Lara will shed light on how usual this particular move is for gold and I guess that will form part of the basis of her view about alternate probabilities.
I’m now getting very suspicious of this very deep retrace (if that’s what it is) but will hold on until 1249.50.
That said – Zooming out to higher degrees – 1244 is a better line in the sand than 1249 imho.
The move up from 1244 looks like a nice 5 wave pattern to me so this move down from todays highs may be another second wave if that is correct.
Perfect touch of bottom of the channel. Love it!
Exactly – and the 76.4% fib retrace.
Whilst we remain above 1249 I’m all in.
Yeh, foxed again. Daily alternate in play
Me too. Bearish pin bar forming on the daily
Looking for a really strong 3rd wave action.
May be late today or on monday.
Does the gap have to fill before it can go higher? I agree that this price action is so strange. I was looking forward to those short coverings. Great call by Lara on gold!
April 4 , Lara:” Look out for strong upwards movement from both Gold and GDX, which may happen within the next 24 hours. The target is at 1,333 in the first instance. If this is wrong, it may not be high enough.”
Excellent analysis. Such performance has happen time after time over my stay here and following Lara’s advise.
Thanks Lara.
Dollar looking quite strong. Uptrend line support held and at the same time made a false downside break to get the weak longs to sell. RSI > 50 shows momentum. OBV held its support line and looks strong.
Price is testing the 100.785 high from 3/16/15. If this resistance gives way, dollar is likely to test the 103.82 high on January 1st of this year. Should be a negative for gold. I sold my gold today to lock in profits and hopefully buy back lower.
If 1260 breaks, which is strong support, 1250 CHVN first support and 1240 CLVN next.
Euro also has decent correlation to gold and it is selling off.
Yen, has better correlation and it looking fine but up against resistance so it may pullback a bit from here.
Gold 5 waves up on hourly on this 3rd wave up. 3 wave pullback now..being in 2nd wave up now so one more down to 1262ish, then blast off higher?
Minute ii was double zigzag, so minute iv more likely to be flat or triangle?
Came within a gnat’s a$$ of invalidation but seems to be holding nicely above upper edge of Lara’s channel now
Ben, Not even close to invalidation. The waves are different levels. 😀
Ok, thanks Dreamer, still got a lot to learn ☺️
David, looks like you missed another level. The top in your chart is only Subminuette 5. The correction now is Minuette 4.
There will be another big move up on Monday for Minuette 5. 😀
Bankster shenanigans…be patient….
Top O’ the mornin’ all!
I want to pay homage to Lara’s stellar analysis with reference to a tune from one of my all-time favorite Stevie Wonder albums. I know it will date me a bit but some of you here might just appreciate it! Have a great day all!
https://www.youtube.com/watch?v=qS2yMn3JbQk
Thanks Verne!
Unfortunately Mr Market has other ideas I think.
Was looking at daily chart dating back to high 2011 and there is a nice downtrend line which comes in at about 1290. If gold can break through that level and stay above 1300 this would be very bullish. Question I have on alternate daily is whether this could be seen as expanded flat B wave if the A wave down from 1263 could be seen as a 3 wave rather than 5 wave structure. This would mean we would be topping out soon between 1280-1305.
Invalidation upto 1261 now I think?
No. Down around 1,253. Look close. There’s a subminuette level. 😀
Absolutely stunning analysis Lara (and other contributors here), congratulations.
Wow amazing – Elliott wave signalled that NFP’s would be bad!
There she goes 🚀
No. because I think we are still in wave 3 not wave 4!
Sorry, short-term invalidation as I think we are in minuette iv of minute iii now??
Wow.
New invalidation 1259 (minuette i territory)?
Found this cycles chart on Goldtent by Spock. Interesting…
There are so many analysts that are bearish gold and miners now. Look how much room there is for the miners % bulls to go up. I think there’s going to be a bunch of short covering to fuel the rally!
So I’m expecting a strong move up in GDX tomorrow. Assuming that we break above the symmetrical triangle, don’t get too hung up on the waves and targets as shown. They could change as it’s difficult to nail all the possibilities in advance.
As long as Gold / GDX keeps moving upward as expected, the best advice that I can give is to “hold” your winners and let them run. Trying to time all the little waves is a fools game. You will likely make more by holding. We could get several big days up in a row as we may be entering the sweet spot of the wave count (3rd waves @ 4 degrees!) Good luck to all!
https://www.tradingview.com/x/9FB8oCCz/
Thats a good advice. Specailly in GOLD. Trading small waves against trend for small profits will lead to miss the big gain. Its better to stick with the positions with trailing sl.
For now i think the stops can be moved up. Just below 1250.80$ i guess.
Any comments.
Thank you…for the wonderful charts …Dreamer. They are a Great aid!
A potential buyout target… 😉
OOOOuu. Bye Bye alternate daily! 🙂 🙂
This is from LAST NIGHT’s analysis!
“Summary: Look out for strong upwards movement from both Gold and GDX, which may still happen within the next 24 hours.”
Incredible!!! 🏋🏼👏🏼👏🏼👏🏼
Gold and Silver breaking out. Expect a big day for GDX, GDXJ, etc. tomorrow!
https://www.tradingview.com/x/4D4Dbv1D/
Lara the wave queen at her best. What an analysis. Mindblowing
I agree with u dreamer.
All alternates are invalidated :). Now we hav only one count.
🏄♀️ Lara will be surfing the waves tomorrow! 🤙
People will say the military strike on Syria moved gold up, but we know the real reason; the Elliott Wave count and social mood predicted the move
That’s the beauty of EW!
I can see people now cheering given that gold is most likely reaching for the skies, when hitherto there had been gloom. I absolutely love EW and technical analysis (especially the Ichimoku analysis I posted two days ago), all portending to a bullish trend in gold. Overnight, I made quite a respectable sum from the missile fracas.
That said, it is good to remember what Mao Tsedung once said: “Good cat or bad cat? The cat that can catch mice is a good cat!” As long as we have faith in our own due diligence, and of course to act upon it, all’s end that ends well.
Hey Alan, would like to learn more about the Ichimoku cloud charts and how you use them. Maybe you could post them more often and provide a little education with the posts? The only thing I know about them is above is good, below is bad… How do they differ from MA’s or EMA’s, what is the significance of wider clouds, etc. Many thanks!
Certainly, Dreamer.
But I can do it only on a daily basis should there be any noticeable trend change. BarCharts do not have an Ichimoku function. StockCharts do.
Ichimoku is pretty utilitarian, showing a lot of different aspects at one time. The word Ichimoku comes from Japan, and it means “at one glance”. I’ll do a concise writeup once I have the time to do so.
Forgot to mention.
For today, the analysis indicates a backtest of the broken resistance level at 1257-1260. Resistance is at 1280.
For next week, it points to a push to at least 1285-1310 as no divergence is indicated.