
On Balance Volume gave a signal early in the week that a deeper pullback may unfold. Price found support at the Fibonacci 55 day moving average before turning upwards.
Summary: Silver is looking more bullish for the mid term, but short term look for some small consolidation. The larger trend is up.
New updates to this analysis are in bold.
Last monthly chart is here.
ELLIOTT WAVE COUNT
WEEKLY CHART
Click chart to enlarge.
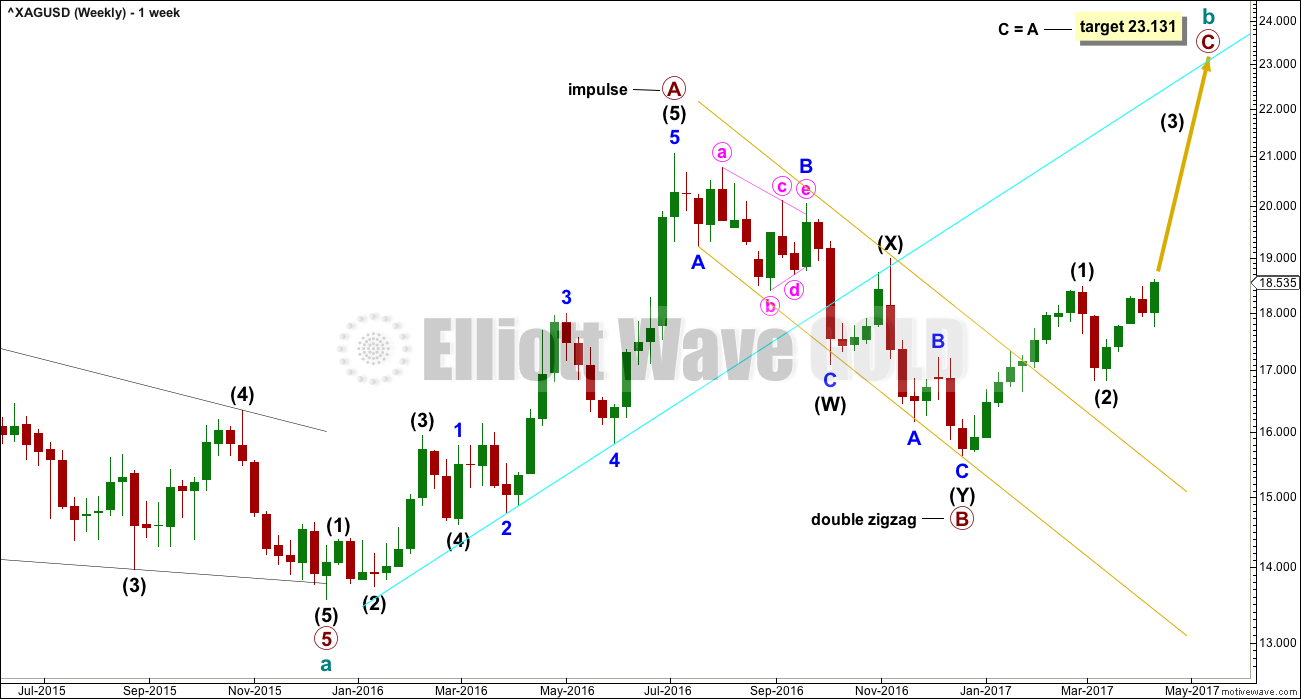
Upwards movement labelled primary wave A fits perfectly as an impulse.
Primary wave B fits as a deep double zigzag. Primary wave C must subdivide as a five wave structure. The target expects it to reach the most common Fibonacci ratio to primary wave A.
Primary wave A lasted 29 weeks. Primary wave B lasted 24 weeks. These waves are in proportion.
DAILY CHART
Click chart to enlarge.
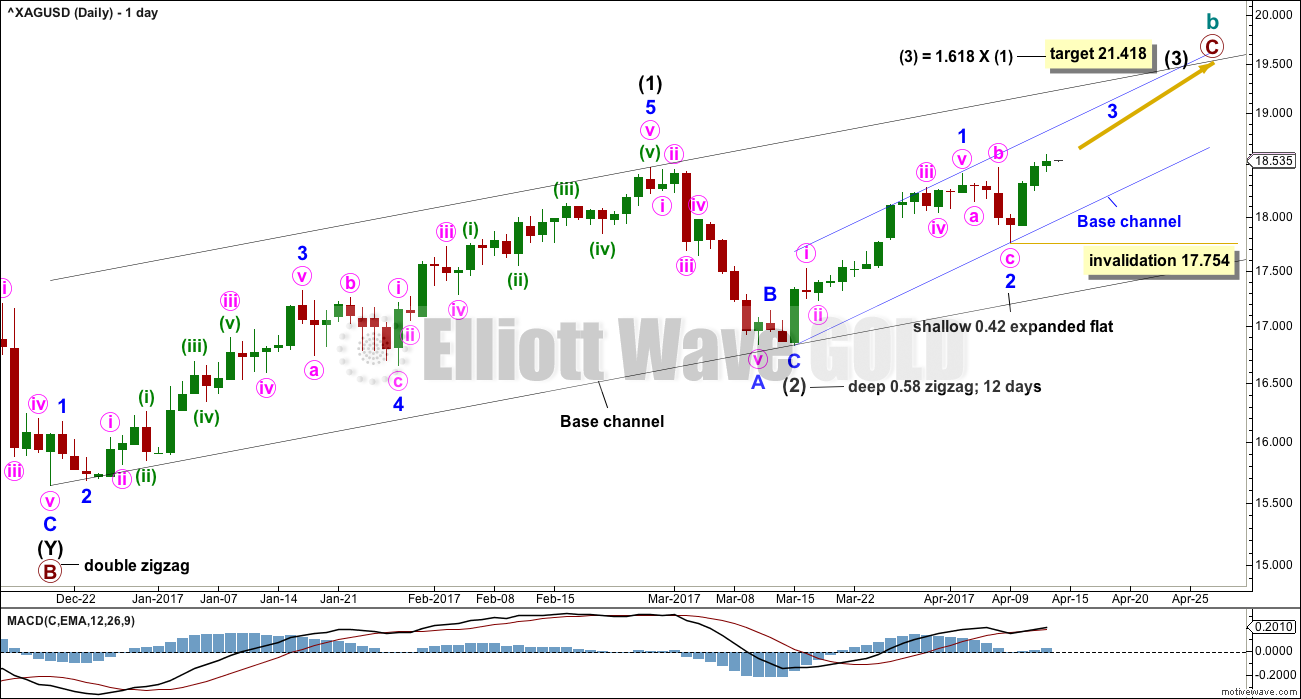
A third wave up now at two degrees may be beginning for Silver. Within minor wave 3, no second wave correction may move beyond the start of its first wave below 17.754.
A blue base channel is added. Along the way up corrections should find strong support at the lower edge of this channel. If this wave count is correct, then this trend line should not be breached.
TECHNICAL ANALYSIS
WEEKLY CHART
Click chart to enlarge. Chart courtesy of StockCharts.com.
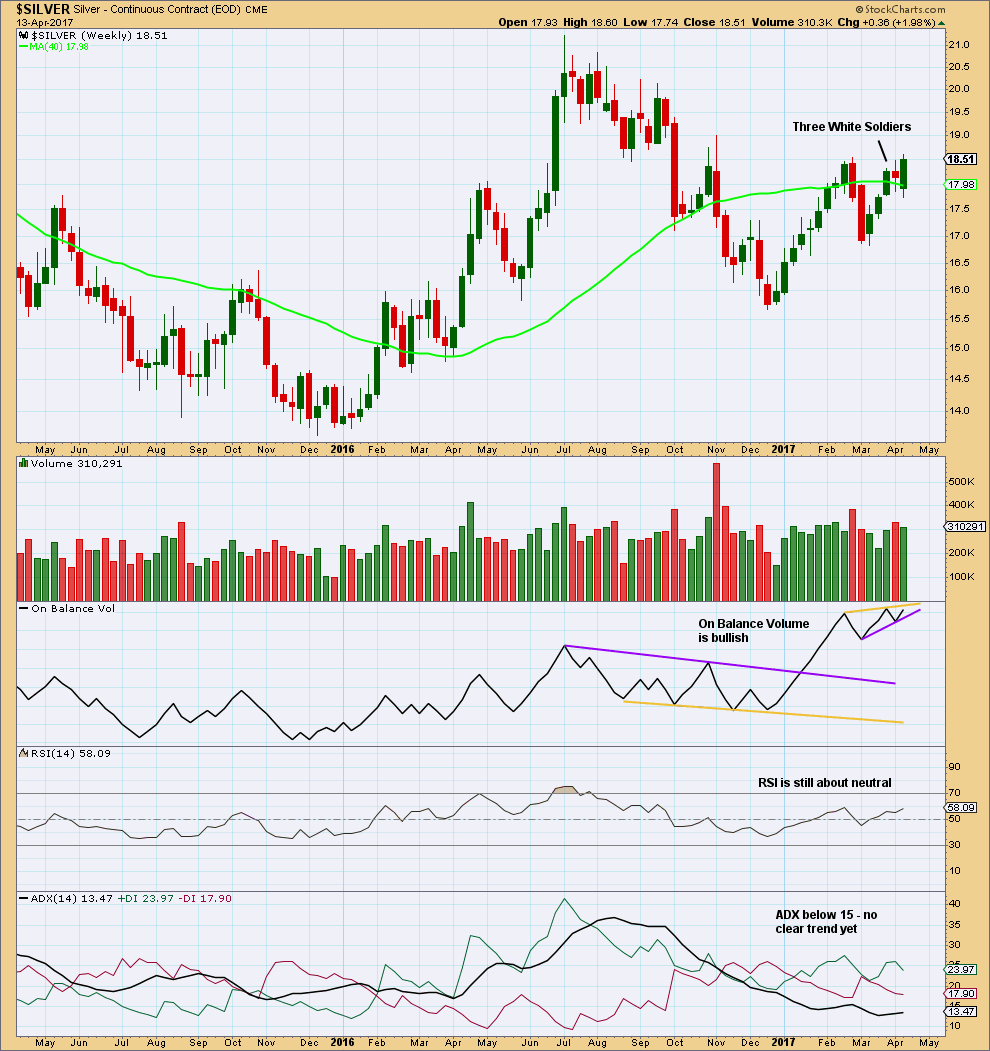
This upwards wave has begun with a bullish candlestick pattern, Three Advancing White Soldiers.
On Balance Volume is now constrained within two new trend lines. A break out of this zone would provide a new signal. At this time, On Balance Volume is bullish.
DAILY CHART
Click chart to enlarge. Chart courtesy of StockCharts.com.
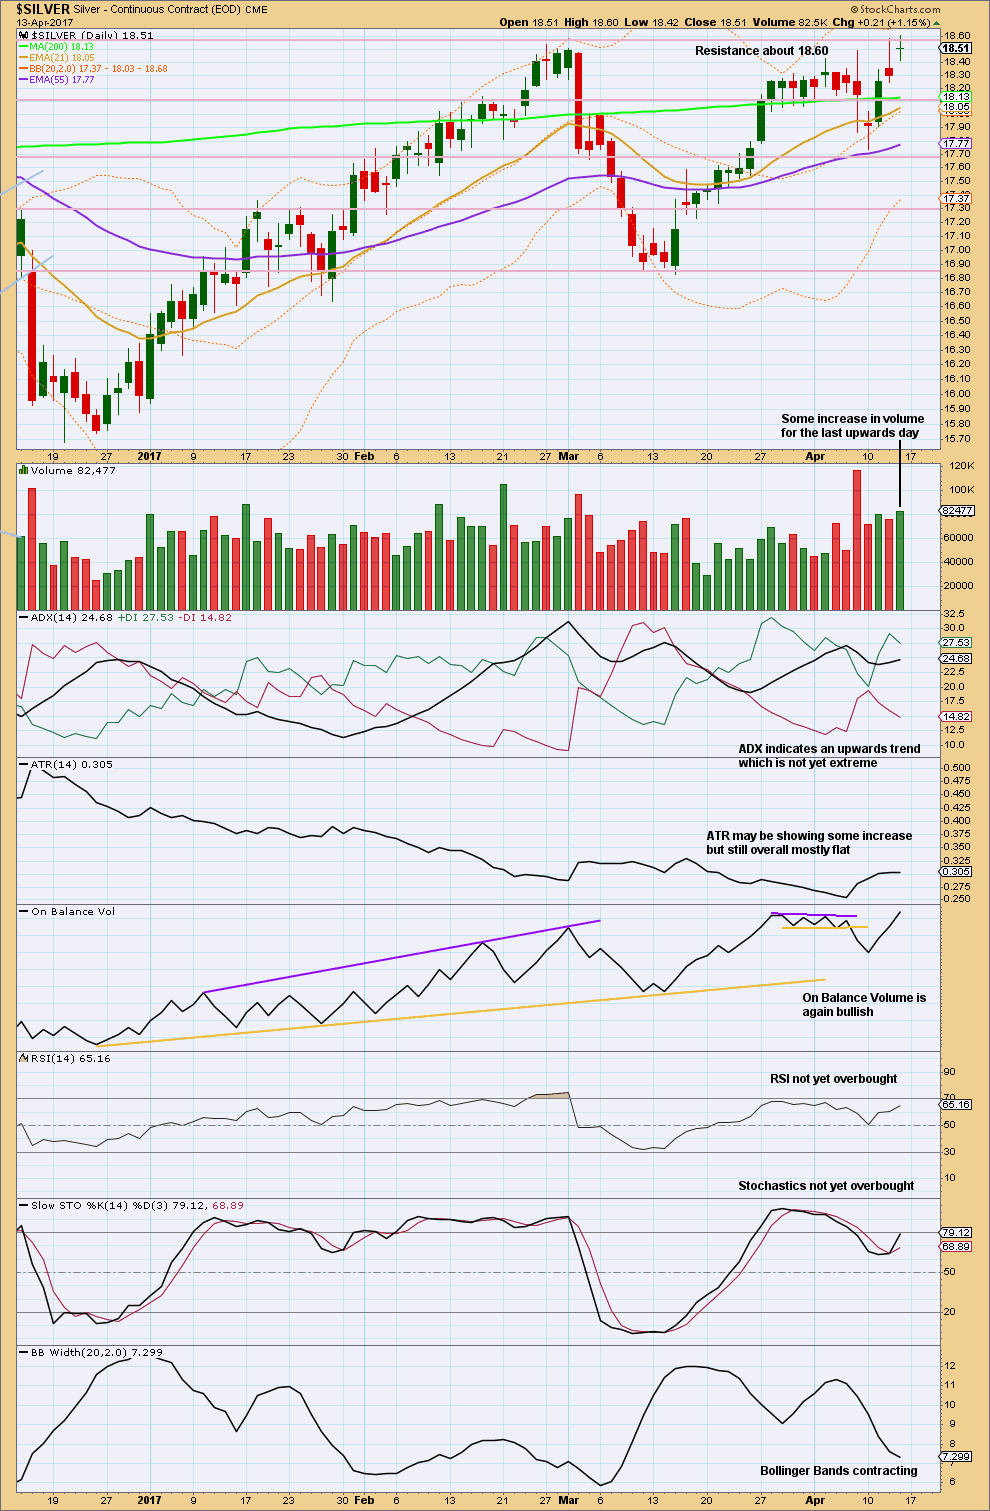
The doji following a red candlestick with a long upper wick is concerning for Silver. This is bearish.
ADX is bullish. Volume is bullish. On Balance Volume is bullish.
ATR is neutral. RSI is neutral. Stochastics is neutral.
Bollinger Bands are bearish.
A small consolidation here may resolve the bearishness in the last two daily candlesticks as price finds resistance about 18.60. Thereafter, expect an upwards trend to most likely continue.
This analysis is published @ 02:03 a.m. EST.