
Downwards movement was expected for the last week from Silver. Price has moved higher.
Summary: Use the pink Elliott channel on the first daily chart. If price breaks below the channel, expect the next wave down has begun. Stops may be set just above the last swing high. The target would be at 15.72.
If price makes a new high above the 23rd of May, then expect more upwards movement to possibly make a new high above 18.641.
New updates to this analysis are in bold.
Last monthly chart is here.
ELLIOTT WAVE COUNT
FIRST WEEKLY CHART
Click chart to enlarge.
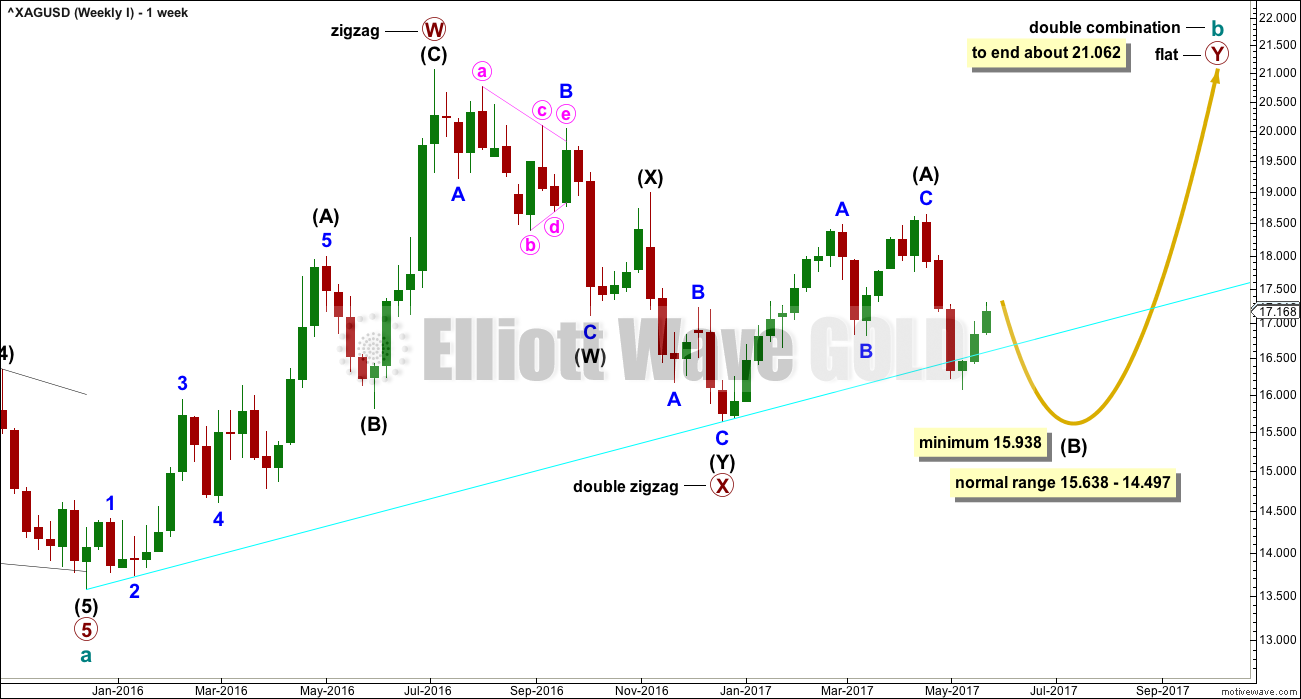
Cycle wave b may be completing as a double combination: zigzag – X – flat. The second structure, a flat correction for primary wave Y, may be underway.
Within a flat correction, intermediate wave (B) must retrace a minimum 0.9 length of intermediate wave (A) at 15.938. The common range for intermediate wave (B) is from 1 to 1.38 the length of intermediate wave (A).
Intermediate wave (B) may make a new price extreme beyond the start of intermediate wave (A), as in an expanded flat, which are very common structures.
The bigger picture for cycle wave b would expect primary wave Y to end about the same level as primary wave W about 21.062. The purpose of combinations is to take up time and move price sideways. To achieve this purpose the second structure in the double normally ends about the same level as the first.
The maximum number of corrective structures is three within combinations (and multiple zigzags). This maximum applies to sub-waves W, Y and Z. Within these structures, they may only be labelled as simple A-B-C corrections (or A-B-C-D-E in the case of triangles). They may not themselves be labeled multiples as that would increase the number of corrections within the structure beyond three and violate the rule.
X waves are joining structures and they are not counted in the maximum total of three (otherwise the maximum would be five). X waves may be any corrective structure, including multiples.
FIRST DAILY CHART
Click chart to enlarge.
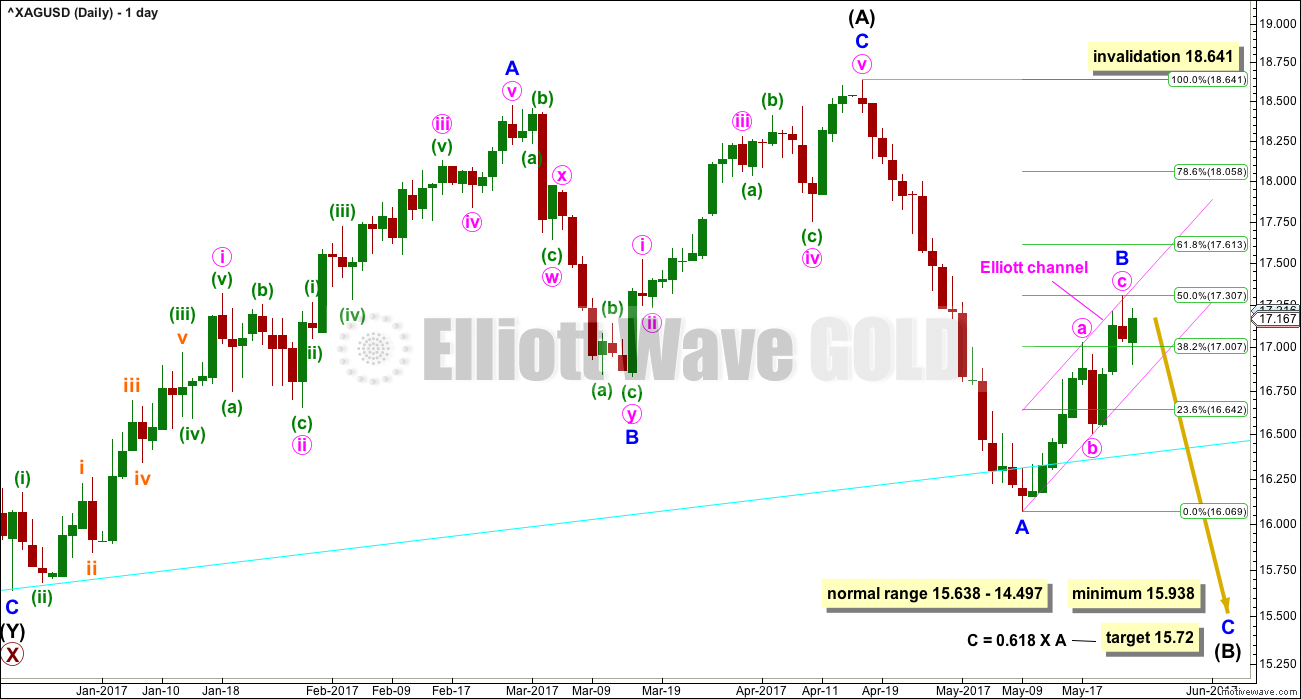
Intermediate wave (B) may be unfolding as a zigzag. Within Intermediate wave (B), minor wave A looks like an impulse. Minor wave B may not move beyond its start above 18.641.
Minor wave B has reached up to very close to 0.5 the length of minor wave A (this is not a Fibonacci ratio, nor is 0.782, but both may be useful in trading).
This week the structure of minor wave B now looks to be a clear three wave structure, so far, that fits very nicely within the Elliott channel.
Use the channel for trading. If a full daily candlestick completes below the lower edge and not touching it, that shall provide confidence that minor wave B is over and minor wave C should be underway. At that stage, consider entering short, and look out for a curve up to back test prior resistance.
Always use a stop, in this case above the last swing high. Invest only 1-3% of equity on any one trade.
At this stage, a target is recalculated for minor wave C to end which would see intermediate wave (B) meet the minimum requirement for a flat correction.
SECOND WEEKLY CHART
Click chart to enlarge.
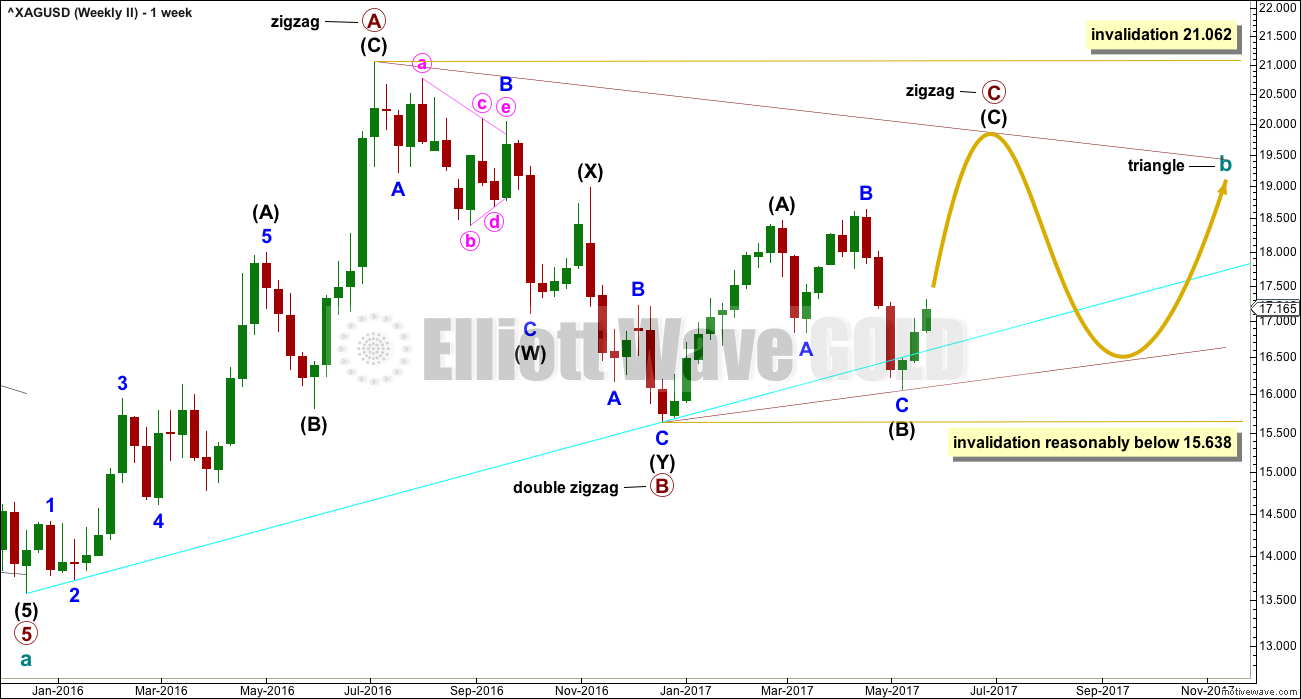
It is also possible that cycle wave b may be completing as a triangle. Only because combinations are more common than triangles is this a second wave count.
Within a triangle, only one of the sub-waves may be a more complicated multiple. Primary wave B subdivides as a double zigzag. Primary waves C, D and E may only be single threes.
Within a contracting or barrier triangle, primary wave C may not move beyond the end of primary wave A above 21.062.
To label primary wave C over at the last high of the 17th of April would see the A-C trend line too steeply sloped to have a normal look. It would be only a 0.55 length of primary wave B, which is unusually short for a triangle sub-wave. It would look more likely that primary wave C is not over.
Within a contracting triangle, primary wave D (nor any part of primary wave C) may not move beyond the end of primary wave B below 15.638.
Within a barrier triangle, primary wave D should end about the same point as primary wave B. As long as the B-D trend line remains essentially flat the triangle will remain valid. In practice, this means that primary wave D may move slightly below the end of primary wave B (this is the only Elliott wave rule which is not black and white).
The final wave of primary wave E may not move beyond the end of primary wave C. It would most likely fall short of the A-C trend line.
This second wave count expects a large consolidation to continue for months.
SECOND DAILY CHART
Click chart to enlarge.
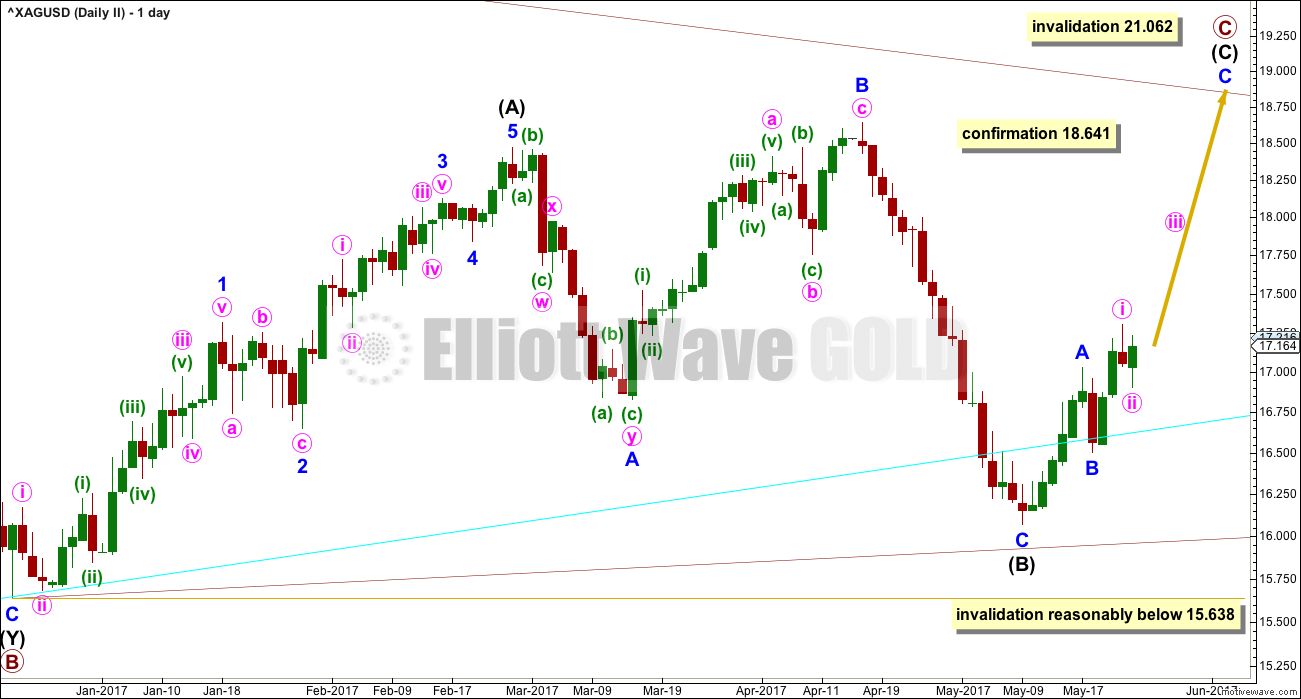
Primary wave C may be an incomplete zigzag.
A new high above 18.641 would at this stage invalidate the first wave count and provide some confirmation of this second wave count.
A new low reasonably below 15.638 would see this second wave count invalidated and the first wave count increase in probability.
Upwards movement needs to overall continue here for this wave count to retain the right look.
TECHNICAL ANALYSIS
WEEKLY CHART
Click chart to enlarge. Chart courtesy of StockCharts.com.
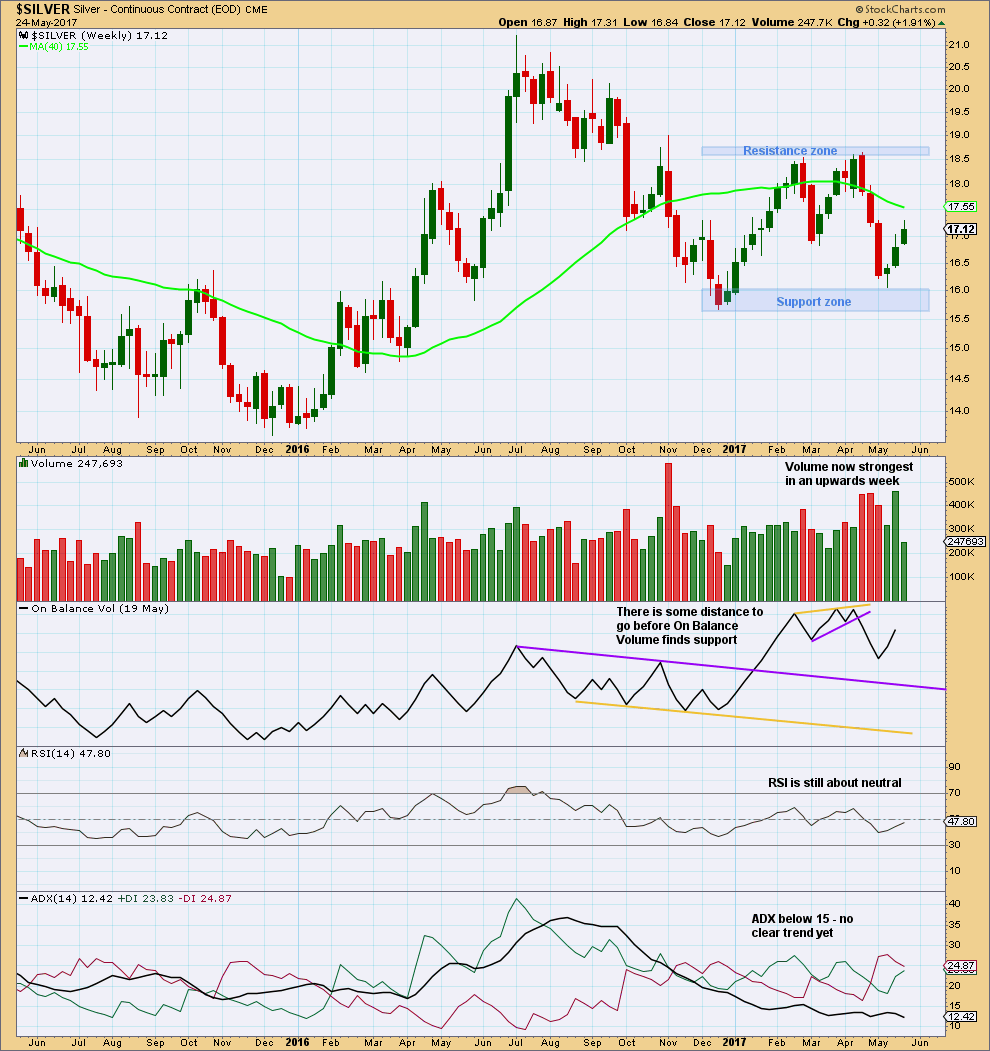
Volume is now strongest during an upwards week. This suggests an upwards breakout from the trading range is more likely than downwards.
Overall, Silver is now in a large consolidation at the weekly chart level. Support is about 16.05 – 15.70 and resistance is about 18.55 – 18.65. ADX agrees that price is consolidating.
DAILY CHART
Click chart to enlarge. Chart courtesy of StockCharts.com.
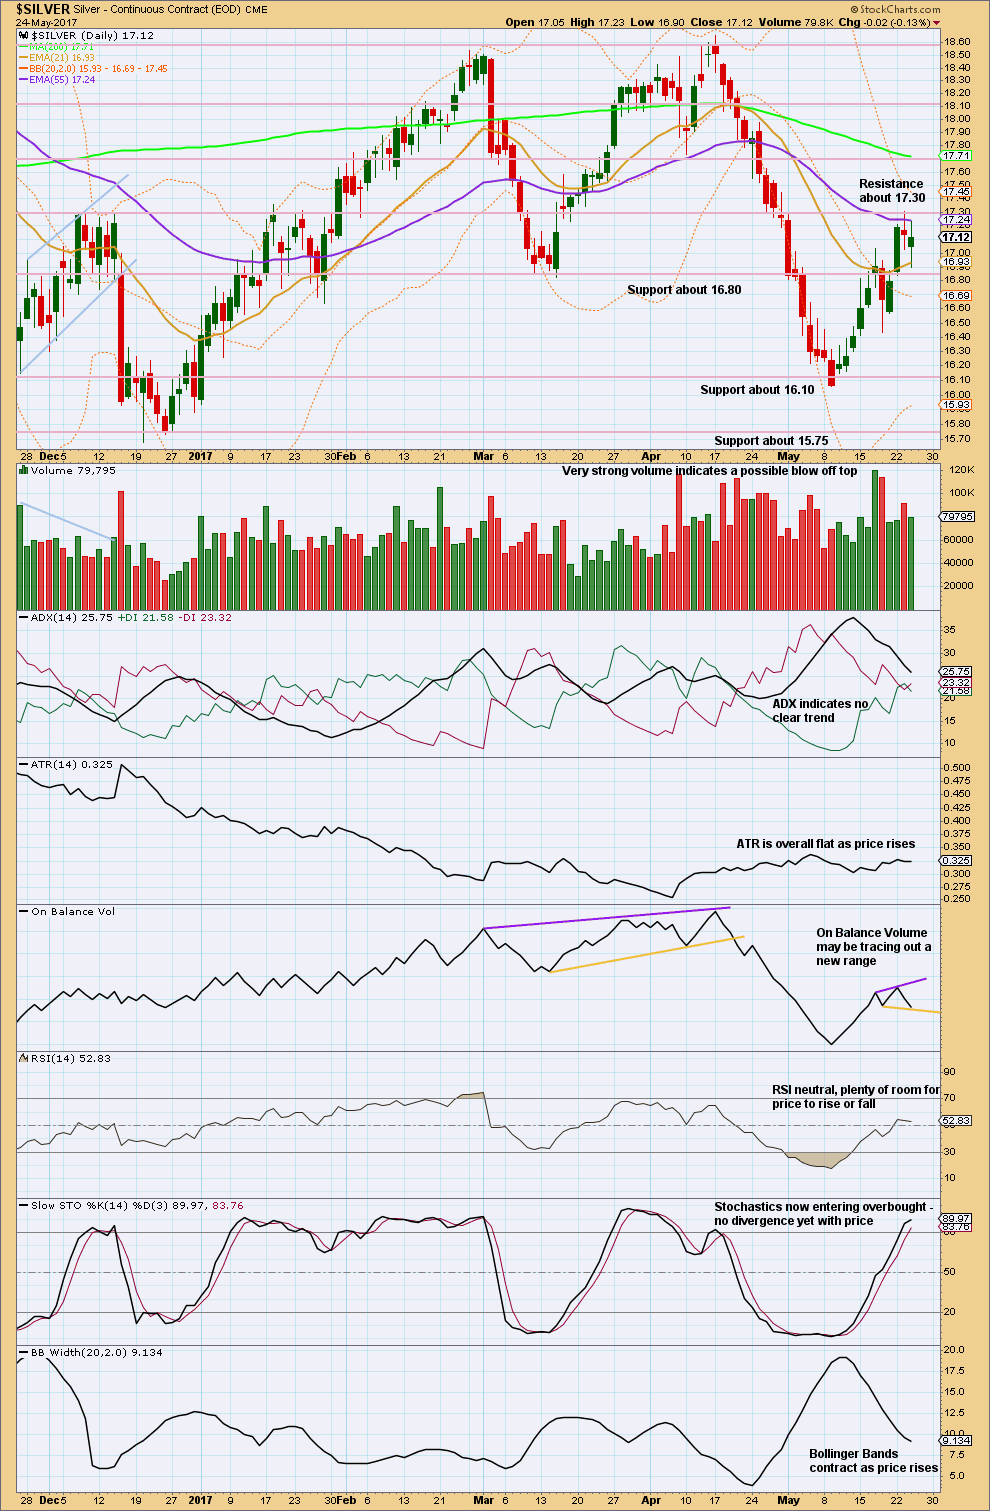
ATR, ADX and Bollinger Bands all agree that upwards movement looks more likely to be a counter trend movement than a new healthy trend. Upwards movement lacks range, no longer has good support from volume, and lacks increasing volatility.
The last two daily candlesticks are Spinning Tops. This represents indecision and shifts the short term trend from up to neutral. The downwards day saw some increase in volume and this is bearish.
Overall, the classic technical analysis for Silver is inconclusive. This week it looks slightly more bearish than last week.
This analysis is published @ 11:28 p.m. EST.